

cemagraphics
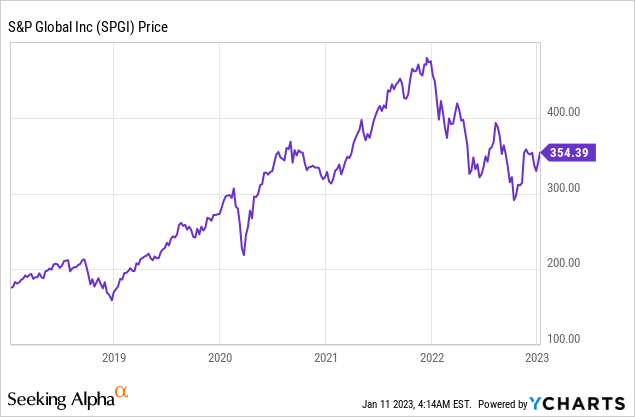
S&P Global (NYSE:SPGI) is a leading provider of financial market data, analytics software, and research. The company serves 99% of the Fortune 500 and has over 13,000 customers globally. S&P Global is currently facing short-term headwinds from a tepid macroeconomic environment that has impacted the “issuance” market, which refers to the issue of new bonds, securities etc. The good news is economic conditions tend to be cyclical and management is estimated to have deployed ~$12 billion for share buybacks in 2022. In addition, the “Big Data” industry was valued at $162.6 billion in 2021 and is forecast to grow at a solid 11% compounded annual growth rate [CAGR], reaching $263.4 billion by 2026. S&P Global is poised to benefit from this industry growth as a leading data provider. In this post, I’m going to revisit its business model, financials, and valuation, let’s dive in.
Business Model
S&P Global’s business operates across many key business segments which include:
- S&P Global Ratings
- S&P Global Market Intelligence
- S&P Global Platts
- S&P Commodity Insights
- S&P Global Mobility
- S&P Dow Jones Indices
The company is most well-known for its Global ratings business which is one of the “big three” credit rating agencies along with Moody’s and Fitch. In addition, its S&P Dow Jones Indices segment created the Dow Jones industrial average and of course, the “S&P 500” index, which is highly regarded as the best way to track the top 500 U.S companies.
S&P Global Brands (Investor presentation 2022)
S&P Global generates its revenue through a variety of methods, such as licensing, consulting, research, and of course its ratings & indices. The company is well diversified across multiple industries and even has a strong Private Markets offering. According to a study cited by S&P Global, Private Capital Assets under management [AUM] are forecast to be worth over $18 trillion by 2026.
Growing Financials
S&P Global reported mixed financial results for the third quarter of 2022. Revenue was $2.86 billion, which missed analyst estimates by $57.82 million and declined by 8% year over year. This was driven by a few factors, firstly if we take into account foreign exchange rate headwinds, revenue only declined by 6% year over year, which is slightly better. S&P Global generates three-quarters of its revenue in U.S. dollars and thus it is fairly protected against foreign exchange headwinds. As the U.S. dollar is currently strong relative to most other currencies. In addition, the company has a hedging program in place, which helps to ease FX exchange rates.
In S&P’s core business, four of its six business units reported growth which is positive. However, its Global Ratings business reported a significant revenue decline of 33% year over year. This was mainly caused by a challenging “issuance” cycle, which was driven by the macroeconomic environment. A positive is the economy tends to be cyclical and thus I expect a rebound in this segment long term. It also should be noted that 84% of S&P’s revenue is recurring by nature and this increased by 2% year over year. Recurring revenue and S&P’s established and diverse customer base means consistency is likely long-term.
S&P Global Ratings (Q3,22 report)
S&P Global Market Intelligence increased revenue by 4% year over year. This was driven by a solid commercial pipeline of opportunities, as surprisingly companies want more data during times of economic uncertainty. Its equities, data & analytics product increased its revenue by 12% year over year.
In addition, its Trucost, environmental data product, reported strong revenue growth of 39% year over year, on an adjusted basis. Global Warming is becoming an even greater challenge for companies and the world. According to a study by S&P Global, 66% of companies have at least one asset under high physical risk, this could be from an earthquake, hurricane, etc. It has also been forecast that companies will have an estimated $283 billion in “Carbon pricing risk” by 2025.
S&P Global market intelligence (Q3,22 report)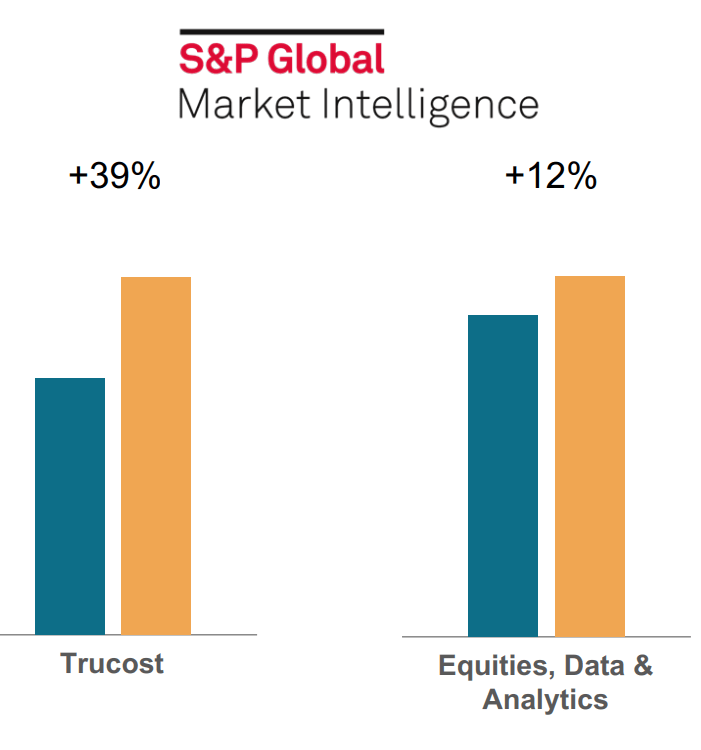
S&P’s Commodity insights segment was bolstered as a result of its huge $140 billion merger IHS Markit completed in early 2022. In the third quarter, this segment reported revenue growth of 5% year over year, which was positive. There are strong synergies between the Market intelligence and Commodity insights segment, which thus offers a number of cross-selling opportunities. In the third quarter of 2022, the company generated over 3,000 cross-selling opportunities which were a strong positive and a partial indicator that the merger has been successful. Its Platts Dimensions SaaS product for commodity markets was launched just one year ago and has increased its users by over four times since its launch. Its active users have also doubled in the last 6 months alone. In the fourth quarter, management is expecting a strong rebound in its desktop business, which is also another positive data point.
Platts Dimensions Product (Q3,22 report)
Moving onto its other segments, its global mobility business increased its revenue by a solid 8% year over year. This was driven by the insurance underwriting industry, which showed strength with strong demand for CARFAX, its recently acquired product for checking vehicle history.
S&P Global (Q3,22 report)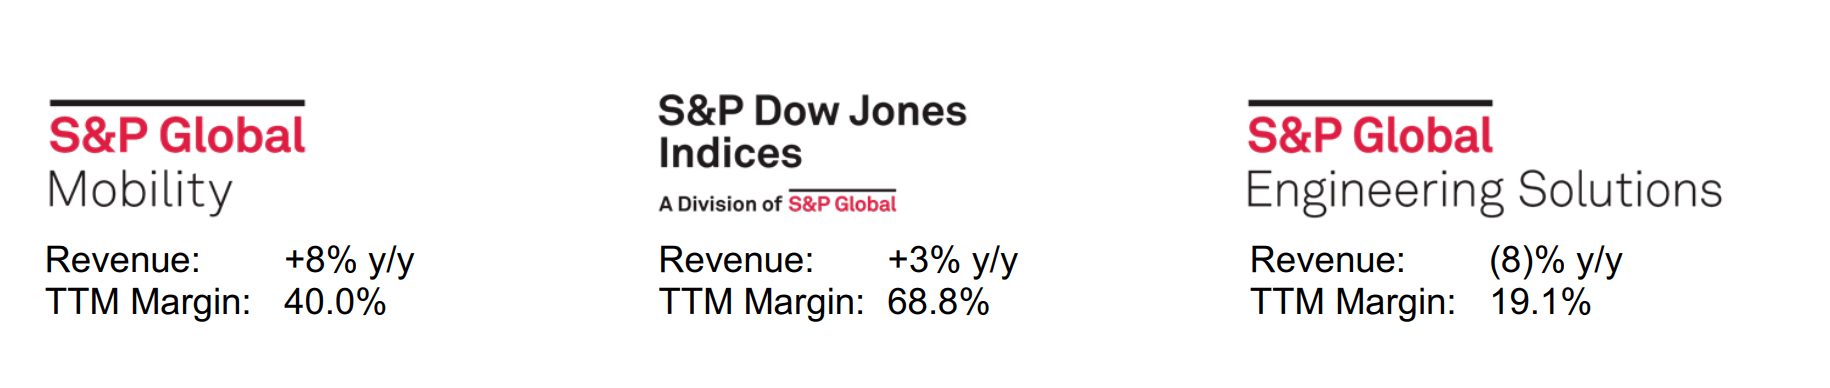
Its indices business also generated strong results which beat management expectations and were a surprise given the current stock market environment. Specifically, its exchange-traded derivatives increased non-GAAP revenue by a solid 40% year over year. In addition, its CDS indices increased non-GAAP revenue by 66% year over year. In the third quarter, a new S&P global customer (a Japanese asset manager), launched the first-ever cross-asset ETF in Japan. This was based upon the iBoxx Fixed Income and the S&P Dow Jones Equity Indices. “Cross asset” indices are a fairly new but growing industry and one S&P global cause tap into, given its strong market position.
S&P Indices (Q3,22 report)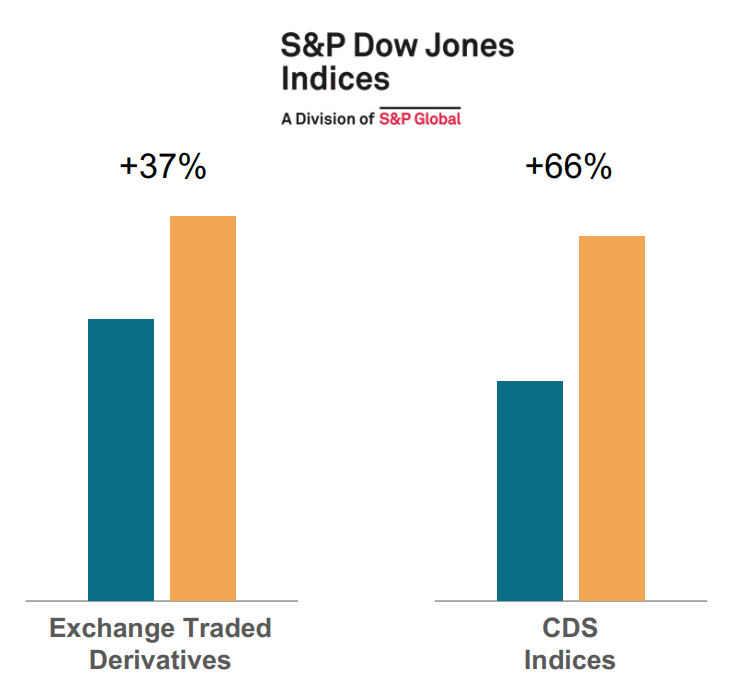
Its Engineering Solutions reported a poor quarter with an 8% revenue decline. This was driven by the mainly negative timing of a new Boiler Pressure Vessel Code (BPVC), which caused a 63% decline in non-subscription revenue. Given 94% of Engineering solutions revenue is recurring, I don’t imagine this decline will be a major issue long term.
Onto profitability, S&P global reported GAAP earnings per share of $1.82, which missed analyst estimates by $0.12 and declined by an eye watering 44% year over year. Its adjusted operating profit was slightly better with just a 12% decline reported to $1.3 billion. This was mainly driven by the aforementioned decline in Ratings segment revenue. As this is a high-margin part of the business (57.9% in TTM), the impact was substantial. A positive is I expect the Rating segment to rebound, with economic conditions and increased Issuance, as I discussed prior. S&P Global indicated that the global issuance market was down approximately 19% year over year in 2022, after a major 22% boom in 2020.
Issuance Market (Q3,22 report)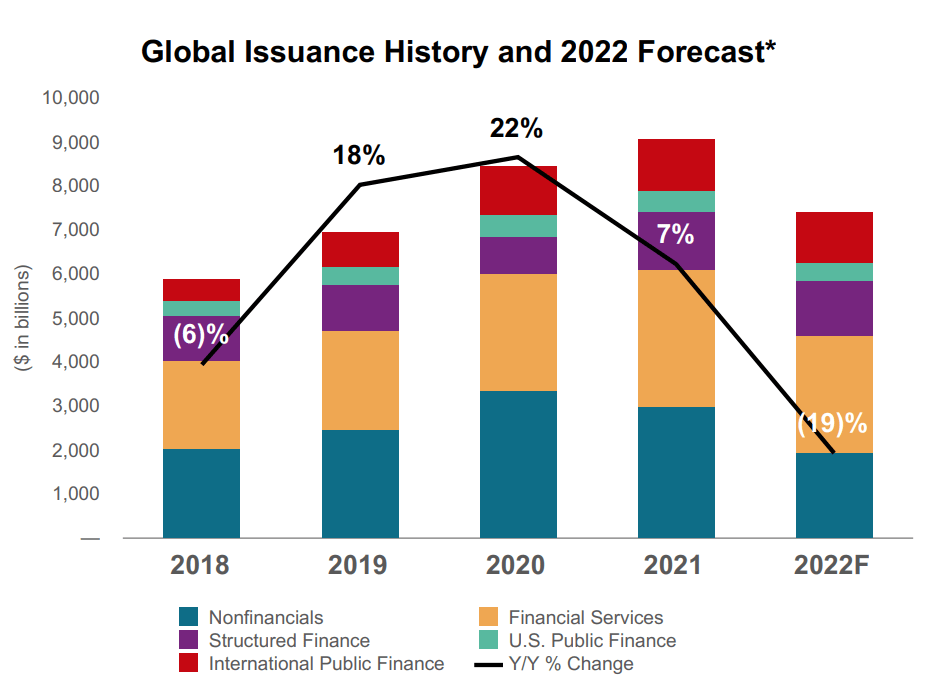
S&P Global has $1.387 billion in cash and short-term investments on its balance sheet. The company does have fairly high debt of $11.5 billion but the vast majority ($10.7 billion) is long-term debt.
In its third-quarter earnings call, management stated:
“We’ll not be discussing our expectations for 2023 on this call, but we will be closely monitoring both the internal and external indicators of our business over the coming months”
This is understandable but not really helpful when it comes to valuing the company, therefore I will use my own forecasts in the next section.
Advanced Valuation
In order to value S&P Global, I have plugged its latest financials into my discounted cash flow valuation model. I have forecast 5% revenue growth for next year, which is fairly optimistic given the forecasted recession in 2023 and prior growth rate of negative 8% year over year. In years 2 to 5, I have forecast 10% revenue growth per year which is based upon the high end of its historic growth rates which range between 3% and 11% since 2012. I expect this growth to be driven by improved economic conditions along which should result in an improving issuance industry and thus an improvement in its Global Ratings.
S&P Global stock valuation 1 (created by author Deep Tech Insights)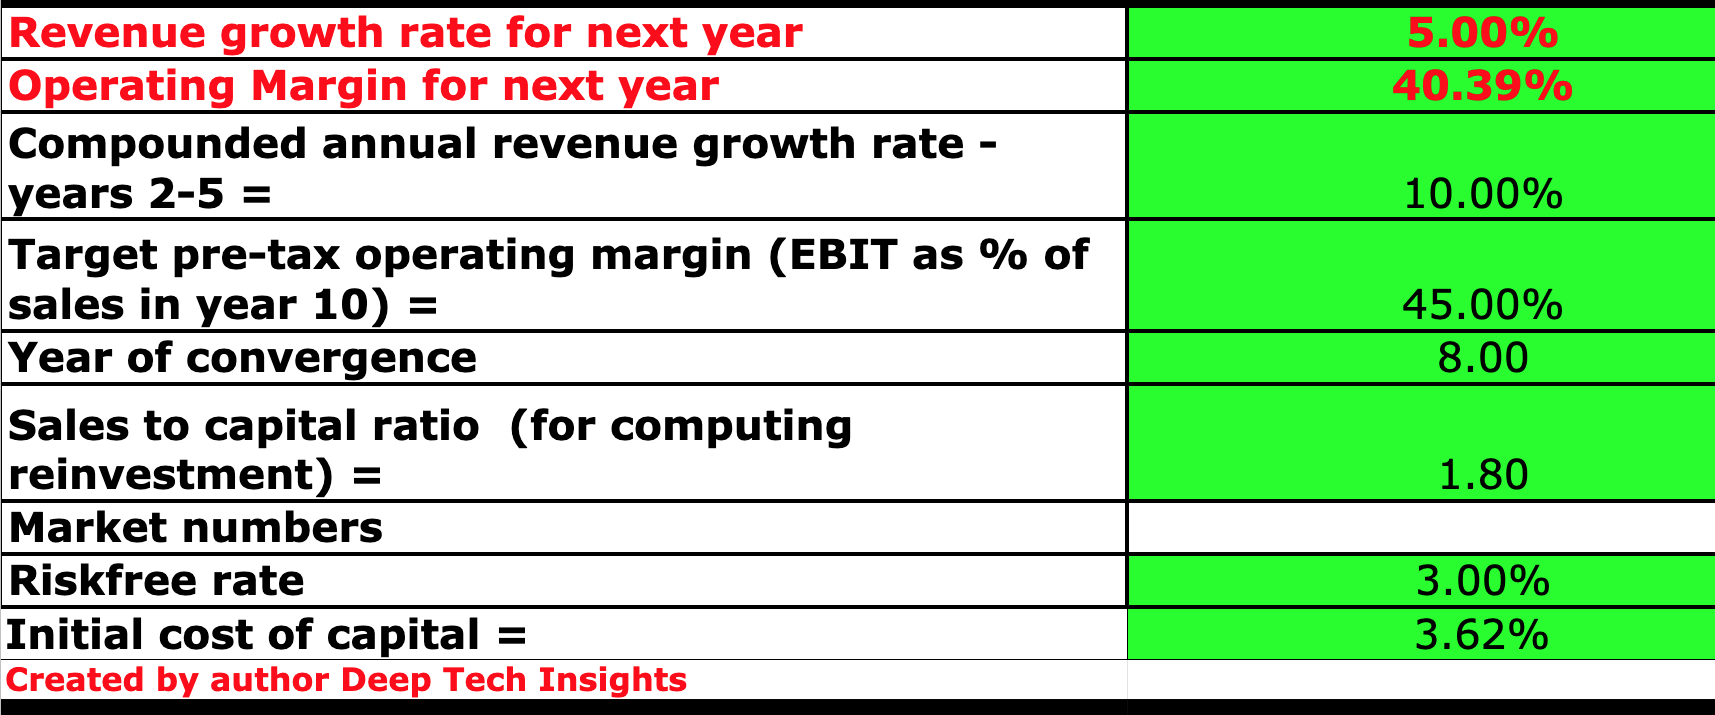
In addition, I have forecast an increase in its already high operating margin from 40.39% to 45%. I expect this to again be driven by a rebound in its rating segment, which is the second-highest margin part of the business. I also forecast continued cross-selling between its Market Intelligence and Commodity products.
S&P Global stock valuation 2 (created by author Deep Tech Insights)
Given these factors I get a fair value of $319.62 per share, the stock is trading at $354 per share and it thus is ~10% overvalued. This is expected for a company of such high quality, with an established customer base and barriers to entry. As mentioned in the business model segment, the company is one of the three major credit rating providers.
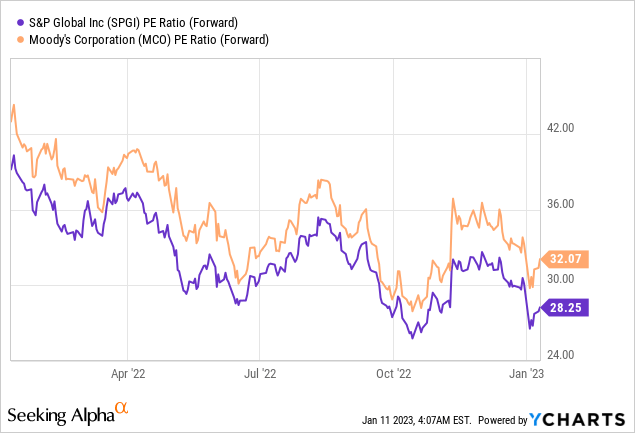
As an extra data point, the stock trades at a P/E ratio = 30.2, which is 5% cheaper than its 5-year average. In addition, it is trading at a fair value relative to its historic price to sales ratio = 10. A positive is S&P Global trades at a slightly cheaper valuation than credit rating agency rival Moody’s, which trades at a PE ratio = 28.25.
Risks
Recession/Market Volatility
Many analysts have forecast a recession in 2022, and thus this is expected to continually impact the ratings segment of S&P Global. Although as mentioned prior, economic conditions tend to be cyclical.
Final Thoughts
S&P Global is a leading market data provider and credit rating agency. The company is facing headwinds from tough economic conditions currently, but I believe this is only a short term issue. S&P Global has a strong, high quality customer base serving the majority of the Fortune 500. In addition, the majority of its revenue (84%) is recurring, which is great for consistency. The only issue with S&P Global is its valuation is fairly high, according to my intrinsic valuation model. This is expected due to the quality of the company but given the number of market opportunities, I will label this stock as a “hold” for now and one for the watch list.
Be the first to comment