

Khanchit Khirisutchalual
By George Valantasis
High dividend-yielding stocks have been prevalent in 2022, as rising interest rates have put downward pressure on long duration assets. At the same time, market participants are increasingly seeking to align investments with their personal and societal values.
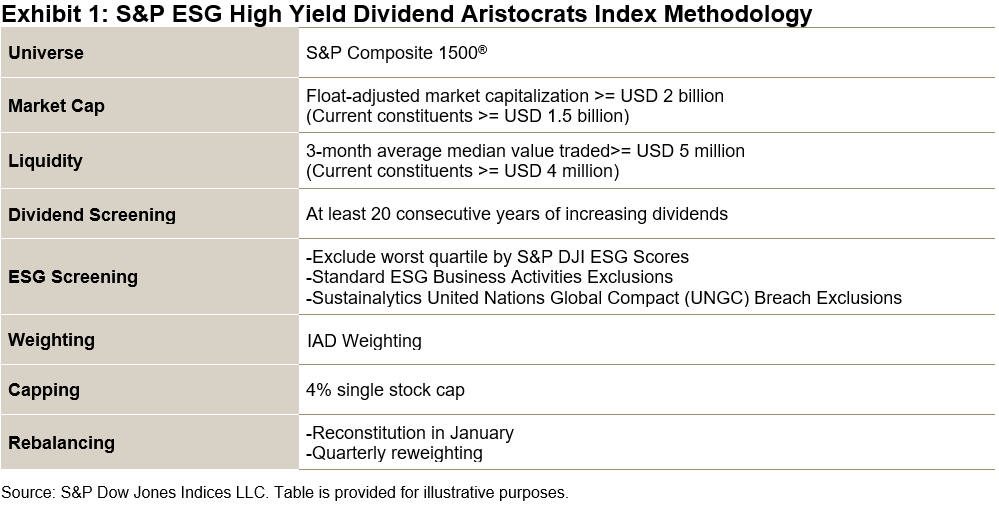
The S&P ESG High Yield Dividend Aristocrats® Index may be a strategy that checks both of these boxes. Launched in March 2021, this index strives to achieve low tracking error and comparable dividend yield to the S&P High Yield Dividend Aristocrats Index while incorporating meaningful ESG improvement.
Combining Dividend Aristocrats and ESG Methodology
The S&P ESG High Yield Dividend Aristocrats Index combines the S&P Dividend Aristocrats methodology with a sustainability overlay. To qualify for the index, a company must first have consistently increased dividends every year for at least 20 years.
This initial filter tilts the index toward selecting higher-quality companies, since the ability to consistently grow dividends over a long period of time can be an indication of financial strength, discipline and durable earnings power.
Next, multiple ESG screens are applied. The index excludes companies in the lowest quartile of S&P DJI ESG Scores. Additional ESG exclusion reviews are conducted quarterly based on business activities, as well as United Nations Global Compact (UNGC) breaches. These ESG screens serve to enhance the already stringent qualifications of the Dividend Aristocrats methodology.
Performance
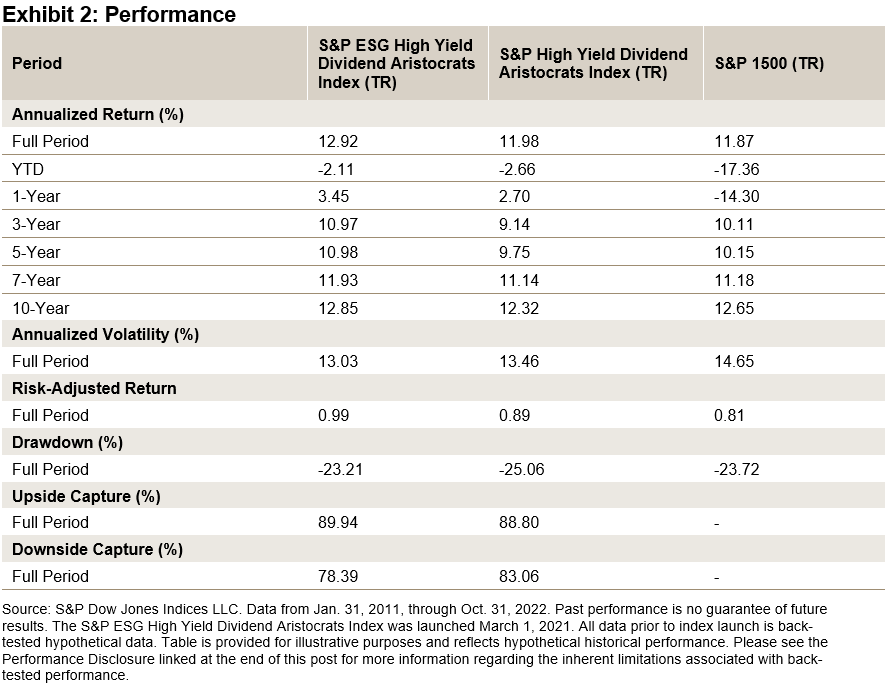
Since January 2011, the S&P ESG High Yield Dividend Aristocrats Index has generated a 12.92% annualized return versus 11.87% for the S&P 1500TM, while exhibiting less volatility.
Recently, the outperformance of the S&P ESG High Yield Dividend Aristocrats Index versus the S&P 1500 has been even more pronounced. Year-to-date, the S&P ESG High Yield Dividend Aristocrats Index has outperformed the benchmark by 15.25%.
One reason for this is that high-yielding indices, mainly through their lower durations, offered greater protection against rapidly rising interest rates compared to the benchmark.
Comparison of S&P DJI ESG Scores and Dividend Yields
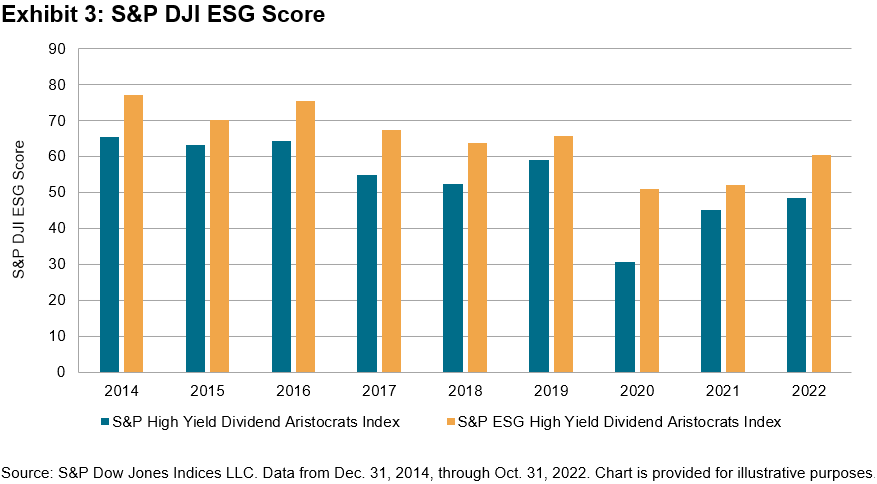
Exhibit 3 shows that the S&P ESG High Yield Dividend Aristocrats Index offered notable S&P DJI ESG Score improvement over the S&P High Yield Dividend Aristocrats Index. The S&P DJI ESG Score improved by 11 points per year on average, revealing an annual increase of over 20%.
The S&P ESG High Yield Dividend Aristocrats Index and S&P High Yield Dividend Aristocrats Index have had comparable yields historically, and both have held a significant yield advantage over the S&P 1500 (see Exhibit 4).
Over the period examined, the average annual dividend yields for the S&P ESG High Yield Dividend Aristocrats Index, S&P High Yield Dividend Aristocrats Index and S&P 1500 were 2.73%, 2.88% and 1.84%, respectively.
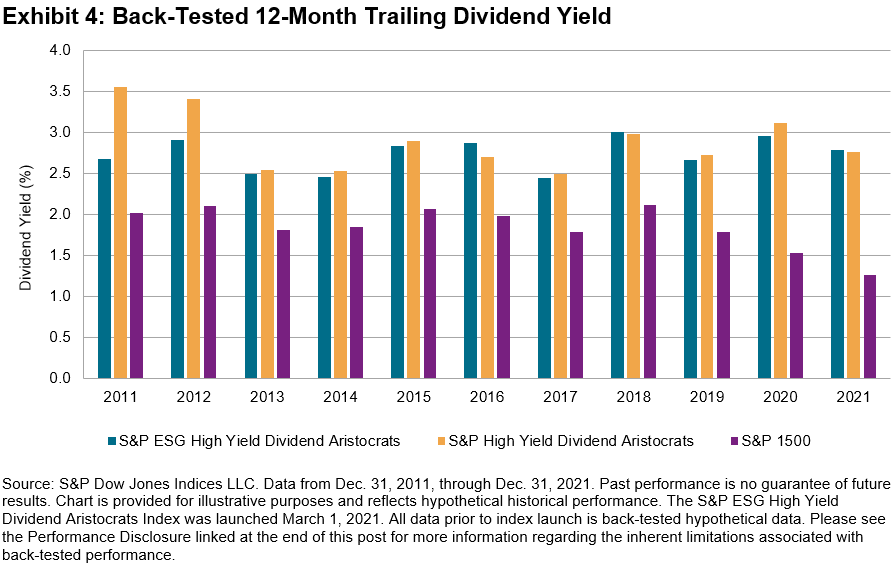
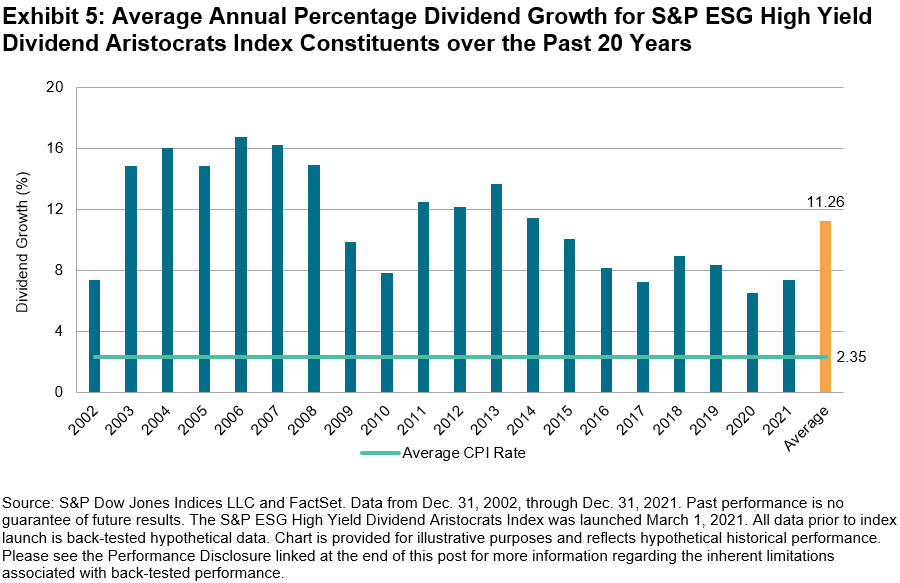
Exhibit 5 shows the average year-over-year annual percentage dividend growth rate for current S&P ESG High Yield Dividend Aristocrats Index constituents.
The average year-over-year dividend growth rate over the past 20 years was 11.26%, far surpassing the average year-over-year U.S. CPI rate of 2.35% over the same period.
Conclusion
For market participants who are looking for high-quality companies that align with their personal values, as well as a history of stable and attractive dividend payments, the S&P ESG High Yield Dividend Aristocrats Index may be an option to consider.
Disclosure: Copyright © 2022 S&P Dow Jones Indices LLC, a division of S&P Global. All rights reserved. This material is reproduced with the prior written consent of S&P DJI. For more information on S&P DJI please visit www.spdji.com. For full terms of use and disclosures please visit www.spdji.com/terms-of-use.
Editor’s Note: The summary bullets for this article were chosen by Seeking Alpha editors.
Be the first to comment