

Mongkol Onnuan
The top 4 names in the S&P 500 report their calendar Q3 ’22 earnings this week, although for Apple (AAPL) it’s their fiscal Q4 ’22. These four names comprise about 20% of the S&P 500’s market cap as of the close of trading last night, Thursday, October 20, ’22.
This blog will be out with a preview of all 4 names – probably on Sunday – but here’s the weekly update for S&P 500 EPS numbers, sourced from IBES data by Refinitiv. (Meta (META) reports this week too, although it’s market cap rank has fallen to 15th in the S&P 500 as of last night.)
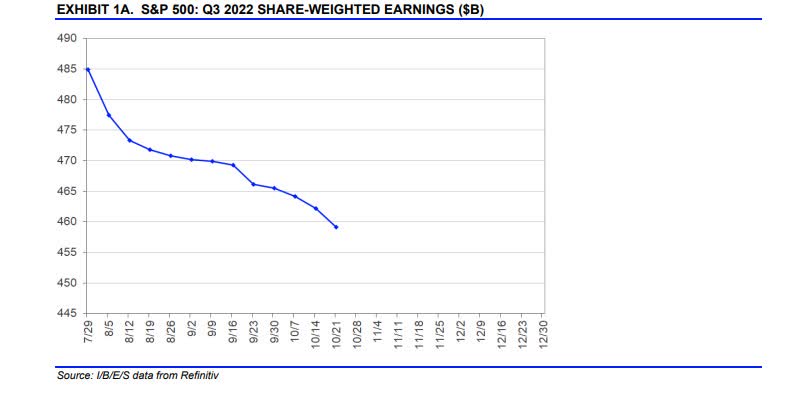
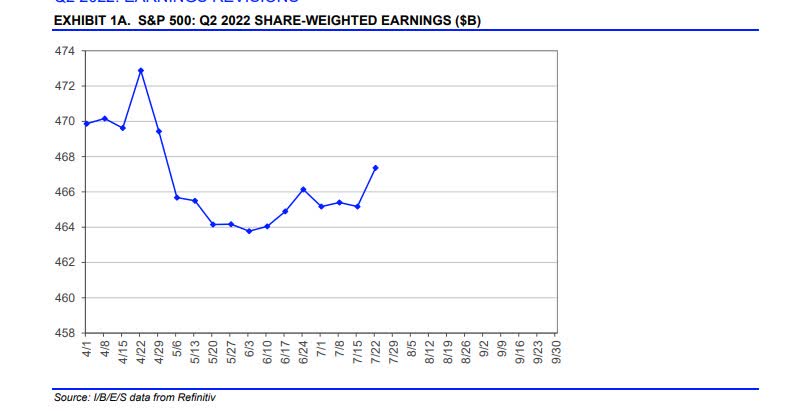
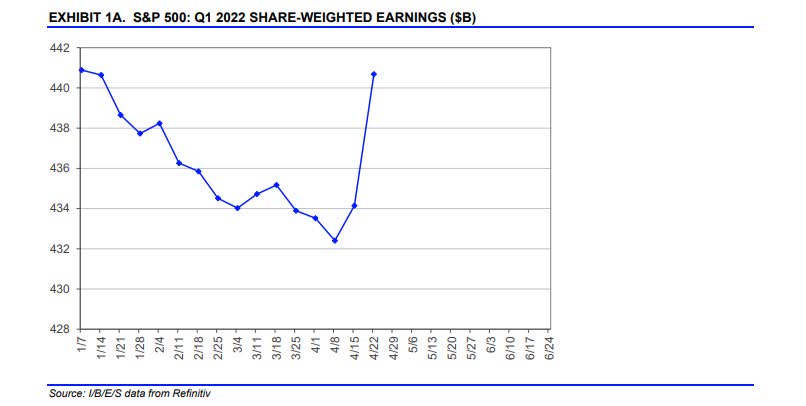
These three graphs should be interesting to readers since it’s the S&P 500 “net income” and not EPS which leads me to think the Refinitiv title is a little misleading to readers. While it’s horrible nit-picking, “earnings per share” is not net income, although “earnings” is net income.
- The bottom graph is the trend in quarterly net income for Q1 ’22 earnings, as of 4/22/22.
- The middle graph is the trend in quarterly net income for Q2 ’22 earnings, as of 7/22/22.
- The top graph is the trend in quarterly net income for Q3 ’22 earnings as of 10/24/22.
The point being – excluding the impact of fully diluted shares outstanding – readers can see the noticeable slowing in earnings or net income graphically as 2022 has progressed.
As my old boss used to ask, “What’s the point?”
The point is we see a whole lot of net income or earnings this week with Apple, Amazon (AMZN), Microsoft (MSFT) and Alphabet (GOOG) (GOOGL), not to mention Meta reporting their Q3 ’22 calendar results.
Here’s the list of report dates this coming week:
- Tuesday, 10/25: Alphabet and Microsoft (AMC)
- Wednesday, 10/26: Meta (AMC)
- Thursday, 10/27: Apple and Amazon (AMC)
AMC – after market close
S&P 500 data:
- The forward 4-quarter estimate slid sequentially again this week to $232.61 from the prior week’s $233.02. The forward 4-quarter estimate (FFQE) has now only increased sequentially 3 times in the last 17 weeks.
- The PE ratio is now 16x vs 15.4x last week thanks to the 5% weekly gain for the S&P 500.
- The S&P 500 earnings yield fell to 6.2% this week from 6.5% last week.
The 10-year Treasury yield increased 20 basis points (bps) this week and 42 bps since 9/30/22 and yet the S&P 500 still has a slight gain in October, month-to-date.
That’s an interesting tell.
Rate of change update:
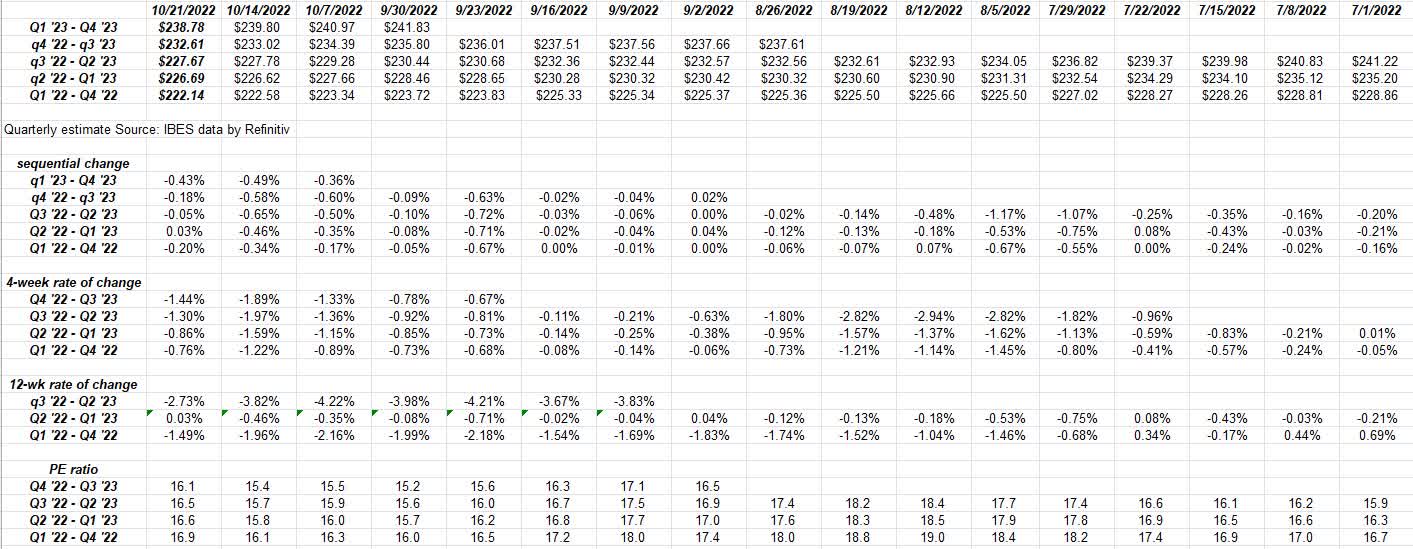
The interesting thing about this week is that all 3 “rates of change” buckets i.e. sequential, 4-week and 12-week improved this week versus last week, and the energy reports from Friday morning, 10/24, like Schlumberger (SLB) are not yet in the numbers.
Summary/conclusion: The interesting thing about this week’s trade wasn’t just the 5% pop in the S&P 500, but that the S&P 500 is rising in the face of a 20 bp increase in the 10-year Treasury yield and is still up month-to-date after a 42 bp increase in the 10-year Treasury yield. That’s a change in character and investors have to sit up and take note when relationships like that change.
Also, the S&P 500 closed at 3,674 the week of June 17th, 2022, when the S&P 500 printed that June ’22 low of 3,636 (various guests on CNBC keep saying 3,666, which is not right) and this week closed at 3,752.75. The 10-year Treasury yield spiked to 3.50% with the 3,636 low in mid-June ’22, and is now at 4.22% and yet the S&P 500 is flat.
The equity market is either predicting a turn in the inflation stats to reflect lower inflation or more downside is ahead for the S&P 500.
The fact that the S&P 500 looks like it’s been bottoming for 4 months should tell investors which way I’m leaning in terms of “higher” or “lower” stock prices.
Still, a lot depends on how these key earnings reports for what is 20% of the S&P 500 market cap in 5 names turns out. Meta fascinates me in the sense that it’s trading at 5x cash flow (ex balance sheet cash) and 8x free cash flow and yet is still the 15th largest name in the S&P 500 by market cap.
Some select clients have very small positions but it’s now entering “deep value” territory. Who’d have ever thought we’d be talking about Meta at a 2.7x book value valuation.
Has growth become too cheap? Has value become too expensive?
For Q3 ’22 earnings so far, the actual results are better than the poor sentiment we saw approaching earnings (again).
The plan is to write a lot more over the weekend but sometimes life gets in the way.
There is a definite preview of the big tech companies reporting this week coming Saturday or Sunday.
Take everything written here with a healthy dose of skepticism. Past performance is no guarantee of future results and none of this is recommendation to buy, sell or hold anything, although the goal is to give the reader some sense of how I’m approaching certain market themes, which readers are free to follow or not.
IBES data by Refinitiv is the primary data source for S&P 500 earnings while Briefing.com is the primary source of economic data and economic releases. Markets and opinions can change quickly for better or worse and this blog may not be updated.
Thanks for reading. More to come this weekend.
Editor’s Note: The summary bullets for this article were chosen by Seeking Alpha editors.
Be the first to comment