

cemagraphics
The S&P 500 (SPY) made its second-largest dip of the year this week and broke back through the 4101 area of support. Meanwhile, the US dollar and yields looked lively as the “higher for longer” scenario gained traction following the huge NFP beat. Is change in the air?
In an attempt to answer that, a variety of technical analysis techniques will be used to look at probable moves for the S&P 500 in the week ahead. Just like previous weeks, the market will be viewed in probable outcomes using inflection points – if it is going down, where is it likely to go? If it is going up, where is it likely to test?
The S&P 500 chart will be analyzed on monthly, weekly, and daily timeframes, then the information collated into an actionable summary at the end.
The Market Narrative
A number of Fed members made speeches this week but none really pushed back on the market’s expectation for rate cuts later this year. The disinflation message also remained the same. This is perhaps understandable as it is only a week since the FOMC meeting, and while the massive NFP beat may have made the Fed uncomfortable, making a U-turn after just one release was never a probable outcome.
Data was on the light side and the eventual break of 4101 support seemed more a factor of buyer exhaustion (pointed out last week) combined with continued reaction to the NFP rather than anything new. Traders will also be nervous about CPI next week, especially in light of a recent pickup in other economic data. One thing to note, however, was the BLS made some quiet upward revisions on Friday. The December CPI figures were upped from -0.1% to +0.1% and the previous quarterly figure was bumped 25bps. This makes it much easier for the month-on-month print to show disinflation and could ensure the report is received favorably.
S&P 500 Monthly
The February bar reversed from 4195 back to its opening price of 4070 and slightly below to this week’s low of 4064. Staying below 4070 would be bearish, but obviously, there is a long way to go until the monthly bar closes.
SPX Monthly (TradingView)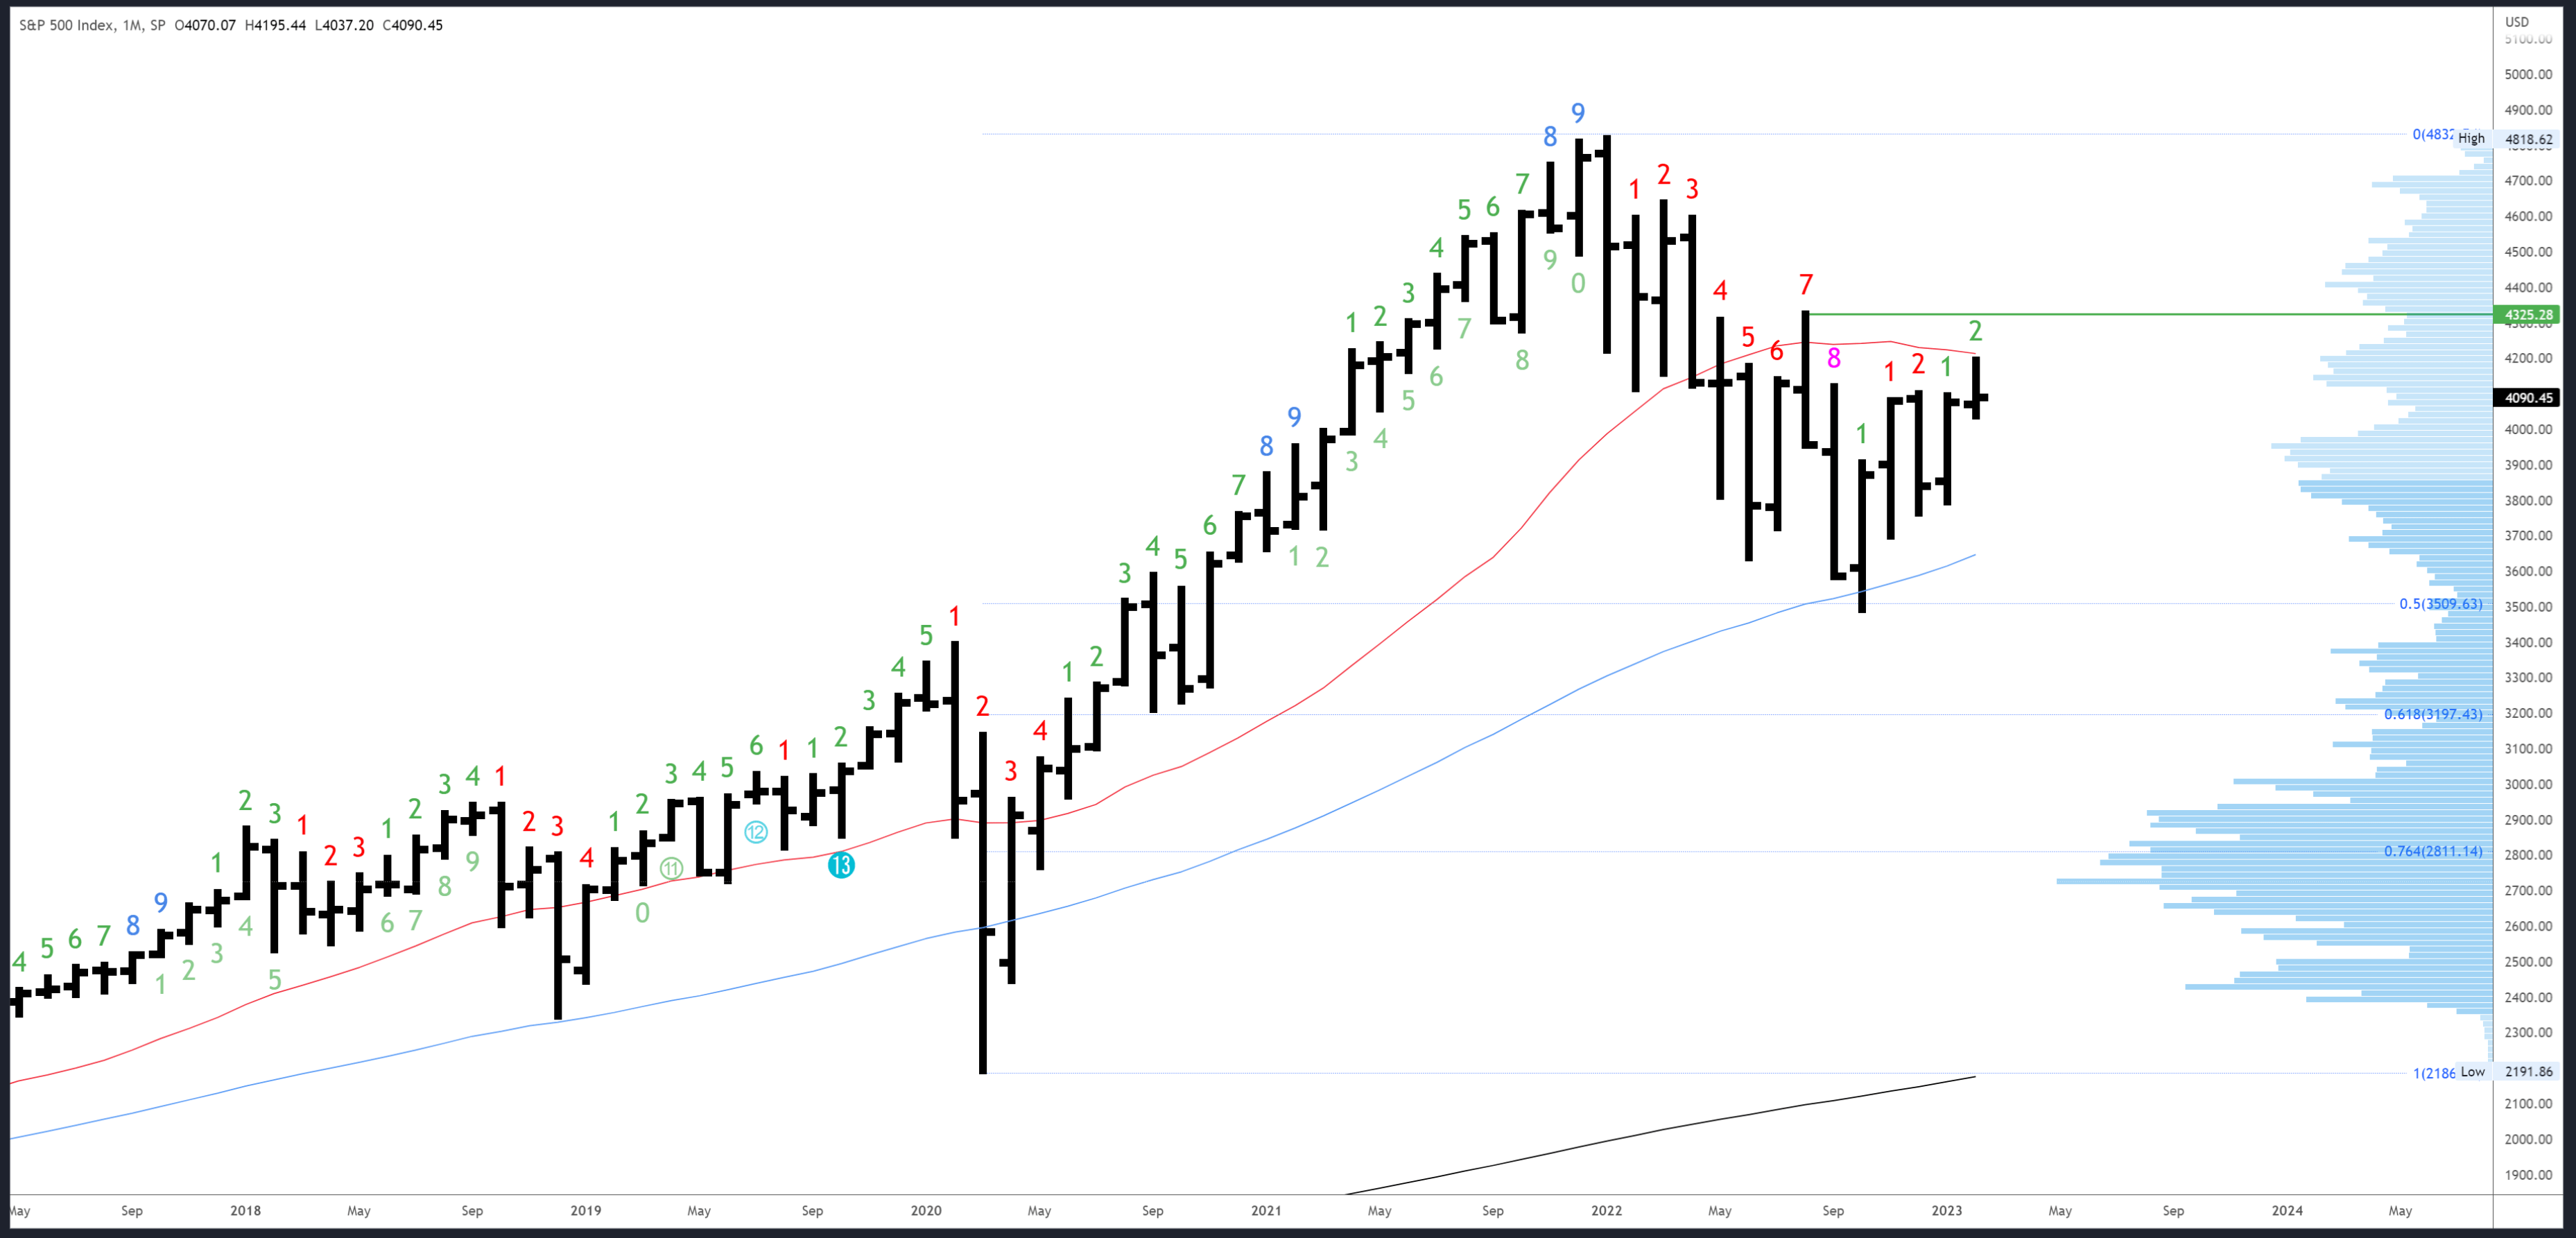
The 4195 high and the 20dma are initial resistance, followed by 4325 at the high of August. Minor support is at the February low of 4037, with the January lows a distant 3794.
There are no exhaustion signals in either direction (using Demark methods), although downside exhaustion was very nearly registered in October, so we can say this is being reset with the current rally.
S&P 500 Weekly
This week’s slower action led to an ‘inside bar’ with range contraction. It reflects indecision but usually leads to a break in the direction of the outer bar, i.e., up. Closing back under, 4101 was a negative but isn’t enough to flip the view bearish.
SPX Weekly (TradingView)
Resistance comes in at 4195-4203, with 4325 monthly resistance above that. Support is at 4015-20 at the 50ma and the previous week’s low.
There are no exhaustion signals in either direction.
S&P 500 Daily
The daily chart is working off the upside exhaustion signal (bar 9) from the 2nd February. 4101 held twice but then broke, which is a dent in the bullish view, but could easily be reclaimed again. So far, this is a standard dip in proportion to the mid-January pullback.
SPX Daily (TradingView)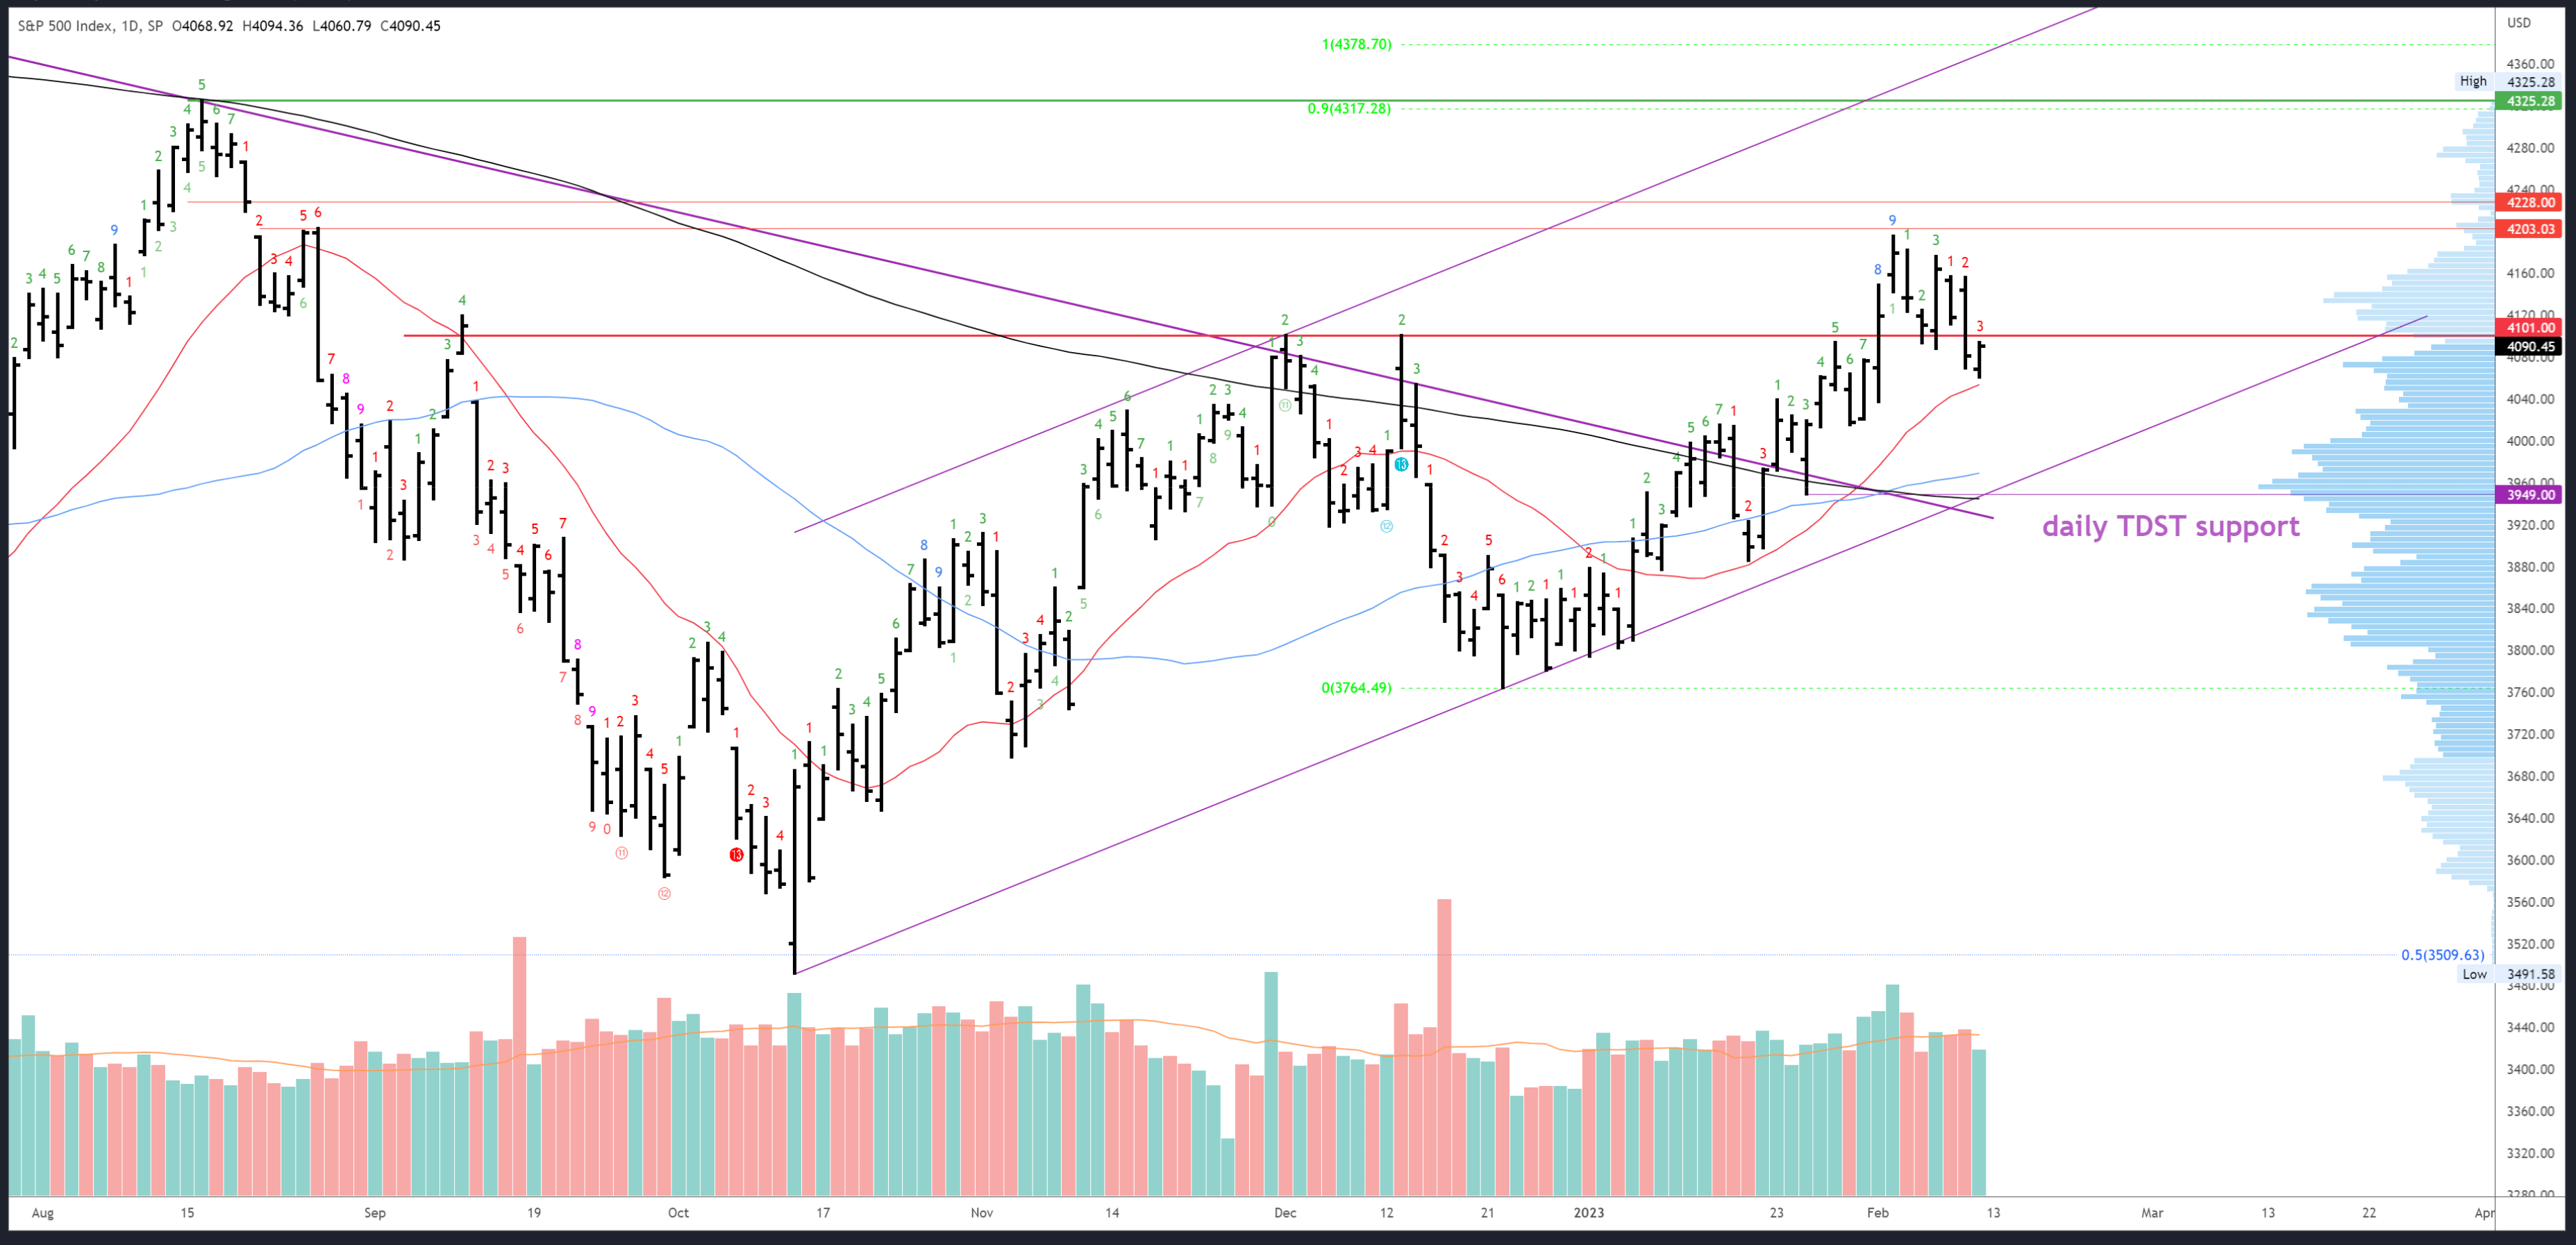
Immediate resistance is 4101, then 4195. The 20dma is rising and will add support to Friday’s 4060 low, with the 4037 pre-FOMC low/the low of February just below that.
There is a massive cluster of support around 3940-50 at the 200dma, the broken trendline and TDST support. Fittingly, this area has the highest volume of the entire 3491-4325 range and a bell curve is developing (shown by the volume profile to the right of the chart) with 3950 near its center.
As mentioned last week, an upside exhaustion count is complete. Monday’s session will be bar 4 (of 9) in a new downside exhaustion count.
Scenarios for Next Week
Bullish
The upside exhaustion has been worked off with this week’s dip, and the rally could be set for continuation. Recovering back over 4101 and closing strong (i.e., at the highs of the session) should lead to a test of 4195-4203. Closing over 4195 should then lead to 4325. Dips should ideally hold daily support of 4060 and failing that 4037.
Bearish
Bears need to defend 4101 and break the weekly inflection of 4015. A close at the lows of the week next week would flip the near-term outlook bearish for a test of the crucial 3940-50 area.
Conclusion
Next week could be complicated. CPI is released on Tuesday, retail sales on Wednesday and PPI on Thursday. Traders will be jittery ahead of CPI, but as mentioned earlier, the BLS adjustments could help the bulls. To simplify things, a close back over 4101 on Monday would keep the technicals positive for a run at 4195-4203.
Bears will be hoping for a hot CPI and good retail sales figures. This would reinforce “higher for longer” rate expectations and further the USD and yield reversals. A break of 4015 would target 3940-50 and potentially flip the chart back bearish.
Editor’s Note: This article covers one or more microcap stocks. Please be aware of the risks associated with these stocks.
Be the first to comment