

Diego Thomazini
The S&P 500 continues to hold 3,810 or the May 20th low, and hasn’t really re-tested the June 17th 3,636.87 low on the S&P 500.
That’s a good sign in terms of price action.
Ultimately, no one knows what the stock or bond markets will do, so technical analysis is a good way to “track the elephants” so to speak.
One of this blog’s favorite technicians is Gary Morrow (@garysmorrow), a long-time friend and excellent technician.
Gary sent me this SPX chart noting that the S&P 500 is now more oversold than 2008, which I thought was truly remarkable and fascinating.
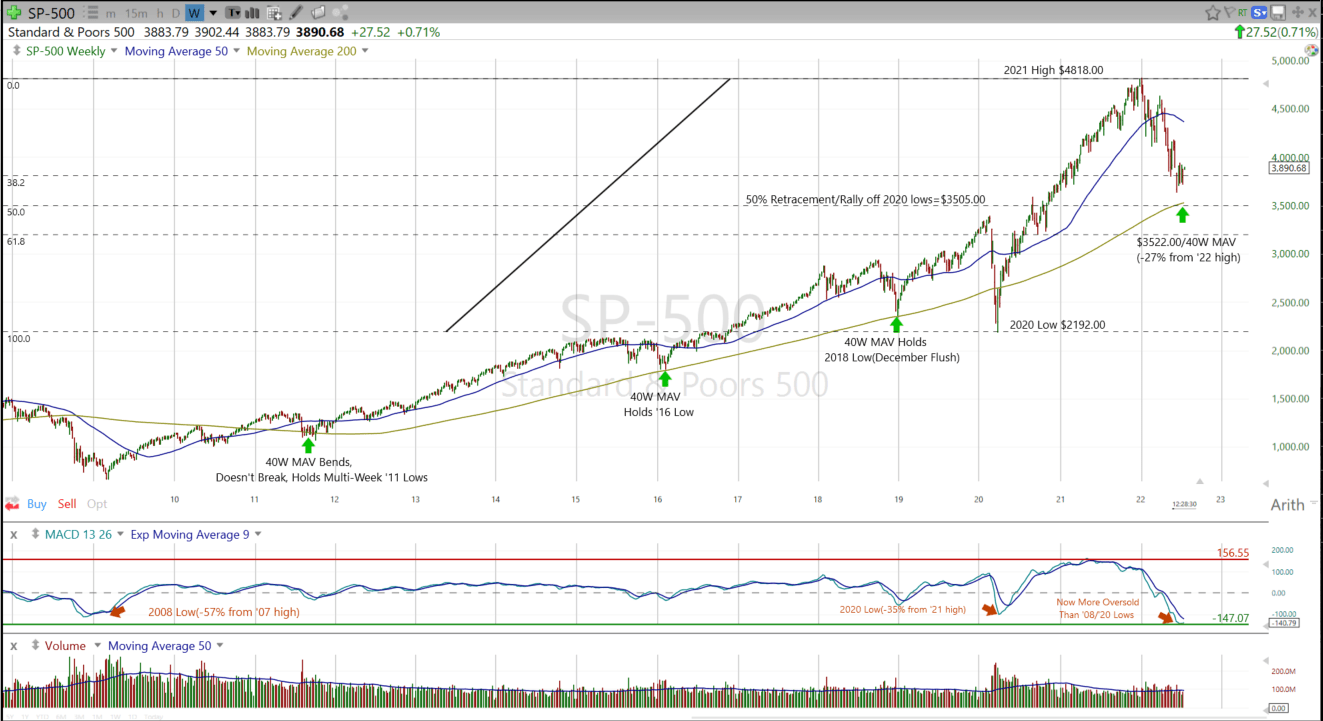
This was sent last Thursday, July 14, 2022.
It’s truly hard to believe anything’s as oversold as 2008. Remember, in January 2009, the S&P 500’s rolling 10-year return was low as the 1930s.
US dollar chart: (source: JC Parets)
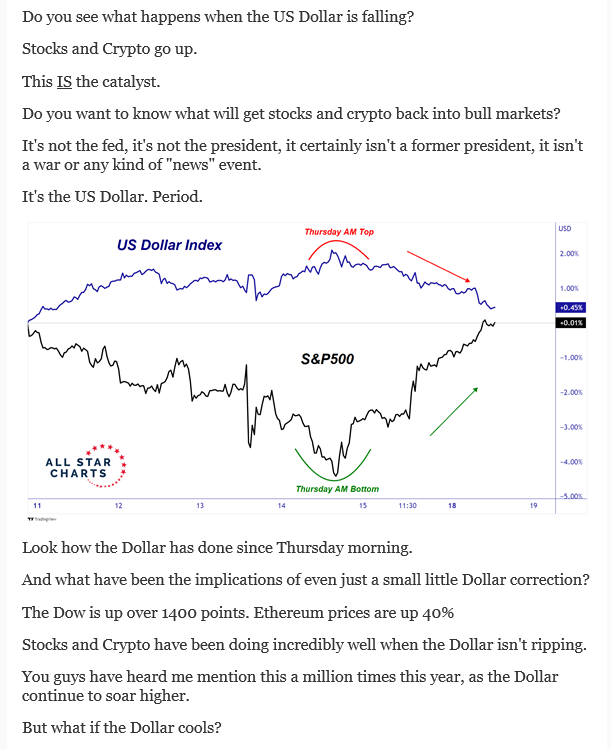
While, I don’t necessarily agree with JC Parets that there is that close or “causal” relationship with the greenback and the S&P 500, this chart of JC’s was interesting. He’s another good technician whose charts are always worth a look.
Last chart of S&P 500:
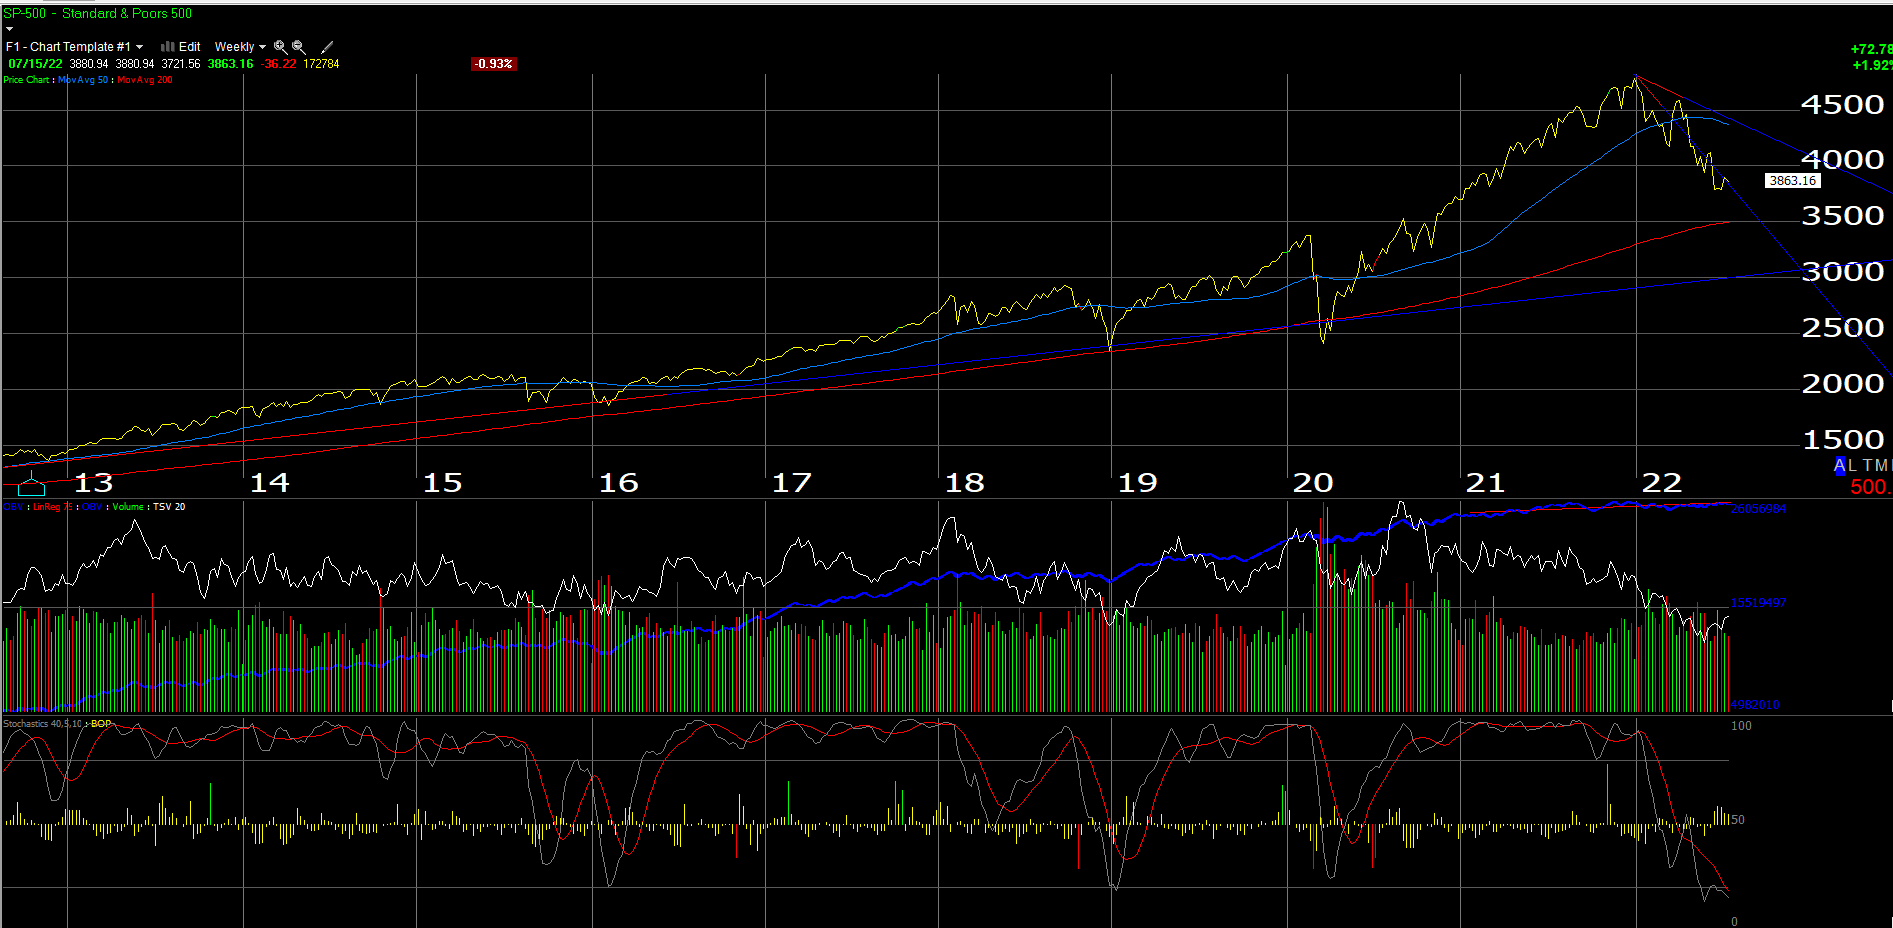
My own simplistic technical take, is that if 3,810 and 3,636.87 give way, the ultimate test for the S&P 500 would be 3,500 which as Gary Morrow notes, coincides perfectly with the 200-week moving average on the S&P 500.
Summary / conclusion: Many fundamental events can still transpire to throw a wrench into the first signs of a bottom for the S&P 500, but the fact is commodity prices including crude oil and gasoline, have declined substantially, the longer-end of the Treasury yield curve has begun reflecting lower inflation in forward years, and even growth i.e. technology stocks are in the initial stages of forming bases that could lead to higher prices.
However, be skeptical and manage portfolio risk. We could see a period over the next 3 – 4 months where the S&P 500 doesn’t make new lows, but trades sideways trying to discern how far the FOMC will need to push the fed funds rate higher to squelch the CPI.
I had a client ask about a “black swan” this weekend at a client meeting. Since 2008, the term “black swan” has entered the lexicon of sophisticated retail investors and my point to the client, obviously said respectfully, was that the fact that it’s brought up so much makes its likelihood remote.
Clients are being told, 3,500 on the S&P 500 would be a significant and important low, but we may not get there, and – for me anyway – the March ’22 lows at 4,157 and 4,161 will be important levels indicating that the bottom is in, and the S&P 500 will likely work higher.
The fact that the S&P 500 is now more oversold than 2008, is truly remarkable when high yield credit spreads were moving north of 20% and Fed Governors were worried that the entire financial system was at risk.
Watch for S&P 500 earnings reports that are bad on their face, EPS and revenue misses, with lackluster guidance, but price action is positive on good volume.
As good technicians teach all of us, ultimately only price matters.
Editor’s Note: The summary bullets for this article were chosen by Seeking Alpha editors.
Be the first to comment