

Iryna Drozd/iStock via Getty Images
The Bearish Thesis
Before discussing the tactical bullish thesis, it is first important to understand the bearish thesis.
Currently, the stock market is processing the following theme: 1) higher inflation/inflation expectations lead to 2) the expectations of a more aggressive monetary policy tightening, and 3) more aggressive monetary policy tightening increases the probability of a recession, which 4) increases the probability of a recessionary bear market.
The bears further assume that the “forthcoming or unfolding” bear market could be as deep as the 2008 stock market crash, with the 50%+ total drawdown. Thus, with the current drawdown of nearly 20%, S&P 500 (SP500) is not even halfway to reaching the bottom.
Specifically, last week on Friday, the May CPI report showed the that headline CPI inflation reading was at the 40-year high 8.6%, which was higher than estimated, and more importantly the highest reading during the current inflationary cycle – above 8.5% in March. Thus, the March “peak inflation” assumption was invalidated.
As a result, the expectations of monetary policy tightening significantly increased, based on the Federal Funds futures. The data from the GAV Report shows that the market now expects the Fed to hike to 3.20% in 2022, which is an increase from 2.80% from the previous week. This is equivalent to about 50bps hike in every meeting this year. Further, the market has boosted the expectations of monetary policy tightening by about 40bps across the curve, with the terminal rate now around 3.50%.
Global Academic View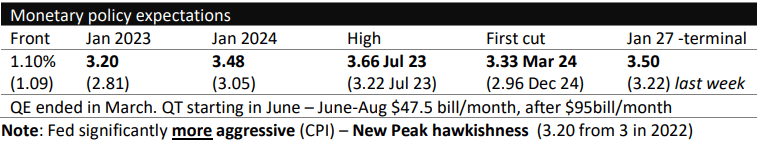
In response to the expectations of a more aggressive monetary policy tightening, S&P 500 dropped sharply on Thursday in anticipation of the “hot” CPI report, and on Friday in response to the “hot” CPI report – reaching the near low YTD level and the near 20% drawdown threshold. Here is the chart of the S&P 500 ETF (SPY):
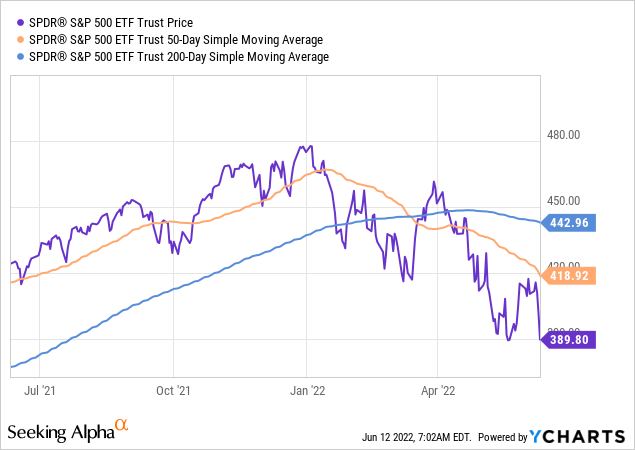
Thus, the key question is whether S&P 500 will exceed the 20% drawdown threshold, and officially enter the bear market, or the current support level will hold, and S&P 500 will bounce higher.
The Bullish Thesis
The bullish thesis is fairly simple – the market irrationally overreacted to the CPI report, and the Fed is not going to be nearly as aggressive as the market currently expects.
First, the obvious point: it’s true that the headline CPI report reached the new cycle high point, but the core CPI continues to drop from 6.5% in March, to 6.2% in April, and 6% in May. Thus, the peak in core CPI inflation is still in March.
But more importantly, the long term inflation expectations have barely moved last week, and are still well below the peak in March/April. The data from the GAV Report shows that the 10-Year Breakeven inflation expectations have only slightly increased last week to 2.79% from 2.76% the week before, which is well below the peak of 3.02% on April 21st. The 30-Year Breakeven inflation expectations actually decreased last week.
The nominal yields increased last week, but mostly due to the increase in real yields, and not the increase in inflation expectations. This is an important observation because it shows that the longer-term inflation expectations are currently anchored (within the normal historical range), and thus there is no need for the super-aggressive monetary policy tightening.
Global Academic View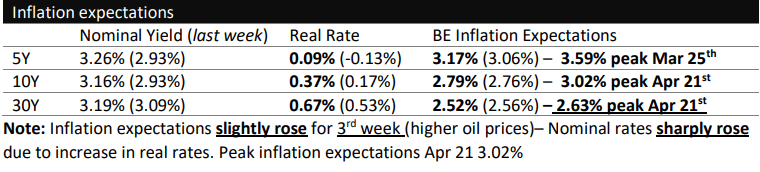
Here is the chart of 10Y Breakeven inflation expectations, which clearly shows that the current inflation expectations are well below the peak on April 21st – which I still define as the peak inflation point.
FRED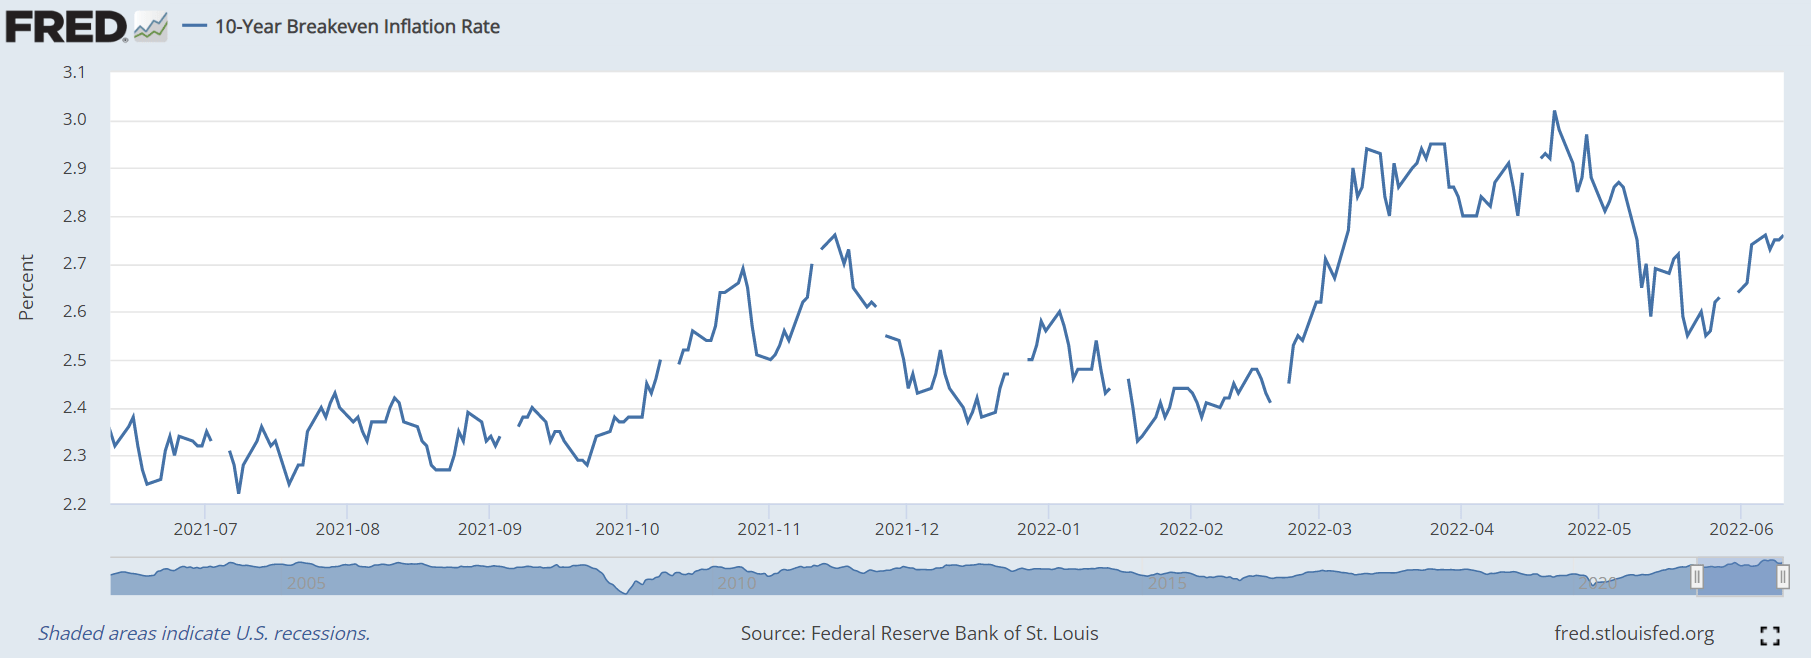
Thus, in my view, the market overreacted to the CPI report, possibly due to the lack of liquidity in short term bonds, which spread into the S&P 500 Futures (SPX), a process that in-fact the Fed warned us about in the recent Financial Stability Report.
As a result, I view the last week’s sell-off in the S&P 500 as the resurfaced liquidity shock. I expect that the expectations of the monetary policy tightening will be significantly reduced, more inline with the Fed’s “modest dovish turn” (or the possibility of the monetary policy tightening pause later this year) with the terminal rate falling back to the 3% level. Thus, S&P 500 is likely to bounce from the 20% drawdown threshold.
Longer term, the Fed’s current monetary policy tightening could cause a recession. However, given that the 10Y-3mo yield curve spread is still positive, the probability of an imminent recession is very low. Further, the recessionary bear market does not have to be very deep. For example, the 1991 recession produced a sub 20% total drawdown in S&P 500.
Very deep recessionary sell-offs, like the 2008 bear market, are triggered by the credit crunch, which I define as the Phase 3 of the selloff. In these situations, the credit spreads such as the BBB-rated bonds yield minus the 10Y Treasury Bond yield spike to above 3%, even above 4%. Last week, this credit spread actually decreased, and at the level of 2.07% it is very low, and well below the cycle high point of 2.38% on March 10th. Here is the BBB-10Y chart.
FRED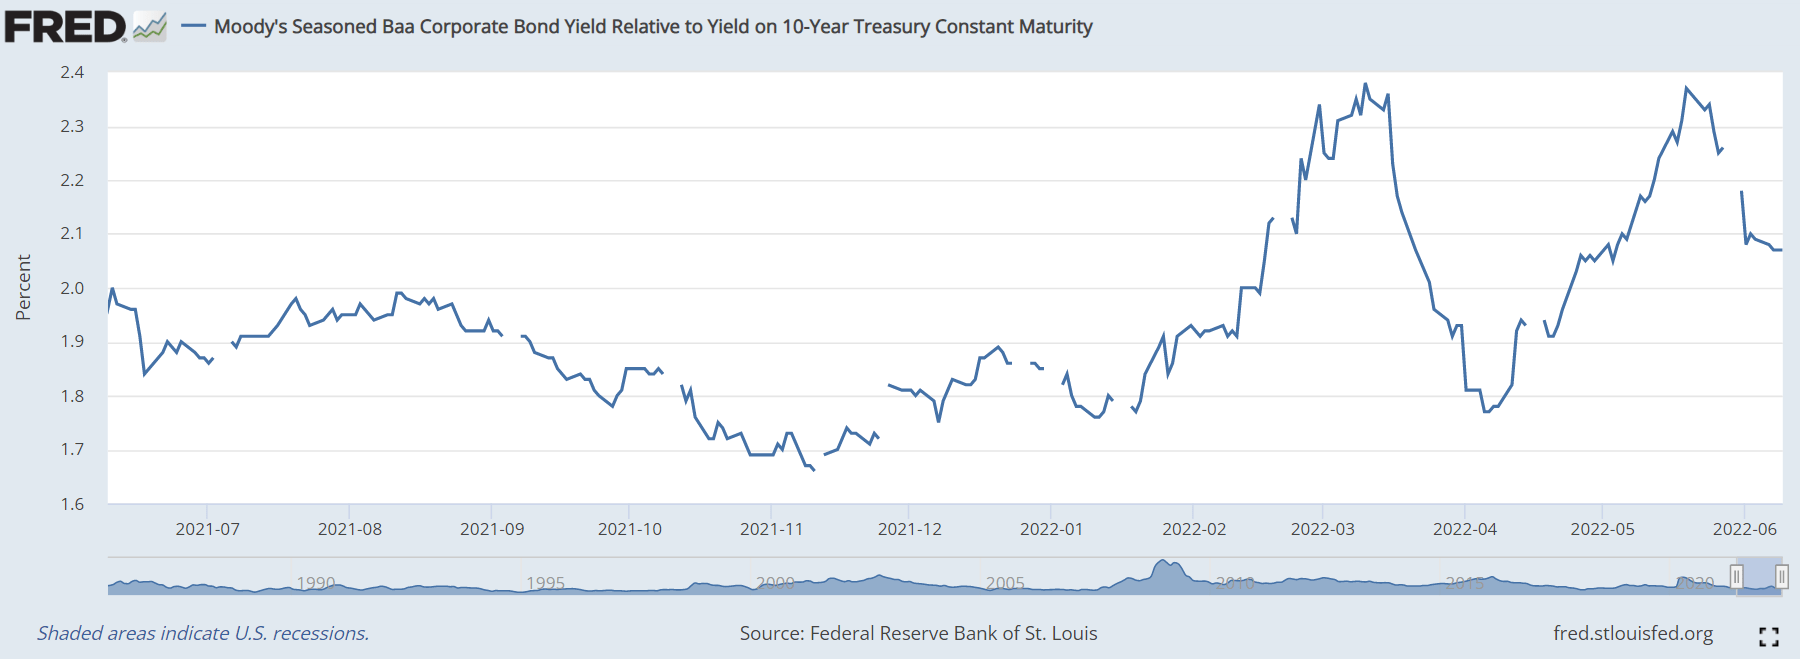
The Risk
The major risk to the tactical bullish position on S&P 500 is the exaggeration of the liquidity shock – something like the 1987 scenario. We already know that the liquidity is very thin, and the breach of the 20% drawdown level at around 3840 on (SP500) could cause significant selling as the stop-loss orders are triggered and the algorithmic short selling overwhelms the market depth.
The second risk is specifically related to S&P 500 ETF structure and the inherited sector-specific and the firm-specific risks. The high-beta speculative technology sector (XLK) is still heavily weighted at 25% of S&P 500, with another 20% coming from the combined tech-heavy communication sector (XLC) and consumer discretionary sector (XLV). Note, last week these sectors led the SPY down. Further, large speculative stocks like Tesla (TSLA) could cause the spread in volatility from the firm-specific risk to the entire Index. Even more fundamentally sound mega-cap firms such as Apple (AAPL) Microsoft (MSFT) and Amazon (AMZN) (which account for 16% of the Index) could drag the entire index down due to the firm-specific event – and cause the liquidity shock.
The third risk is related to the unexpected sharp spike in oil price (CL1:COM), which could boost the longer term inflation expectations to the new peak.
Given the significant risks and low liquidity, any tactical bullish position in SP500 should be small with the well-defined exit strategy. Longer-term investors should not allocate long term capital yet, given the macro environment.
Be the first to comment