

S&P 500, Gold, Oil Fund Flows Talking Points:
- S&P500-linked SPY ETF flows have been mixed amidst rise in yields.
- Gold-linked GLD ETF continues to see large outflows as gold price struggles.
- Volatility in WTI crude oil sees a continuation in outflows from oil ETF USO.
S&P 500, Gold, Oil Fund Flows as Virus Cases Rise
While vaccination efforts continue strongly in the US, health officials have begun to sound alarms over sharp rises in Covid cases in certain regions. In Europe, where vaccination efforts have not been nearly as effective, a resurgence in virus cases has already triggered new lockdowns and restrictions. While the Fed and ECB continue to keep their feet down on the monetary stimulus pedal, other central banks are beginning to reduce their support. The Bank of Canada recently began providing guidance on tapering. US yields also continue to remain elevated. All these factors have coalesced to threaten sentiment around risk assets.
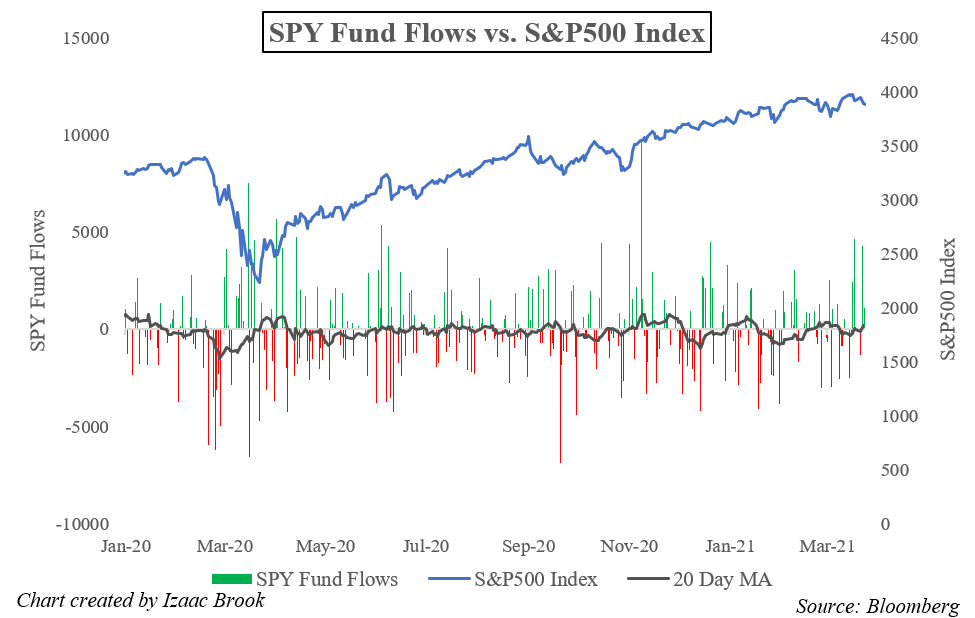
The S&P 500 hit a new all-time high in mid-March, just a few dozen points shy of the 4,000 level. Since then, the index has slipped slightly lower, currently trading around 3,850. While US 10yr Treasury yields have stepped back from their highs around the 1.75% level, they remain around 1.60%, above the S&P 500’s estimated dividend yield. Another move higher in rates could put further pressure on the index.
The SPY ETF, which tracks the S&P 500, has been mixed in the new year. Since January 1st, the ETF has seen around $3 billion in net outflows. In recent days, the ETF has seen its largest inflows in 2021. While the driver of these flows may be dip buying activity or the effect of retail investors pouring their stimulus checks into the stock market, the ETF may continue to struggle as the variety of macro themes play out.

Recommended by Izaac Brook
Get Your Free Gold Forecast
The rise in US Treasury yields and other benchmark interest rates have not been kind to Gold. The precious metal steadily slipped lower since early 2021, falling from above 1,950 to a low around 1,680 in early March, its lowest point since June of 2020. Gold has rebounded slightly from this low to consolidate around the 1,730 level, far below the levels it traded at throughout the second half of 2020.
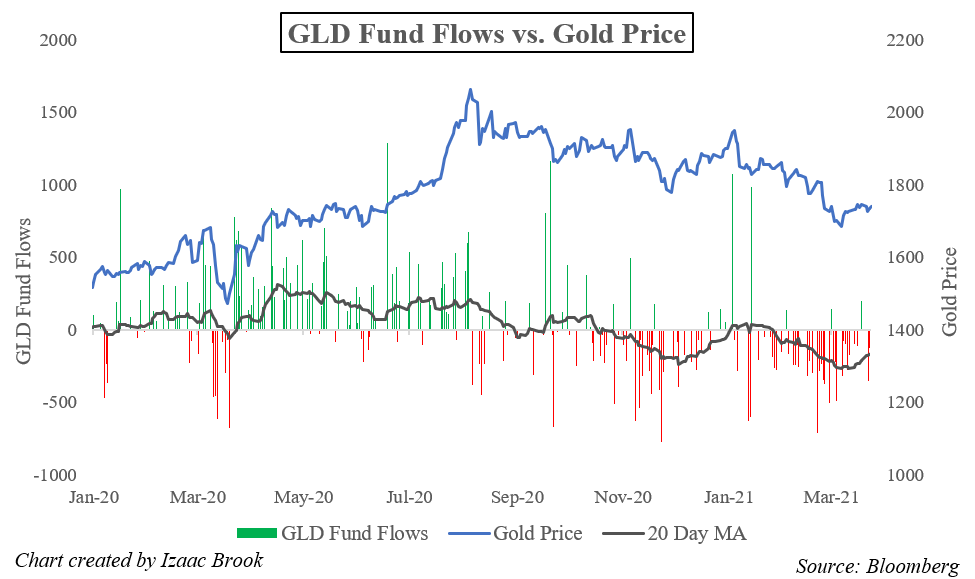
The Gold-linked GLD ETF has seen consistent large outflows since Gold hit its record high around the 2,000 level in early August. Once gold hit this record, investors began to take profits, driving the price back downward and driving the moving average of GLD ETF flows into negative territory.
Redemptions accelerated in November and December, and then again in February and March as the price of Gold broke below the 1,800 level. In total, the ETF has seen nearly $7 billion in outflows since the start of the new year. As the reflation trade continues to play out and real rates head higher, further upside for Gold may be limited.
Recommended by Izaac Brook
Get Your Free Oil Forecast
The resurgence in virus cases and related lockdowns in Europe has also threatened the rally in oil prices. WTI Crude Oil boomed in 2021, rising from 48.00 to a high around 68.00 in early March. Since then, the oil rally has struggled with the price facing considerable volatility. After consolidation through mid-March, oil prices dropped lower. In late March, prices have whipsawed around the 60.00 level as investors try to determine the near-term future of the commodity.
WTI Crude Oil – 45 Minute Price Chart (February 2021 – March 2021)

Chart created by Izaac Brook, Source: TradingView
Despite the strong rise in crude oil prices in early 2021, the WTI-linked USO ETF had already seen consistent outflows since the beginning of the year. The 20-day moving average of USO fund flows has remained in negative territory since October of 2021.

Outflows have continued as WTI prices retreat from their pandemic highs. Unlike in some other asset classes currently facing pressure, there seems to be little dip buying activity in oil-linked ETFs. In total, USO has seen nearly $1.3 billion in net outflows since January 1, with very few days of inflows – although the data can be less frequent than a larger ETF like SPY. As the global economic recovery is threatened by a resurgence in cases and dissapointing vaccination rollouts in much of the developed world, oil prices may face continued volatility.
Recommended by Izaac Brook
How to Trade FX with Your Stock Trading Strategy
— Written by Izaac Brook, DailyFX Research Intern
Be the first to comment