

hallojulie
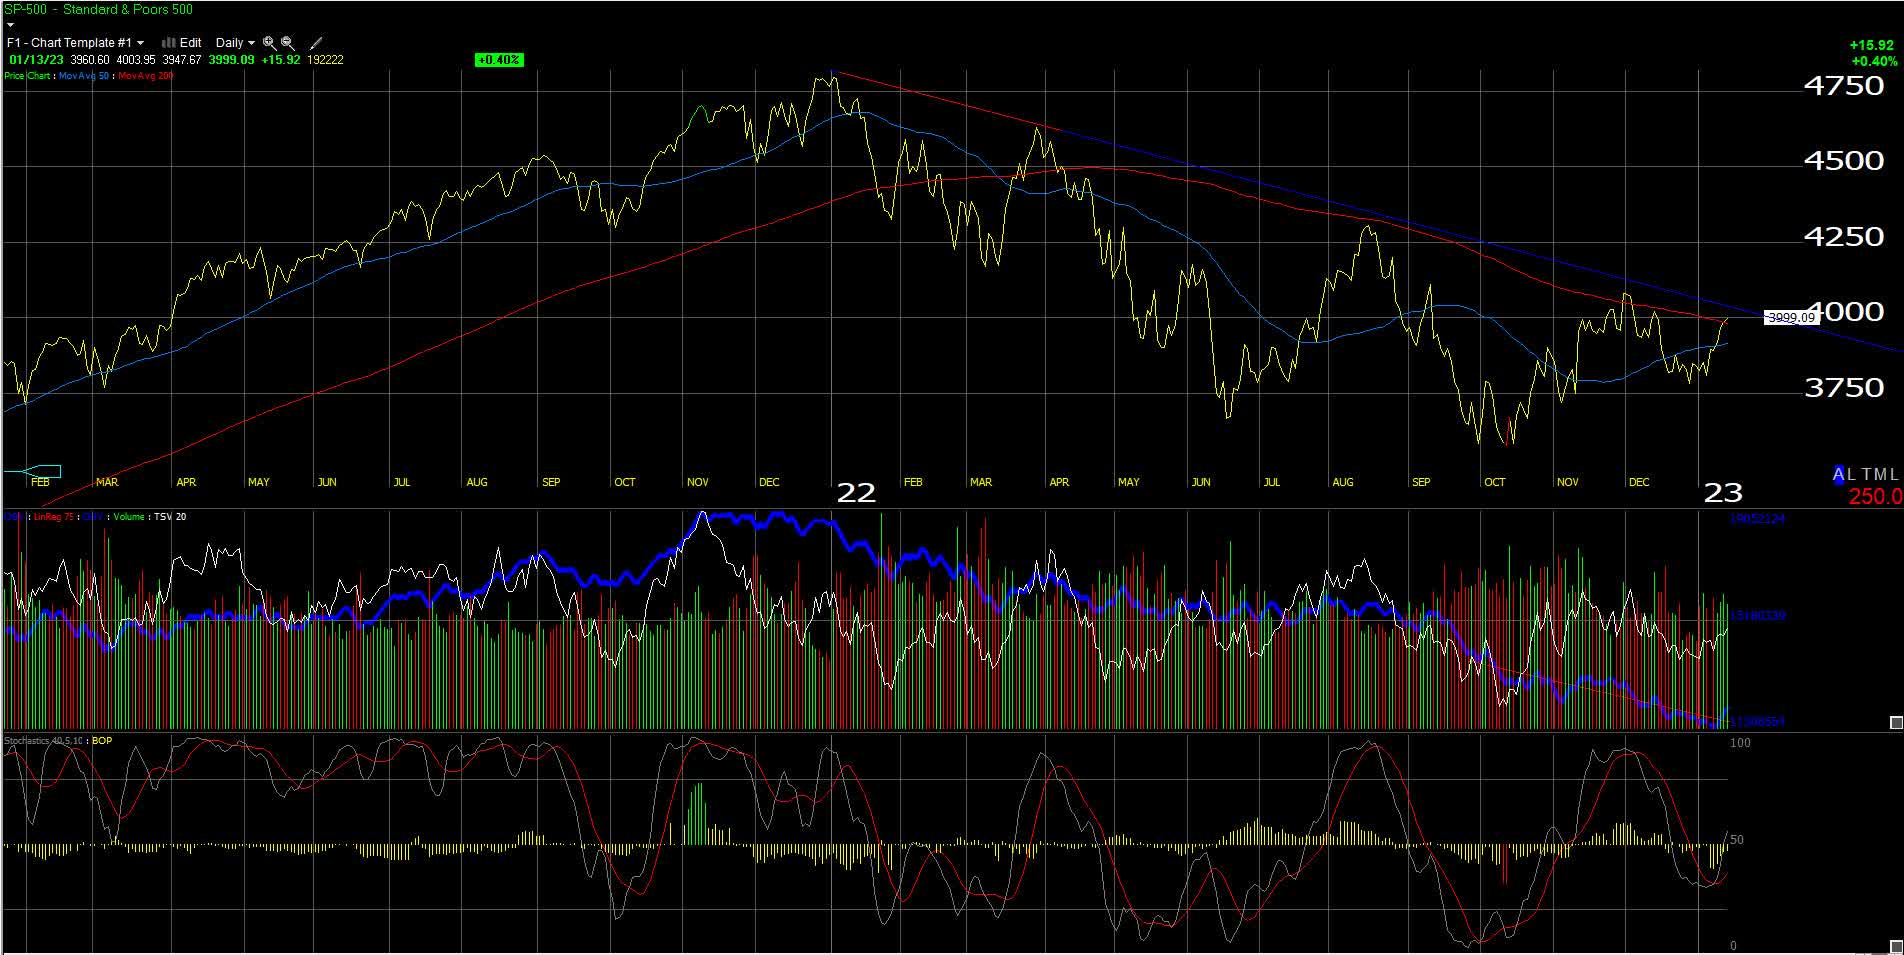
The above chart is the S&P 500 daily chart from Worden, and it shows the S&P 500 closing the week of January 13, 2023 above the 200-day moving average for the first time since late November-early December ’22. The key benchmark is also testing the downward-sloping trendline that started in January ’22 with the all-time-high in the S&P 500.
What’s really interesting from an S&P 500 earnings perspective is what’s happening with quarterly EPS and revenue estimates in the back half of 2023.
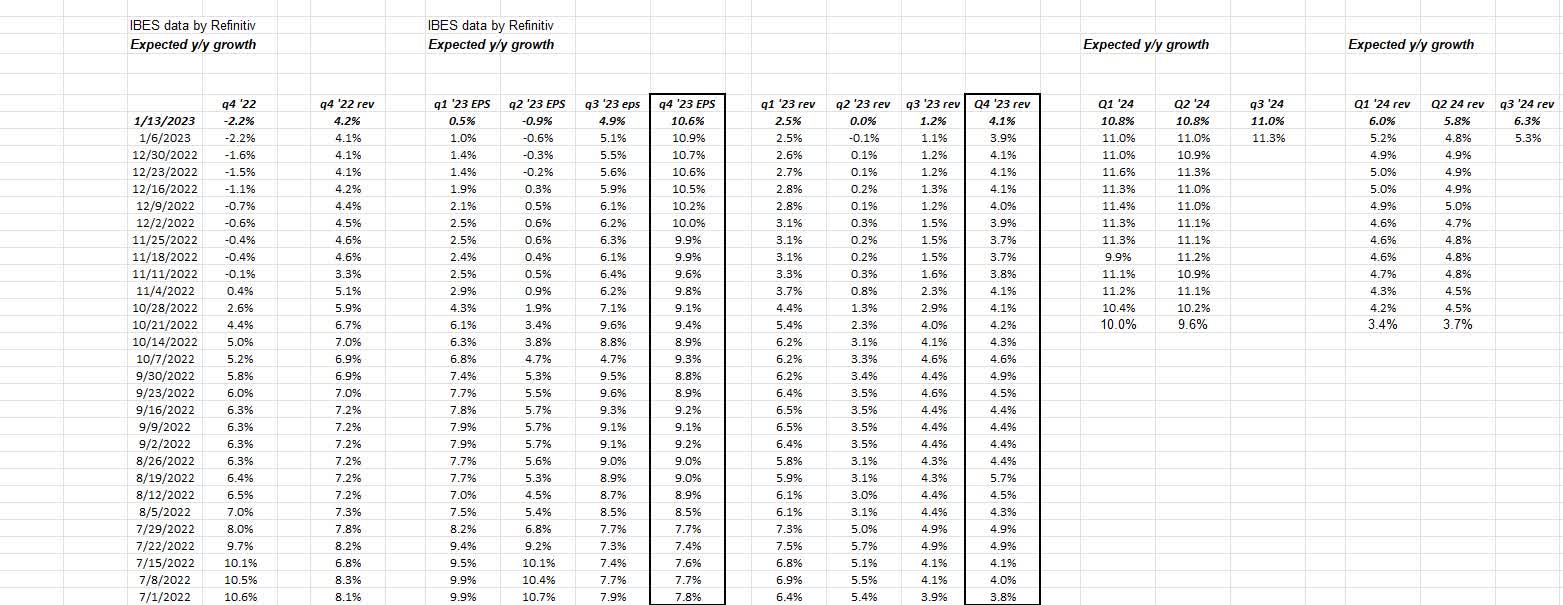
Note the persistent strength in Q4 ’23 “expected” S&P 500 EPS growth (dark border of 6th column).
While it will be more telling when 2023 guidance is heard and we see the changes to the numbers over the next two weeks, take this as an early tell that “consensus” is expecting the back half of 2023 to be stronger than than the first half of 2023. Note too how Q3 ’23 expected EPS growth are seeing far less severe revisions downward than the first two quarters of 2023.
Rate of change matters.
Looking at calendar year 2023 EPS estimates for the S&P 500, the Street was looking for 10% in early July ’22, but that growth estimate has been reduced to 5% as of this week.
The point is, we have dueling banjos, with the calendar year estimate for 2023 seeing negative revisions, but the back half of 2023 quarterly expected growth estimates are starting to firm up.
It’s to early to put any considerable weight on it, but just note the 2024 numbers too, on the far right side of the spreadsheet table.
Don’t bet the farm on it, but don’t ignore it.
(The source data for the above spreadsheet is IBES data by Refinitiv “Earnings Scorecard”, but the table is this blog’s.)
Rate of change
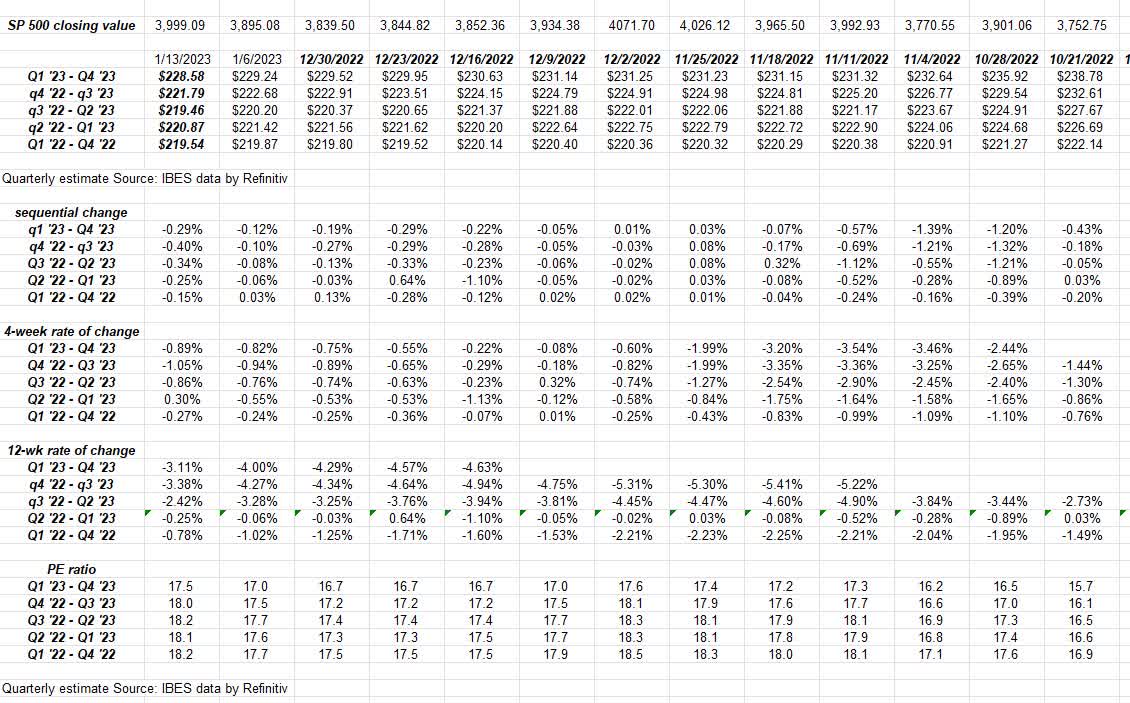
This spreadsheet takes the “forward EPS curve” for the S&P 500 and measures the various rates of change for forward S&P 500 EPS estimates.
The “12-week rate of change” is starting to moderate or slow in terms of negative revisions.
There are other ways I can verify this, but for now it’s another small positive and will really be driven or influenced by the large-cap tech and consumer discretionary and communication services names that report in two weeks.
S&P 500 data
- The forward 4-quarter estimate came in this week at $227.67, down from $228.38 last week and down from $230.43 as of 9/30/22;
- The P/E ratio on the forward estimate this week is 17.5x versus 15.5x as of 9/30/22;
- With the 2.5% rally in the S&P 500 this week, the S&P 500 “earnings yield” fell to 5.69% from last week’s 5.86% and the 6.43% on 9/30/22;
- The bottom-up estimate for Q4 ’23 is $53.50, which was as high as $60 this summer.
A fun fact for readers is that none of this data includes the bank earnings from Friday morning, January 13th, 2023. IBES data by Refinitiv is cut-off as of Thursday night every week. We don’t get to see what the impact was of the bank earnings on S&P 500 EPS and revenue and for the financial sector until Monday and Tuesday of this coming week.
Summary / Conclusion
The sentiment around Q4 ’22 earnings remains quite poor, and well, for 2023 it’s nothing but negative, but don’t ignore the data points, particularly for the S&P 500 EPS and revenue growth for the second half of 2023.
Large-cap tech is still facing tough comps against Q4 ’21 numbers, although the dollar weakening will start impact positively in Q1 and Q2 ’23. (Here is this blog’s post on the strong dollar’s influence on large-cap tech revenue, from the last week of December ’22.)
The +4.2% return for the S&P 500 for the first two weeks of 2023 along with the 3.2% positive return for the Barclay’s Aggregate puts the 60% / 40% balanced portfolio in positive numbers for 2023 already at +3.80%. Looking at the internal spreadsheet where this data is tracked, there wasn’t one week in 2022 where the 60% / 40% balanced portfolio had a positive return YTD. From January 1 ’22, it was straight downhill through 12/31/22.
Take all this with substantial skepticism, and note that past performance is no guarantee of future results. All data is sourced from IBES data by Refinitiv, but this blog takes the data and looks for patterns or trends that the rest of the Street doesn’t see or notice. Capital markets change quickly, for both good and bad.
The taking out of the downward-sloping trendline for the S&P 500 is probably one of the most important technical analysis trends today.
Keep an eye on it.
As always, thanks for reading.
Editor’s Note: The summary bullets for this article were chosen by Seeking Alpha editors.
Be the first to comment