


krblokhin/iStock Editorial via Getty Images
Earnings of SouthState Corporation (NASDAQ:SSB) will most probably increase this year on the back of slight margin expansion. Further, loan growth will remain positive this year even after a slowdown. Overall, I’m expecting SouthState Corporation to report earnings of $6.55 per share for 2022, down 2%, and $7.91 per share for 2023, up 21% year-over-year. The December 2023 target price suggests a high upside from the current market price. Therefore, I’m upgrading SouthState Corporation to a buy rating.
Margin Expansion to Continue, Albeit at a Slower Pace
SouthState Corporation’s margin surged by 43 basis points in the third quarter, up from a growth of 35 basis points in the second quarter of the year. The expansion was partly attributable to the deployment of excess cash into higher-yielding assets, including loans. Cash as a percentage of total assets was back to the pre-pandemic level at the end of September 2022, as shown below. Therefore, this factor will no longer propel the margin in upcoming quarters.
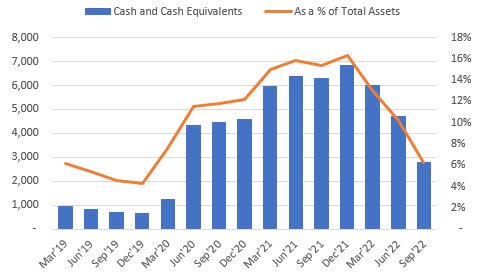
SEC Filings
Nevertheless, the margin will continue to expand as it is moderately sensitive to market interest rate changes. The results of the management’s rate sensitivity analysis given in the 10-Q filing showed that a 200-basis points hike in interest rates could boost the net interest income by 4.9% over twelve months.
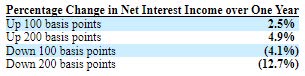
3Q 2022 10-Q Filing
I’m expecting the Federal Reserve to increase the Fed Funds rate by a further 50 to 75 basis points in the first half of 2023. Considering these factors, I’m expecting the margin to have grown by 10 basis points in the last quarter of 2022. Moreover, I’m expecting the margin to grow by 10 basis points in 2023.
Loan Growth to Return to the 2019 Level
SouthState Corporation’s loan growth continued to decelerate in the quarter that ended September 30, 2022. The portfolio grew by 13% annualized during the quarter, as opposed to 34% annualized in the first half of the year. A further slowdown is likely because of the impact of higher interest rates. SouthState Corporation’s residential loan segment, which makes up around 21% of total loans, is particularly vulnerable to rising rates.
Commercial loans are likely to fare better, as indicated by the persistently strong job markets. SouthState Corporation operates in several southeastern states, namely Florida, Alabama, Georgia, the Carolinas, and Virginia. Since the economies of these states are quite varied, it is best to consider the national average when trying to gauge credit demand. As shown below, the unemployment rate has remained near record lows throughout 2022.
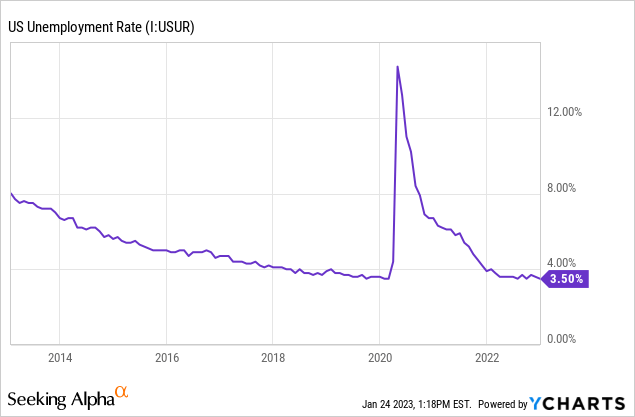
Due to the strong job markets, I don’t think the loan growth for 2023 will dip below the loan growth for 2018 and 2019. Overall, I’m expecting the portfolio to grow by 3% this year. Further, I’m expecting the loan portfolio to have grown by 0.75% in the last quarter of 2022, taking full-year loan growth to 22%. Moreover, I’m expecting the balance sheet items to grow somewhat in line with loans. The following table shows my balance sheet estimates.
| Financial Position | FY18 | FY19 | FY20 | FY21 | FY22E | FY22E |
| Net Loans | 10,962 | 11,313 | 24,207 | 23,626 | 28,726 | 29,597 |
| Growth of Net Loans | 3.7% | 3.2% | 114.0% | (2.4)% | 21.6% | 3.0% |
| Other Earning Assets | 1,723 | 2,491 | 8,994 | 13,810 | 10,897 | 11,339 |
| Deposits | 11,647 | 12,177 | 30,694 | 35,055 | 38,043 | 39,587 |
| Borrowings and Sub-Debt | 537 | 1,115 | 1,170 | 1,108 | 941 | 904 |
| Common equity | 2,366 | 2,373 | 4,648 | 4,803 | 4,830 | 5,079 |
| Book Value Per Share ($) | 64.3 | 68.2 | 65.2 | 67.8 | 63.4 | 66.7 |
| Tangible BVPS ($) | 37.1 | 39.4 | 41.0 | 43.6 | 36.5 | 39.8 |
| Source: SEC Filings, Author’s Estimates(In USD million unless otherwise specified) | ||||||
Expecting Earnings to Grow by 21%
The anticipated margin expansion and subdued loan growth will likely drive earnings this year. Meanwhile, I’m expecting the provisioning for expected loan losses to remain near a normal level. I’m expecting the net provision expense to make up around 0.14% of total loans, which is close to the average for the last five years. Overall, I’m expecting SouthState Corporation to report earnings of $7.91 per share for 2023.
For the last quarter of 2022, I’m expecting the slight margin expansion to lift earnings relative to the third quarter. The anticipated sequential earnings improvement is also attributable to a higher average loan balance. Overall, I’m expecting SouthState Corporation to report fourth-quarter earnings of $1.93 per share, up from $1.75 per share for the third quarter of 2022. This estimate will take the full-year 2022 earnings to $6.55 per share. SouthState Corporation is scheduled to announce its full-year 2022 results on January 26, 2023. The following table shows my income statement estimates.
| Income Statement | FY18 | FY19 | FY20 | FY21 | FY22E | FY23E |
| Net interest income | 513 | 504 | 826 | 1,033 | 1,298 | 1,520 |
| Provision for loan losses | 14 | 13 | 236 | (165) | 50 | 40 |
| Non-interest income | 146 | 144 | 311 | 354 | 333 | 328 |
| Non-interest expense | 421 | 405 | 798 | 948 | 942 | 1,036 |
| Net income – Common Sh. | 179 | 186 | 121 | 476 | 499 | 603 |
| EPS – Diluted ($) | 4.86 | 5.36 | 2.19 | 6.71 | 6.55 | 7.91 |
| Source: SEC Filings, Earnings Releases, Author’s Estimates(In USD million unless otherwise specified) | ||||||
In my last report on SouthState Corporation which was issued in June 2022, I estimated earnings of $6.41 per share for 2022. I have slightly increased my earnings estimate because the second and third quarters’ margin expansion beat my expectations. Additionally, loan growth has been higher than I previously anticipated.
My estimates are based on certain macroeconomic assumptions that may not come to fruition. Therefore, actual earnings can differ materially from my estimates.
High Total Expected Return Calls for a Buy Rating
SouthState Corporation has increased its dividend every year since 2011. Given the earnings outlook, it’s likely that the company will maintain the dividend trend this year. Therefore, I’m expecting the company to increase its dividend by $0.01 per share to $0.51 per share in the third quarter of 2023. The earnings and dividend estimates suggest a payout ratio of 26% for 2023, which is below the five-year average of 33%. Based on my dividend estimate, SouthState Corporation is offering a forward dividend yield of 2.6%.
I’m using the historical price-to-tangible book (“P/TB”) and price-to-earnings (“P/E”) multiples to value SouthState Corporation. The historical trends of these multiples have some outliers, as shown below. Therefore, I’m using trimmed averages.
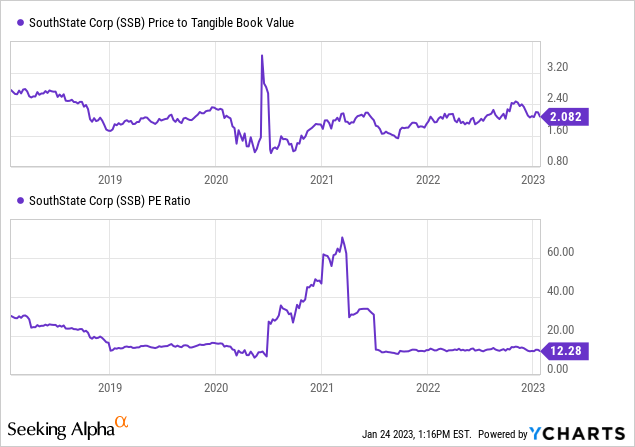
The stock has traded at a trimmed average P/TB ratio of 1.72 in the past, as shown below.
| FY18 | FY19 | FY20 | FY21 | T. Average | ||
| T. Book Value per Share ($) | 37.1 | 39.4 | 41.0 | 43.6 | ||
| Average Market Price ($) | 82.8 | 73.9 | 60.8 | 79.0 | ||
| Historical P/TB | 2.23x | 1.88x | 1.48x | 1.81x | 1.72x | |
| Source: Company Financials, Yahoo Finance, Author’s Estimates | ||||||
Multiplying the trimmed average P/TB multiple with the forecast tangible book value per share of $39.8 gives a target price of $68.6 for the end of 2023. This price target implies a 11.7% downside from the January 23 closing price. The following table shows the sensitivity of the target price to the P/TB ratio.
| P/TB Multiple | 1.52x | 1.62x | 1.72x | 1.82x | 1.92x |
| TBVPS – Dec 2023 ($) | 39.8 | 39.8 | 39.8 | 39.8 | 39.8 |
| Target Price ($) | 60.6 | 64.6 | 68.6 | 72.5 | 76.5 |
| Market Price ($) | 77.6 | 77.6 | 77.6 | 77.6 | 77.6 |
| Upside/(Downside) | (21.9)% | (16.8)% | (11.7)% | (6.5)% | (1.4)% |
| Source: Author’s Estimates |
The stock has traded at a trimmed average P/E ratio of around 14.2x in the past, as shown below.
| FY18 | FY19 | FY20 | FY21 | T. Average | ||
| Earnings per Share ($) | 4.86 | 5.36 | 2.19 | 6.71 | ||
| Average Market Price ($) | 82.8 | 73.9 | 60.8 | 79.0 | ||
| Historical P/E | 17.0x | 13.8x | 27.7x | 11.8x | 14.2x | |
| Source: Company Financials, Yahoo Finance, Author’s Estimates | ||||||
Multiplying the trimmed average P/E multiple with the forecast earnings per share of $7.91 gives a target price of $112.3 for the end of 2023. This price target implies a 44.7% upside from the January 23 closing price. The following table shows the sensitivity of the target price to the P/E ratio.
| P/E Multiple | 12.2x | 13.2x | 14.2x | 15.2x | 16.2x |
| EPS 2023 ($) | 7.91 | 7.91 | 7.91 | 7.91 | 7.91 |
| Target Price ($) | 96.5 | 104.4 | 112.3 | 120.2 | 128.1 |
| Market Price ($) | 77.6 | 77.6 | 77.6 | 77.6 | 77.6 |
| Upside/(Downside) | 24.3% | 34.5% | 44.7% | 54.9% | 65.1% |
| Source: Author’s Estimates |
Equally weighting the target prices from the two valuation methods gives a combined target price of $90.4, which implies a 16.5% upside from the current market price. Adding the forward dividend yield gives a total expected return of 19.1%.
In my last report, I adopted a hold rating on SouthState Corporation. Since then, the stock price has dipped a bit. Further, I have rolled over my target price from December 2022 to December 2023. As my updated total expected return is now quite high, I’m upgrading SouthState Corporation to a buy rating.
Be the first to comment