koto_feja
The prevailing “theme” used to justify relief rallies has changed throughout the year, but in all three cases, there was no justification for it in the first place. As I wrote in a recent SA article, I expect a sizeable relief rally this time, but there is no justification for calling a bottom at these levels, as was the case in the previous two relief rallies that started in March and June of this year.
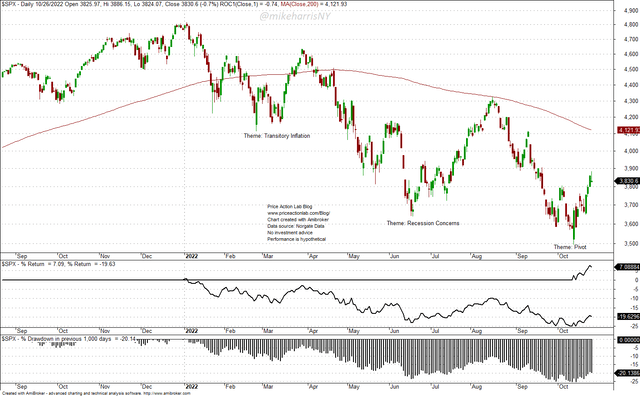
Daily Chart of S&P 500 (Price Action Lab Blog – Norgate Data)
Back in March of this year, the prevailing “theme” was “transitory inflation, as shown in the above S&P 500 (SPX) chart. By the end of the month, a major bull trap was in place.
Then, in June, the “theme” was about “recession concerns.” By mid-August, another bull trap was in place.
The “theme” of this relief rally is a “pivot.” Some even argued that a raise by the Bank of Canada yesterday by 50 basis points instead of 75 was a “pivot.” But “pivot” means a drastic policy change, not dynamic adjustments.
As part of the wishful thinking that is always a major driver of investment decisions, investors will always invent a “theme” to justify chasing a risk premium. This is how markets have always worked, and this behavior is not going to change anytime soon.
We will look at some data from the current relief rally that demonstrates it is still early to call it a bottom.
1. Value still outperforms and high beta continues to underperform.
The table below shows the performance of 11 total return indices since the bottom of October 13 and also year-to-date.
Performance of 11 Total Return Indices (Price Action Lab Blog – Norgate Data)
The only two total return indexes that have rebounded close to their 200-day moving average are the Dow Jones Industrial Average and the S&P 500 Value. The former also has the largest return of 9.06% in this relief rally. If this rebound was about a bottom, as implied by its construction, the S&P 500 High beta should have gained more than value. At the same time, the NASDAQ-100 has gained only about 5.8%, and despite the relief rally, the tech sector remains relatively weak. The same is true for S&P 500 growth. In other words, investors are trying to recover losses but are cautious about risks because there is high uncertainty.
2. There is no sector rotation
The table below shows the performance of 11 sector ETFs since the bottom of October 13 and also year-to-date.
Performance of 11 Sector ETFs. (Price Action Lab Blog – Norgate Data)
We are not seeing strong performance in consumer discretionaries (XLY), communications (XLC), and consumer staples (XLP), which are sectors that outperform during recessions historically. Instead, these have lagged during this relief rally, and, surprisingly, the best-performing sector is energy (XLE), with a 10.6% return, and the only one that is trading above the 200-day moving average.
For a bottom, we should expect a significant sector rotation and more sector ETFs moving above their 200-day moving average. If that happens, we may change our view about this relief rally signaling a bottom.
3. Asset performance is dismal and the bond market does not signal a pivot
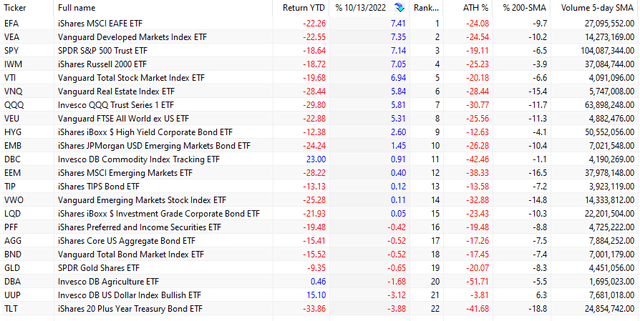
The table below shows the performance of asset ETFs since the bottom of October 13 and also year-to-date.
Performance of Asset ETFs. (Price Action Lab Blog – Norgate Data)
The bond market has been careful about calling this relief rally a bottom. Bond ETFs (AGG) and (TLT) are down since October 13, and most of the action has been in developed markets and large caps. Commodities (DBC) are consolidating and slightly below the 200-day moving average, indicating high uncertainty about future inflation. We need to see significant gains in bonds and large losses in commodities to justify the “pivot” theme. If that happens, then the odds of a bottom may increase significantly. However, the data shows this is more of a “scaling out” or “pause” than a “pivot” in anticipation of new data.
Also, note that the bulk of equity market gains have been driven by weakness in the U.S. dollar and commodities after a significant uptrend. Crowding in the managed futures space due to new ETF products may cause distortions and a false technical and even macro view. Many investors have changed managed futures returns in the last two months, with the volume of some ETFs rising exponentially. Some of the weaknesses seen in commodities may not be related to fundamentals but to a crowding effect. We need more data to conclude.
Conclusion
The third relief market for the year is underway and there has been a rush to call it a bottom due to a possible Fed “pivot.”
The data up to this point does not support the expectation of a bottom in equity markets.
- Investors have been careful to avoid higher-risk stocks.
- There is no sufficient sector rotation.
- Action in financial assets points to more uncertainty.
Despite the lack of data to support a bottom, this relief rally could continue because markets are driven by behavioral patterns and reflexivity. A 7.5% increase in the S&P 500 towards the 200-day moving average cannot be ruled out before the midterm elections. However, if fundamentals do not improve, another bull trap could lead to new lows.


Be the first to comment