

Natali_Mis/iStock via Getty Images
Dear Partners and Friends,
Our partnership recorded a loss of -19.0% net of all fees, expenses, and allocations for the quarter ending June 30, 2022. Over the same period, the S&P 500 recorded a loss of -16.1% including dividends.
|
Period1 |
Partnership Returns1,2 |
S&P 500 Returns1,3 |
||
|
Q3 2021 |
9.6% |
(0.9%) |
||
|
Q4 2021 |
13.5% |
11.0% |
||
|
2021 |
24.6% |
10.0% |
||
|
Q1 2022 |
(1.3%) |
(4.6%) |
||
|
Q2 2022 |
(19.0%) |
(16.1%) |
||
|
2022 YTD |
(20.0%) |
(20.0%) |
||
|
Inception to Date |
(0.4%) |
(11.9%) |
||
|
1Sohra Peak Capital Partners LP launched 7/22/2021; results for the Partnership and S&P 500 Index for Q3 2021 are presented from that date forth. 2Returns are presented on an unaudited basis for a theoretical Limited Partner net of expenses, 1% management fee, and 15% performance allocation. 3S&P 500 Index returns include dividends reinvested. Please refer to the disclaimer at the end of this letter regarding comparison to indices. |
The below table highlights the partnership’s key portfolio composition metrics as of June 30, 2022:
|
Key Portfolio Composition Metrics1 |
|||
|
Number of Holdings: |
11 |
Weighted Average Market Cap4: |
$1.8B |
|
Top 5 Holdings Concentration: |
60.2% |
Investments ex-U.S.5: |
80.1% |
|
4Calculated as the sum of each portfolio holding’s market capitalization in USD multiplied by its corresponding portfolio weight. Excludes cash. 5Measured as the percentage of portfolio assets, including cash, invested in companies with primary operations conducted outside of the U.S. |
Our partnership trailed the index for the second quarter as weak market conditions prevailed, resulting in the S&P 500’s worst first-half-year performance in 52 years. Valuation multiples contracted, and our holdings were not immune. Excluding foreign currency impacts, our portfolio would have outperformed the S&P 500 for the quarter, but changes to FX rates served as a material detractor from the partnership’s performance as the U.S. dollar strengthened meaningfully.12
In the near-term, despite wishing I could know what the future holds, the best visibility that I or anybody can provide is that the choppy waters of this year are likely to persist, as speculation over inflation, the health of the economy, and the direction of interest rates contribute to an atmosphere of uncertainty. As discussed in letters past, I expect our results to be volatile from month-to-month and quarter-to-quarter given our portfolio’s concentrated and small-cap nature, as well as its global exposure, but I believe this volatility will be worth enduring in our pursuit of superior long-term returns.
With regards to foreign currencies, our five FX pairs to which we have exposure averaged a -6.5% equal weighted decline during the quarter. The U.S. Dollar Index, a measure of the value of the U.S. dollar relative to a basket of foreign currencies, has gained +9.1% this year and is currently at its highest level since 2002, a period after which it declined by -30-40% over the following six-year period.6
To date, our partnership has not hedged our FX exposure, for two main reasons. The first reason is because historically, exchange rates between hard currency pairs have generally been volatile but little changed over long-term time frames. Among all of our currency pairs, looking back over multi-decade periods, each has experienced an average annual change of under +/-1%.12 The second reason is because hedging currencies can be expensive. To hedge our current FX pairs, each would require locking in annualized losses ranging anywhere from -1.0% for the euro to -9.6% for the Polish złoty.7
Going forward, FX rates will likely continue to be volatile and unpredictable, as they always have been. Our partnership’s performance should accordingly be helped and harmed when measured under short intervals, and under 5-10 year horizons our performance should be driven far more by the performance of our holdings than by the movements of our FX pairs. With that said, I have recently been exploring solutions to partially or fully hedge our currency pairs that are relatively inexpensive to hedge, in an effort to strike a balance between minimizing volatility and maximizing our long-term returns.
Silver Lining
The silver lining of the heavy selling pressure we have seen year-to-date, in my view, is that the current environment has presented, and in the coming months could better present, long-term oriented investors with one of the best buying environments that we have seen in years. Several years from now, this general period may be viewed retrospectively as a great opportunity to have invested in equities.
In particular, I think this general period will be viewed retrospectively as a great opportunity to have bought small-cap equities, who have outperformed their large-cap peers during the second-half of, and in the year following, 9 out of the last 10 recessions.8,10 Specifically, among the last 10 U.S. recessions, during the second-half of these recessions small-caps delivered an average gain of +17.1% versus large-caps returning +10.7%,and in the 1-year period following these recessions small-caps delivered an average gain of +27.5% versus large-caps returning +16.4%.8,10
While there is ongoing debate about whether the market has already bottomed or if the bottom has yet to arrive, small-cap companies still reside near decade-low valuation levels. As of June 30, 2022, the Russell 2000 forward P/E ratio sat at just 11.6x, its lowest level since February/March 2009 and March 2020.9 Should the market decline further, these opportunities should become more plentiful and attractive.
As a long-term oriented investor, I welcome downside volatility. All else equal, companies are able to be bought for lower prices and yield higher long-term returns. In practice, our search for high-quality businesses with long-term compounding runways run by quality executives yields a plethora of qualified businesses, but not often at acceptable discounts to intrinsic value. During distressed environments such as the current one, the probability of being given opportunities to purchase shares in these businesses at low prices improves.
As such, I have recently been spending the lion’s share of my time analyzing high-quality businesses that have fallen to or are falling close to attractive entry points, and I have added several to our portfolio.
Over a multi-year view, the economy and market have time and again proven to be resilient, and thanks to our high-quality partners and their understanding of the long-term orientation of our approach, we have no pressure to sell in the interim. The full credit therefore goes to our partners, who enable our partnership to take a long-term view, which I firmly believe is a competitive advantage in this business, and which in turn should serve our partnership well over time.
Portfolio Updates
For those who are interested in reading the condensed thesis of one of our top portfolio holdings, I have written on Auto Partner SA (APR.WA), about which I am quite excited, beginning on page 6 of this letter.
As of this writing, if our portfolio were viewed as one see-through company, based on sell-side consensus estimates it would be trading at a 1-year-forward P/E multiple of 8.7x, and a 3-year forward P/E multiple of 6.6x.11,12 This implies a ~15% net income CAGR and assumes no share repurchases, although multiple holdings of ours we expect will repurchase significant sums of shares over that period.11,12
I also believe most of our portfolio companies to be recession resilient. As of this writing, of our 11 holdings, 7 of those 11 were either publicly traded or have direct comps who were publicly traded during their respective countries’ most recent recessions.11,12 Among those companies, 6 of 7 increased either their operating income or operating margin, or both, through those recessions, and 1 of 7 saw a decline in profits and margins.12 Of the remaining 4 companies, 3 of 4 either operate in consumer staples industries or are the lowest-cost operators in their fields, and 1 of 4 would likely see a decline in operating profit and margin.12
As countries come to grips with economic weakness over the coming quarters, business models will be tested. I feel very good about our portfolio companies’ abilities to navigate the storm and, in a handful of cases, to use a recession to their advantage by expanding market share in the wake of weakened competitors.
Lastly, as an update, several letters ago, I promised an intention to increase the level of transparency of our holdings, as I believe our limited partners would benefit from knowing, and deserve to know, where their capital is being deployed and why I believe each opportunity is a prudent allocation of your capital. Beginning with our partnership’s next letter, it is likely that I will shift the format of these letters towards a more structured template that includes ongoing discussions of our top 5 holdings. Thank you for bearing with me as I get continue to get accustomed to writing these partnership letters.
During the second quarter, I sold a substantial portion of our shares in goeasy, and in July exited our position entirely, altogether at a significant loss from our weighted average purchase price.
Just seven months ago, I wrote about how goeasy is a business that I’d hoped to own for many years to come, while regularly challenging my thesis in the months and years ahead. In the six months since, goeasy has engaged in a rapid series of strategic developments, faster than I had imagined, which together have increased my perception of long-term risk, beyond comfort. A number of these developments include:
- Expanding rapidly into non-prime indirect auto financing, already over $100MM or 5% of the company’s total loan book, with an intention to continue growing this book to $250-300MM+, despite a lack of experience in this segment and lending at a time of elevated car prices.12
- Almost completing a ~$200MM acquisition of a U.S.-based non-prime consumer lender in Q1, but ultimately calling off the deal because goeasy intended to issue equity, its share price had fallen, and the deal no longer became accretive.12,13 In July 2022, goeasy appointed Jonathan Tétrault to its Board of Directors, in part in order to “help guide our future investments, acquisitions and international expansion plans,” suggesting continued appetite for M&A.14
- Entering in June 2022 into a strategic commercial partnership with Canada Drives, a Canadian online-based used car dealership whose business model is similar to Carvana (CVNA) and Vroom (VRM).14 Key details of this partnership included a guaranteed minimum volume of non-prime loan originations from Canada Drives and a $40MM convertible debenture investment from goeasy in Canada Drives.12 Canada Drives generates negative EBIT and 100% of loans are digitally underwritten.12
- Announcing pilot tests, with rollout beginning as early as this year, of a new goeasy smartphone app that allows existing customers to be cross-sold new loans, and could potentially allow brand new customers to receive loans, using 100% digital underwriting with no branch-based contact.12,13
From 2011 to 2021, goeasy’s easyfinancial was a branch-based lender whose loan book was 97-100% comprised of unsecured and secured loans that required in-branch servicing for all customers living within 40 kilometers of their nearest branch. This business model had worked terrifically, as goeasy compounded its earnings per share at a rate of +25% from 2011 through 2019.
But, fast forwarding to today, through various product introductions, acquisitions, and partnerships, goeasy has shifted from offering 2 products through 1 main customer channel to offering 6 products through 6 separate customer channels, with more products and channels intended.12 While I expected management to continue innovating new products and creating new avenues for growth, I expected these shifts to occur over a much longer time frame than has transpired. Instead, change has occurred at what I’d argue is an aggressive pace, and has been worrisome.
One main area of concern here has been the increasingly digital nature of goeasy’s underwriting, a clear pivot from their successful roots. Historically, goeasy’s customers who have been required to visit a branch to complete the loan approval process have incurred significantly lower charge-off rates than customers who haven’t been required to, suggesting the company’s face-to-face approach it has mandated for years has worked well, and has served as a competitive advantage over digitally-based lending peers.
But recently, goeasy’s new initiatives for continued growth have shown an increasing willingness to embrace fully-digital lending without a face-to-face element, including to new customers whose charge-off rates have historically been meaningfully higher than for repeat customers. This represents a shift away from goeasy’s successful model of the past and towards a new era that has yet to be proven.
The other main area of concern has been what I believe to be poorly-designed management incentives, which I fear may be driving goeasy’s willingness to enter new, adjacent lending markets through fast-paced underwriting and M&A. When goeasy’s current CEO was appointed in 2019, executive compensation was restructured such that management stood to maximize future bonuses if each year they compounded the company’s EPS at a +30% CAGR over the preceding 3-year period.
At face value, this compensation structure appears more thoughtful and shareholder friendly than most. But, where this structure can fail is when handed to an executive team that adds undue risk in the pursuit of overambitious growth targets.
Looking at recent events, goeasy continues to enter adjacent markets beyond areas of core competency, is still integrating a large acquisition from last year, was very close to completing another acquisition this year in a new country, and is piloting new, lower quality digital origination channels, all while heading into a possible recession.12 I don’t think management believes they are adding any undue risk. In fact, I think management is convinced that all of this is prudent strategy, and it may be.
But, I can’t help but think that justification to enter a new lending vertical, or to acquire a new company, becomes subtly easier when that action would also go a long way towards unlocking substantial compensation if things go as planned.
Esteemed investment manager Allan Mecham once remarked to his partners, which I find apt to this situation, that, “Our concern is not that the aggressive forecasts won’t be met, but rather that they will, at any cost! Earnings growth should be a consequence of sound strategy, not the object of it.” I still believe in a successful version of this management’s vision, one that is executed with prudence, and I admire the talent and rigor of the CEO.
However, as of now, the likelihood in my view that this next iteration of goeasy experiences a major hiccup due to credit quality issues has grown uncomfortably large beyond my expectations, and therefore we have sold our shares.
This investment has taught me valuable lessons. For one, beware the power of management incentives and pay close attention to how management incentives can create conflicts of interest between shareholders and executives, even for relatively thoughtful and shareholder-oriented compensation structures such as this one. Compounding EPS at +30% annually would be extremely friendly to shareholders, but only if done while taking appropriate risks.
Additionally, monitor valuation multiples relative to their historical ranges and embed this within one’s margin of safety framework. In hindsight, I should have considered trimming our position when shares were priced near $218 in September 2021 as they carried a 15-year high trailing P/E multiple of 21x based on trailing normalized earnings, with a lower bound of 7x over that time frame. Despite my forecast of +20% annual future free cash flow growth which implied a price still at a significant discount to intrinsic value, the company’s rich valuation multiples left little implied margin for error.
Looking ahead, my extensive studies of goeasy have educated me on the resilience and strength of nonprime consumers, which have helped me to identify what I believe to be misunderstood opportunities in similar industries, some of which I am exploring today.
Auto Partner SA (APR.WA)
Auto Partner headquarters in Bieruń, Poland (Source: Photo taken by Jonathan A. Cukierwar)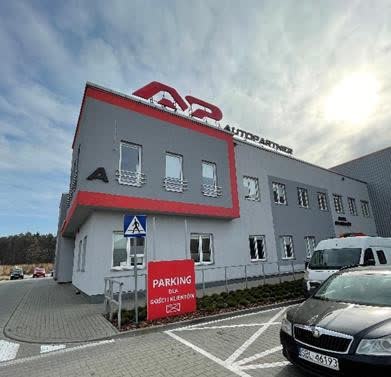
One holding of ours which I am excited to write about and which exemplifies our focus on underfollowed, undervalued, high-quality companies is Auto Partner SA (“Auto Partner”), a USD ~$350MM market capitalization small-cap company listed on the Warsaw Stock Exchange.
During my trip to Poland earlier this year, I spent a significant amount of my time conducting diligence on Auto Partner. This included visiting branches, customers, and warehouses, meeting with the management team of Auto Partner’s main public competitor, and meeting with the management team of Auto Partner at company headquarters where, according to them, no U.S. investor had previously visited.
Since 2013, its earliest set of publicly available financials, Auto Partner has compounded its sales at a +26% CAGR and its net income at a +30% CAGR, and has consistently earned double-digit returns on its invested capital.15 The company currently trades at a trailing P/E of 8x.16 For many reasons, I believe Auto Partner has a durable competitive position and is likely to continue growing sales and profits at high rates for many years.
Introduction to Auto Partner
Auto Partner is Poland’s second-largest distributor of aftermarket auto parts. The company was founded in 1993, shortly after Poland’s fall of communism, by President, Chairman, and 46% shareholder Aleksander Górecki.17 In the company’s early days, Mr. Górecki ran the business out of his 90 m2 apartment. He showcased auto parts out of his building’s hallways and delivered the auto parts to customers himself. The following 29 years have since seen the company expand organically into its current form with USD $500MM in annual sales, 110 domestic branches, and a distribution network to over 30 European countries.
To fully grasp Auto Partner’s business model, it is important to understand how the aftermarket auto parts ecosystem in Poland and Europe are quite different from that of America. In the U.S., if your car repair is light or moderate enough, rather than taking your car to a professional mechanic it is common to visit an aftermarket auto parts retailer such as AutoZone (AZO) or O’Reilly Automotive (ORLY). The do-it-yourself (DIY) market in the U.S. is strong, with 58% of surveyed U.S. car owners pre-pandemic opting to conduct DIY repairs compared to 42% opting to visit mechanics.18
In contrast, in Poland, when a person needs a vehicle repair, over 90% opt to visit professional mechanics, with less than 10% opting for DIY repairs. This is also the general situation in most, if not all, European countries. One main reason behind this difference is that European cars and their parts are significantly less homogenous and more complex than many non-European cars that one would find in America, and therefore the auto part SKU catalog a European store-based retailer would need to carry to serve a reasonable percentage of its customer base’s car repairs is significantly higher than in America.
Another reason is because the proportion of Poles living in apartments, 44%, is higher than the percentage of Americans, 20%, implying that the average Pole is less likely to have the necessary space in a driveway or otherwise to perform a DIY repair.19,20
Amongst professional mechanic shops, of the 90%+ of repairs that take place at mechanic shops, approximately 70% occur at independent mechanic shops as opposed to 30% at authorized service outlets (ASOs), with the former almost always offering noticeably lower prices and the latter usually being a more sensible option for cars still under warranty.21 In recent years, market share has shifted slightly from the ASOs to the independents as the average car age in Poland has increased as a result of people holding on to their cars for longer.22
Among Poland’s 70% independent mechanic market, ~99% are mom and pop owned and ~1% are part of larger chains, which has presented a favorable backdrop for the auto parts distributors who serve a stable customer base with low bargaining power. Despite a steady population, the TAM for auto parts continues to grow, too, as vehicle repairs have become increasingly complex and as the number of cars per 1,000 Polish inhabitants has increased from 451 to 656 over the past decade, a function of the population’s rising affluence.23
Worth mentioning, the high proportion of Polish consumer aftermarket auto part spending that occurs at the mechanic level and the generally low affluence nature of Poles suggest that aftermarket auto parts in Poland are much closer to being a consumer staple product than a consumer discretionary product.12
Typical Transaction Sequence
In the typical transaction sequence, a person needs their car repaired. They bring their car to a local mechanic, who then tells the customer to come back in either hours or days, depending on the complexity of the repair and the mechanic’s car backlog.
The mechanic’s incentive here is to receive the part as quickly as possible to begin the repair, because faster repair times lead to happier customers and free up work space for quicker turns on repair jobs. To receive the part, the mechanic either calls or, in the case of Auto Partner and other leading distributors with IT systems, submits an online order for the specific part(S) they need from their distributor’s local branch, waits for the distributor to confirm whether that SKU is in stock, and waits for delivery.
Auto Partner’s central warehouse in Bieruń, Poland (Source: Photo taken by Jonathan A. Cukierwar)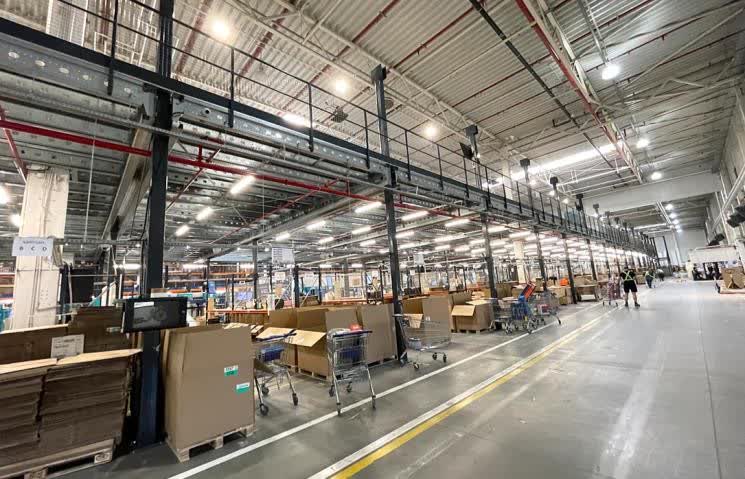
From Auto Partner’s point of view, auto parts first arrive at their central warehouses from suppliers where the parts are sorted. Auto Partner constantly monitors branch inventory levels and sends deliveries from the warehouses to their 110 domestic branches to replenish local inventory. At the branch level, once a customer order is received, the parts are added to a basket and loaded onto a last mile vehicle to be delivered during that day’s next scheduled delivery trip.
Competitive Advantage
Based on feedback from various industry sources, I have surmised that in order for a distributor to deliver a leading value proposition to its mechanic customers, a distributor must win or be competitive in three areas, listed in order of importance:
- Selection and ready-to-deliver availability of any given auto part SKU, of which there are 100,000s.
- Speed of delivery time, preferably within hours, or sooner, of placing an order.
- Competitive prices.
Auto Partner wins over its smaller, more fragmented distribution competitors by having higher SKU selection and availability, delivering parts frequently, and offering competitive or lower prices.12
The most important consideration to a mechanic when placing a parts order is whether a distributor has that particular SKU in stock.12 Auto Partner over its 29-year history has built its SKU catalog to 250,000 and its supplier count to 350, and believes that its catalog offers almost 100% of customer SKUs outside of tires and body parts.
This is greater or much greater than most smaller, fragmented competitors, who aren’t able to source as many SKUs because they have fewer supplier relationships, less scale, and/or don’t have the warehouse capacity to build such a catalog. Mechanics place high value on this element, as they want relationships with distributors who can act as reliable, convenient one-stop-shops for every order.
The second-most important consideration to a mechanic is the average speed of delivery for each order. In order to deliver to customers quickly, a distributor must have a branch present near the mechanic, which helps level the playing field for smaller distributors and mom and pops.
In areas where Auto Partner has a branch presence, it is common for Auto Partner branches to make between 3-8 delivery trips per day to each mechanic customer, which is as frequent as any other distributor and allows mechanics to receive their parts within hours or sooner.12 This also means that, when Auto Partner opens a branch in a new neighborhood, it immediately becomes competitive on speed of delivery time while retaining its advantages on SKU selection and availability as well as competitive pricing.
Third and importantly, prices must be competitive in order to win business. Large distributors such as Auto Partner have a clear advantage in this category thanks to their scale, which has allowed them to increase gross margin by ~8% since its early years as a result of increased bargaining power with suppliers over time. For branded auto part sales, this gives Auto Partner the choice of either undercutting smaller competitors on price or offering similar prices and pocketing the extra margin.
Auto Partner also has a strong private label brand, MaXgear, which comprises ~20% of total sales and provides ~100% higher gross margin than branded products.12 MaXgear prices are available to customers at a price point of ~3040% lower than branded products while possessing product quality that is on par with branded products, as evidenced by MaXgear complaint rates being similar to those of branded products.24 Few domestic competitors have strong private label brands.12
Mechanic Shop near Warsaw, Poland; MaXserwis Partner (Source: Photo taken by Jonathan A. Cukierwar)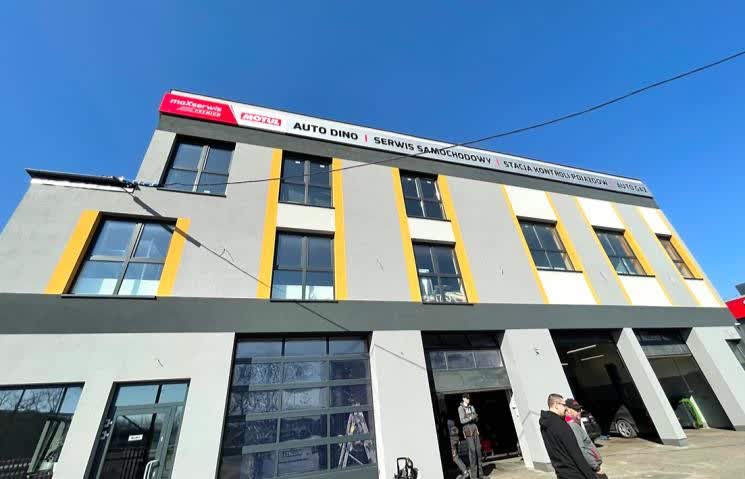
In addition to the above, Auto Partner’s strong competitive position is reinforced by its customer online ordering portal and its mechanic-assistance program MaXserwis. Auto Partner’s customer online ordering portal receives 62% of total mechanic customers order traffic, which has cost millions of dollars and taken years to build, which adds value to the mechanic’s customer experience.24 Most competitors, especially smaller ones, still require customers to place orders over the phone.
Auto Partner also partners with mechanics through a program called MaXserwis whose purpose is to help mechanics stay current on car repair knowledge given increasing general car complexity, and also leases specialized tools to mechanics who might need them.12 These mechanic shops in return tend to do more business with Auto Partner, brand their shops with visible MaXserwis banners, and receive the privilege of being listed on the http://maxserwis.com.plwebsite, an aggregator for car owners to search for high quality mechanic shops in their area.
Auto Partner is selective with whom it partners with under MaXserwis, intending only to partner with those who are of high quality, and frequently turns down applications from mechanic shops wishing to join the program.12
Significant Growth Opportunities Ahead
There is ample opportunity ahead, I believe, for Auto Partner to continue growing profits at high rates for many years, which could occur through various avenues:
- Opportunity to 2-3x Domestic Branch Count: Auto Partner currently operates 110 branches with 10% market share while its main competitor Inter Cars operates ~300 branches, despite both having a similar value proposition with regards to SKU selection, availability, and price point. Auto Partner intends to open 10-15 branches per year for the foreseeable future.12 The main bottleneck behind branch expansion has not been TAM, but according to management, rather the result of balancing growth with profitability.12 Branches take ~2 years to achieve breakeven and ~4 years to mature, which implies operating profit drag by immature branches.12 Positively, as branch count increases, the ability to accelerate branch openings while maintaining profitability increases, too.
- Large, Untapped Rest-of-Europe TAM: ~50% of Auto Partner’s sales and profits come from its distribution of auto parts to customers outside of Poland across 30+ European countries.24 Auto Partner has grown this segment from PLN 59MM in 2012 to PLN 1,034MM in 2021 or a CAGR of +37%, and in its most recent quarter grew this segment by +50% YoY, indicating the Europe distribution opportunity may still be in its early innings.24 The company still captures just 0.3% of this estimated USD $260B TAM and believes it can capture much more. This business model is slightly different, with sales being made to middlemen auto parts shops instead of to mechanic shops directly. Auto Partner manages to offer competitive prices, selection, and delivery times, even to customers as far away as France, despite for instance a 16-hour time to delivery. Some European customers report receiving their products in a shorter period of time from Auto Partner faster than they do from domestic distributors located much closer to the customers.12
- Launch Branch Presence in Eastern European Countries: Auto Partner has just one branch outside of Poland. Currently, the company is still enjoying strong growth in Eastern Europe through sales to middlemen auto parts shops who comprise ~30% of the market. Once that market eventually saturates, Auto Partner intends to begin building branch networks in bordering Eastern European countries to target the remaining 70% of TAM which sells to mechanics directly, as they do in Poland.12 Main competitor Inter Cars has over 400 branches outside of Poland, most of which are in Eastern European countries, providing a precedent for business model success.
- New Warehouse((s)) Domestically and Internationally: Auto Partner currently has two large warehouses located in Bieruń and Warsaw. It plans to open its third domestic warehouse this year in Poznań, and more in the future, which should increase logistics efficiency by lowering average time to delivery from warehouses to branches and ultimately to mechanics. In addition, we think there is also opportunity to eventually open automated warehouses in Western Europe, which would cut commute times down dramatically from current 8-16+ hour trips and improve the company’s value proposition to large swaths of Europe’s USD $260B TAM.
- Introduction of Tire Sales: Tires represent ~15% of the aftermarket auto parts TAM which Auto Partner has not carried to date, and may begin to carry in the near future.24 Tires are among the least efficient auto parts to sell as measured by profits:m2 required to store and transport them.12 Now that Auto Partner has finally procured a vast catalog of SKUs for most product categories outside of tires, tires remain as one of the last categories left to carry.12 Turning on this switch can fill part or all of this ~15% revenue gap and further increase the company’s reputation as a one-stop-shop.
- Gross Margin Expansion: Sustainable gross margin could expand by an additional +2% over time as private label MaXgear adoption increases and also as domestic branch count increases. MaXgear’s blended take rate is currently around 20%, which tends to be lower for newer customers and higher for more mature customers. As the company’s customer base matures, blended MaXgear adoption could increase and contribute to higher company-level gross margin. Increasing domestic branch count would also place Auto Partner physically closer to the average customer which has historically increased pricing power as, for example, customers may be willing to accept +5-10% higher prices per part if the average delivery time is reduced from 3 hours to 1 hour.
Main Competitors
Auto Partner’s main domestic competitors include Inter Cars (~30% market share), Inter Team (~9-10% market share), and H.M. Gordon (~7% market share).12
Inter Cars is a strong player whom I view as a more-scaled version of Auto Partner. Among their similarities and differences, the biggest qualitative difference in my view is leadership, specifically the change of President (CEO) at Inter Cars that occurred in 2017 when founder Krzysztof Oleksowicz passed down the CEO position to his son, Maciej, who had limited experience at Inter Cars before assuming the helm. Since the beginning of Maciej’s tenure, Inter Cars has engaged in a series of seemingly growth driven, but also seemingly scattered, initiatives such as manufacturing and selling semi-trailer trucks, opening Isuzu car dealerships, selling marine parts, and launching a rental car services start-up, each with mixed or no success to my knowledge.12
Meanwhile, Auto Partner is led by Founder and CEO Aleksander Górecki who is still in his 50s, with likely many years to operate ahead of him, has a proven 29-year track record, and who in my view is clearly ambitious for his business. As a sign of confirmation, I asked Maciej, CEO of Inter Cars, “which of your Poland competitors do you respect the most,” to which he was quick to answer, “Auto Partner. Auto Partner is a really nice company. A rising star, even.” No other competitors were mentioned.12
Inter Team and H.M. Gordon are of similar scale to Auto Partner, though each currently saddled with their own set of issues. According to both Auto Partner and Inter Cars, when Inter Team was acquired in 2018 by LKQ Corporation, a USD $15B market capitalization global auto distribution giant, LKQ mismanaged Inter Team’s strategy by raising prices significantly to try and capture higher gross margins.12 Customers left, and Inter Team in recent years has become a market share donor to Inter Cars, Auto Partner, and others.12
This also serves as a positive data point against the threat of multinational distributors entering the country and winning market share, as LKQ apparently managed to misjudge the Polish market. H.M. Gordon only grew post-COVID revenues at +5% YoY, lagging Auto Partner’s +35% and Inter Cars’ +34%, supposedly the result of internal dysfunction centered around a divorce within the governing family.12
Valuation
As of this writing, Auto Partner carries a market capitalization of PLN 1,591MM and delivered trailing annual net income of PLN 199MM, or a P/E of 8.0x.16 Gross margin is currently elevated at 29.5%, which in a normalized scenario I estimate should be closer to ~26.5% and operating margin closer to ~7.5%.12 Given the drag of immature branches on profits, I also estimate that the company’s trailing profits would be higher by about PLN +13MM in a steady state which, when combined with normalized margins, would imply a total of PLN 159MM in trailing steady state free cash flow or a 10x multiple today.12,16
Looking forward, my view is Auto Partner should continue growing at high rates through the numerous greenfield opportunities available to them, as detailed earlier. In 4-5 years I expect that Auto Partner could reasonably generate PLN 400MM in steady state free cash flow or a 25% yield to its market cap today.12,16
Although the conflict in Ukraine lingers on, my belief is that an eventual armistice would act as a significant, positive catalyst for Poland’s currency and for Polish equities. The Polish stock market is currently trading at its lowest-ever valuation relative to developing peers, in part due to high inflation-driven interest rates, and in part due to overhang from the Ukraine war, both of which I expect to eventually subside.12,25
Administrative
In addition to updates pertaining to our investments, I will also always intend to share updates on key matters pertaining to the administrative side of our partnership. In recent weeks, I have begun the process of upgrading our fund administrator from our current boutique fund administrator to a global top 10 fund administrator with over $100 billion in assets under administration. This change, which I expect to materialize, will likely occur at year-end.
As our partnership grows in size and scope, having recently accepted our first institutional limited partner, I also expect for us to take administrative steps to evolve accordingly, such as having suitable service providers in place. Our current fund administrator has done a great job at serving our partnership’s needs to date for an excellent price, and fortunately our expected incoming fund administrator has offered us their services at the same low price as what our current fund administrator charges.
Closing Thoughts
Thank you for taking an interest in our latest letter. I am excited about our partnership’s future.
If you wish to learn more about the partnership or are interested in becoming a limited partner, please feel free to reach out to me by phone or email. Our partnership welcomes introductions to new investors who are aligned with our philosophy and with our long-term approach. Accredited Investors interested in receiving future partnership letters can also register on our website atwww.sohrapeakcapital.com/contact.
I appreciate the trust you have placed in me to invest your hard-earned capital, as I presently have the significant majority of my wealth invested right alongside you. I look forward to writing to you again next quarter.
Most Sincerely,
Jonathan A. Cukierwar, CFA | Manager of Sohra Peak Partnership LLC, the General Partner of Sohra Peak Capital Partners LP
Footnotes(6) Source: MarketWatch, U.S. Dollar Index. Search – MarketWatch (7) Source: Interactive Brokers, Margin Rates and Financing. (8) Source: Anchor Capital Advisors LLC, Small Caps and Recessions – Anchor Capital Advisors (9) Source: Bank of America Global Research, Small/Mid Cap Valuations. (10) Excludes 2020 recession. (11) Source: TIKR. Calculations are performed by Sohra Peak Partnership LLC, are based on forward-looking sell-side “NetIncome” consensus estimates, and may be subject to error. Data used to perform these calculations are as of July 29, 2022. (12) Source: Estimates, thoughts, opinions, and research of Sohra Peak Partnership LLC. (13) Source: goeasy Ltd., Q1 2022 Earnings Call, May 12, 2022. (14) Source: goeasy Ltd., Financial News, https://investors.goeasy.com/news-releases. (15) Source: Auto Partner SA, Financial Statements. (16) Data as of August 2, 2022. (17) Includes common shares held by Katarzyna Górecki, Aleksander Górecki’s wife .(18) Source: CarParts.com, More Car Owners Shifting to DIY Auto Repair, CarParts.com – Right Parts, Guaranteed (19) Source: Statista, Distribution of the population in Poland as of 2015, by dwelling type. (20) Source: U.S. Census Bureau, American Community Survey, 2014. (21) Source: The Boston Consulting Group, Returning to Growth: A Look at the European Automotive Aftermarket (22) Source: Polish Automotive Industry Association (PZPM), https://www.pzpm.org.pl/en/Publications/Reports. (23) Source: GUS, Central Statistical Office of Poland, https://stat.gov.pl/en/search/search.html. (24) Source: Auto Partner SA, Periodic Reports, Prospectus. Reports – Auto Partner S.A. (25) Source: Bloomberg, Warsaw’s New Stock Darlings Make Heat Pumps and Bulletproof Gear. https://bloom.bg/3Pg8HCS.
|
Editor’s Note: The summary bullets for this article were chosen by Seeking Alpha editors.
Be the first to comment