

Justin Sullivan
Intro & Thesis
SoFi Technologies (NASDAQ:SOFI) is a controversial company, at least in terms of the discussions that flare up here on Seeking Alpha quite often (compared to most other growth companies). Disputes usually flare up overvaluation or SBC practices, and since SA fellow Christopher Hoeger has already clarified the point regarding SBC [highly recommended for understanding SoFi’s specific situation], the company’s valuation is still a point of contention for investors.
- How should SoFi be valued – as a traditional bank or as a fintech company
- How can SBC be taken into account when valuing the company?
- What is the best valuation model for SoFi based on its business structure?
- And most importantly, the bottom line – is SoFi currently overvalued or undervalued?
I will try to answer these questions in my article today – hopefully, I will succeed in putting the “icing on the cake”.
How To Value SoFi Stock? SOTP Is The Best Fit
SoFi Technologies was founded in 2011 and is headquartered in San Francisco, California. It is a digital financial services company with a current market capitalization of about $5 billion that went public in November 2020 [valued at $5.7 billion at the time] and reached a parabolic peak in February 2021 [at a market capitalization of over $18 billion].
As it follows from SoFi’s latest 10-Q filing, the company allows its members to borrow, save, spend, invest and protect their money, operating through 3 reporting segments:
- Lending – personal loans, student loans, home loans, and related servicing (72.67% of total net sales);
- Technology Platform – a combination of Galileo [acquired in May 2020 for the total sum of $1.2 Billion] and Technisys [acquired in March 2022 for $900 million worth of SoFi’s stock], both of which powers North and Latin Americas’ leading fintech (20.55%);
- Financial Services – a digital bank, mobile-based investment platform, personal finance management product, financial services marketplace platform, and so on – it’s a neo-banking business division (4.21%).
Despite the apparent insignificance of the third segment, its contribution margin is extremely negative – in the last quarter, the loss exceeded net interest income by almost 2x.
SoFi’s latest 10-Q, author’s notes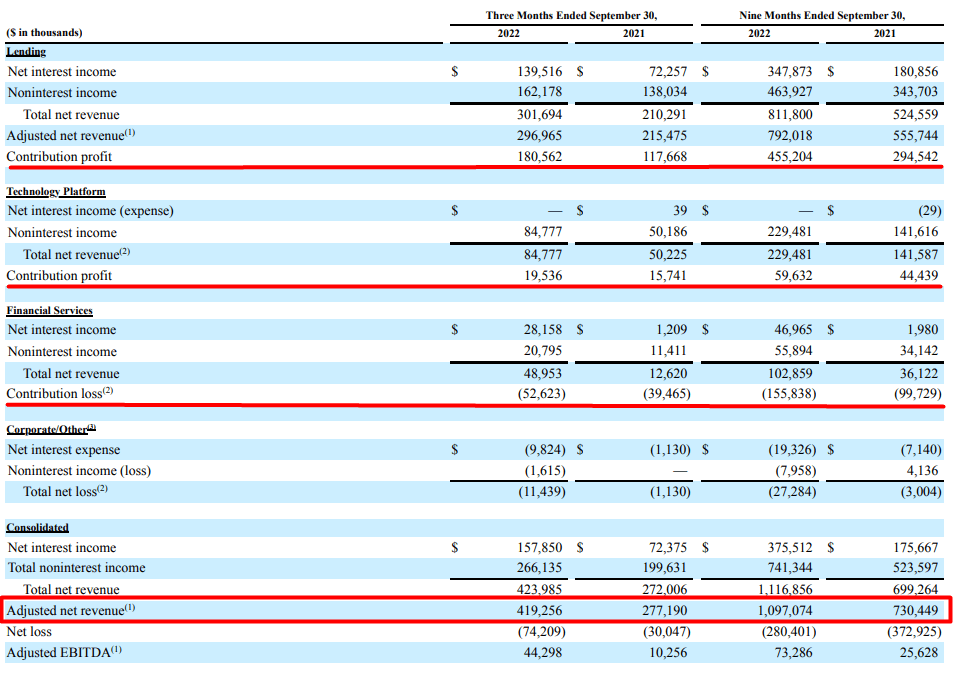
It’s clear that the Financial Services segment is at the stage of gaining its scale, as net interest income increased almost 24 times (9M 2022 vs. 9M 2021), and the contribution loss increased only 1.6 times. Therefore, I consider the unprofitability of this segment to be quite justified.
If you look at the revenue structure, the Technology Platform segment generally does not have interest income, which means that the entire segment operates as a technology company rather than a traditional banking company.
Therefore, in my opinion, the best way to value a business, in this case, is a Sum-of-the-Parts valuation analysis – SA fellow IP Banking Research agrees with my opinion. He wrote recently (emphasis added):
I believe that SoFi deserves a sum-of-the-parts valuation which would include a distinct valuation for the technology division and a separate one for the banking subsidiary.
What To Do With SoFi’s SBC?
I like the question Christopher Hoeger asks in his article on SoFi [mentioned above]:
If you owned a small business and were offered a 2.8% loan, or even a 5% loan, to pay for 50% revenue growth in your business, wouldn’t you take it in a heartbeat? That small dilution is paying for massive growth and incredible execution.
Please correct me in the comments if you disagree with my reasoning, but the question itself makes the SBC a kind of new “cost of capital.” There is the cost of debt – a hypothetical percentage that a company must pay if it borrows money now (loans/bonds). There is the cost of equity in the traditional sense – the required return on the investor’s capital. The final discount rate, which is the weighted-average sum of these costs, is used to derive the present value of future cash flows, which after a series of simple operations, are divided by the CURRENT number of shares. So the future dilution from the SBC is not included in this equation, right? What if we used forecast data for average long-term SBC as a % of revenue as an additional cost of capital? Something like “cost of capital dilution” or “cost of diluted capital”?
The actual dilution, according to Christopher’s calculations, is going to be around 2.8% in the foreseeable future, because the PSUs are unlikely to be issued if SoFi is not a 10-bagger in the medium term.
So first, let’s value SoFi as a (neo) bank
Since SoFi Technologies can be generally described as a neo-bank, its valuation cannot be subjected to classical FCFF discounting because its debt is – roughly speaking – like inventories for a classical business, and therefore:
a) SoFi cannot have a “cost of debt”;
b) there is no point in bothering with WACC – it loses its meaning because there is no debt as a funding source;
c) the FCFF thus becomes the FCFE, which is treated completely differently.
I think it’s possible to value SoFi’s neo-banking business using a DCF approach with the specifics mentioned above – as described by Tim Koller and other McKinsey experts in their legendary Valuation book. But I have insufficient data on how the individual segments behave – their margins and profit dynamics, as well as the assets structure – so I cannot properly calculate and predict ROE figures without taking too many rude assumptions and approximations.
I compiled a sample of companies with similar business operations and market caps and found that the median ROE is around 20% – this is quite a lot and in my opinion unattainable for SoFi in the medium term. However, this is the sustainable level I believe the company will strive for and can achieve in 5-7 years.
Over the last 9 quarters, total assets have grown at a CAGR of ~7.8% (QoQ) – I expect this rate to fall to 3% for the next 6 years (up to E2028). Equity as a percentage of total assets will gradually decline and reach 18% by 2028, compared to the current 32.7%. According to my model, ROE will only leave the negative territory in Q1 2024, then gradually increase and reach 18% by E2028. This is not very conservative and involves a very generous assumption of huge margin expansion, which seems inevitable if the company’s balance sheet remains as strong as it is today and the number of products and customers continues to grow thanks to the prospect of Latin America’s TAM/SAM.
According to market-risk-premia.com, the implied market return today stands at 6.85% while the market risk premium equals 3.17%:
market-risk-premia.com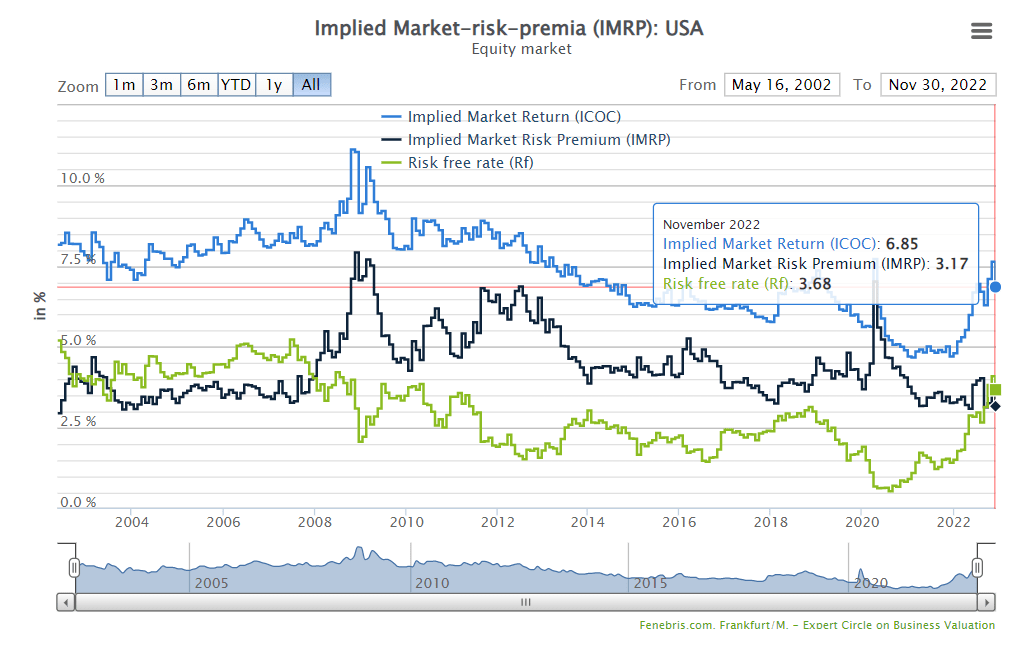
As I wrote above, my non-classical approach to valuation – which may be fundamentally wrong for some of you – is to treat the SBC as an additional markup on the cost of equity. So the discount rate is for me:
risk free rate + beta * MR + SBC
or
3.68% + 1.872 * 6.85% + 2.8% = 19.30%
This is a very high discount rate. But the forecasted company’s growth based on the model is astronomical – both in terms of absolute indicators and in terms of margins and profitability.
Thus, the discounted FCFE will amount to $3.149 billion by the end of E2028, inclusive. If SoFi stock trades for 2 times its book value in 2027, then its total valuation (sum of FCFEs + terminal value) should be $7.11 billion – almost 41% higher compared to what SoFi is worth now. Since this is a model entirely driven by asset growth, we need to look at how it responds to the QoQ growth assumption – it turns out that the underestimation persists even with quite modest inputs:
Sensitivity analysis, author’s calculations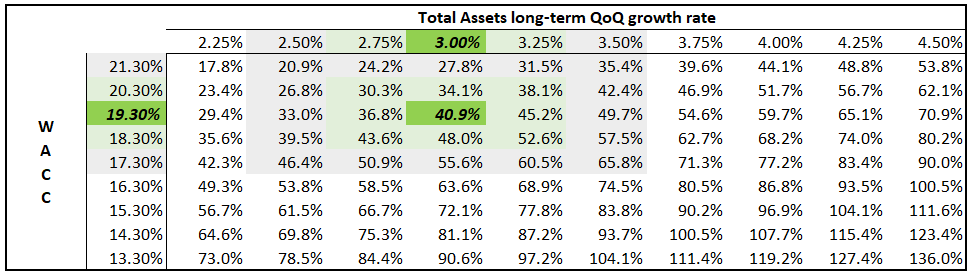
Sum-of-the-Parts Valuation
The calculations you saw above evaluate SOFI as a traditional bank, but one that is growing by leaps and bounds (making it a neo-bank), qualitatively in terms of the bottom line. But based solely on the fact that interest income is reported in the company’s income statement, banking (Lending + Financial Services) accounts for about 80% of the whole business. That is, the Technology Platform segment’s prospects were not included in the calculation, even though it represents 1/5 of the total business (in terms of consolidated net revenue) and does not bring in interest income like a traditional banking segment.
Therefore, I propose the following: let’s value this non-bank segment by a comparative valuation method and derive the weighted average of the final SoFi valuation by combining this part with the FCFE-based output.
If we compare SoFi’s TP segment to industry competitors, then based on the average multiplier, this segment should be worth about $1.6 billion:
| Company / Metric | Last Q, Total Net Revenue, YoY | P/S FWD |
| SoFi’s Technology Platform segment | 68.79% | NA |
| Green Dot Corporation (GDOT) | 1.25% | 0.65 |
| Affirm Holdings, Inc. (AFRM) | 34.24% | 2.28 |
| Fiserv, Inc. (FISV) | 8.53% | 3.89 |
| Fidelity National Information Services, Inc. (FIS) | 2.77% | 2.85 |
| American Express Company (AXP) | 14.92% | 2.2 |
| MercadoLibre, Inc. (MELI) | 44.78% | 5.17 |
| Block, Inc. (SQ) | 17.45% | 2.46 |
| Visa Inc. (V) | 18.72% | 14.43 |
| Mastercard Incorporated (MA) | 15.47% | 16.27 |
| Average | 22.69% | 5.58 |
| Median | 16.46% | 2.85 |
| SOFI’s total net revenue in Technology Platform (LTM), $M | $279.7 | |
| SoFi’s Technology Platform valuation [based on average P/S], $B | $1.56 | |
Source: Author’s calculations, Seeking Alpha data
But it is easy to see that SoFi’s business is growing three times faster than the industry – so a premium would need to be added to the 5.58x multiplier. I think that with that kind of growth, a P/S of 7x would be appropriate. Then this segment comes to an estimate of $1.96 billion.
Then the final SoFi score should look like this:
80% * $7.11 + $1.96 = $7.648 billion
This corresponds to an upside potential of about 51.5% of the last closing price.
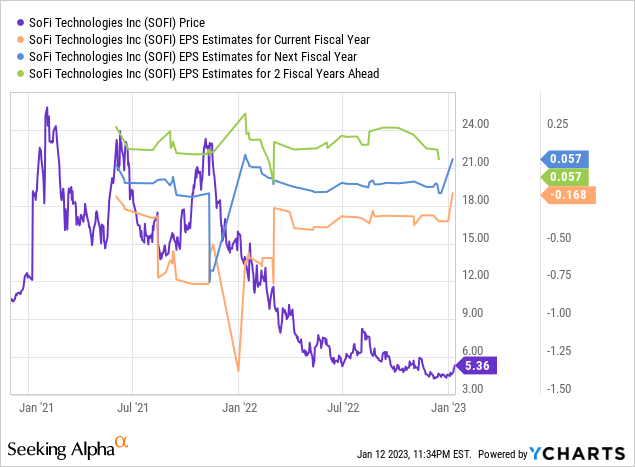
Again, it is important to understand that this estimate includes assumptions that the company will a) continue to grow revenue fairly rapidly and b) do so efficiently, reaching breakeven and moving away from it in the near future. The non-GAAP forward estimates Indicate that this is likely to be the case:
Bottom Line
Despite some fears, SOFI has continued to grow quite rapidly, and if we extrapolate this growth [with a slowdown] for the next 5-6 years, then you can value SoFi today as a traditional bank with an upside potential of about 30-50%. If we separate its Technology Platform segment, then the upside potential of the “fair value” can be more than 50%, with a small premium to the implied price-to-sales ratio of the industry average.
There are a number of obvious risks to consider when looking at my findings on SOFI’s valuation. First, I use a non-classical approach to cash flow calculation – it is impossible to value a bank using FCFF, so I look primarily at ROE and asset growth. If the share of common equity as a percentage of total assets falls faster than I expect and ROE stops growing at like 10%, the end result will not show the undervaluation I am now coming to.
Second, my assessment of the Technology Platform segment is also quite subjective, as the sample companies I use for comparison and the P/ ratio premium I set are my personal choices. I may be biased and I have to admit that.
The third point, of course, concerns the risk of a recession and, as a result, sustained inflation in the valuations of high-growth companies. Strong multiple contraction and concerns about the sustainability of the company’s business model led SoFi Technologies, along with other high-growth, unprofitable companies, to lose more than 77% of its market capitalization on the stock market since November 2021 (~80% from all-time highs). Perhaps this poor price action continues in the future if (SPY) bounces off its new resistance level and starts testing a new low shortly – by analogy with 2008.
TrendSpider chart, taken from Twitter, @Braczyy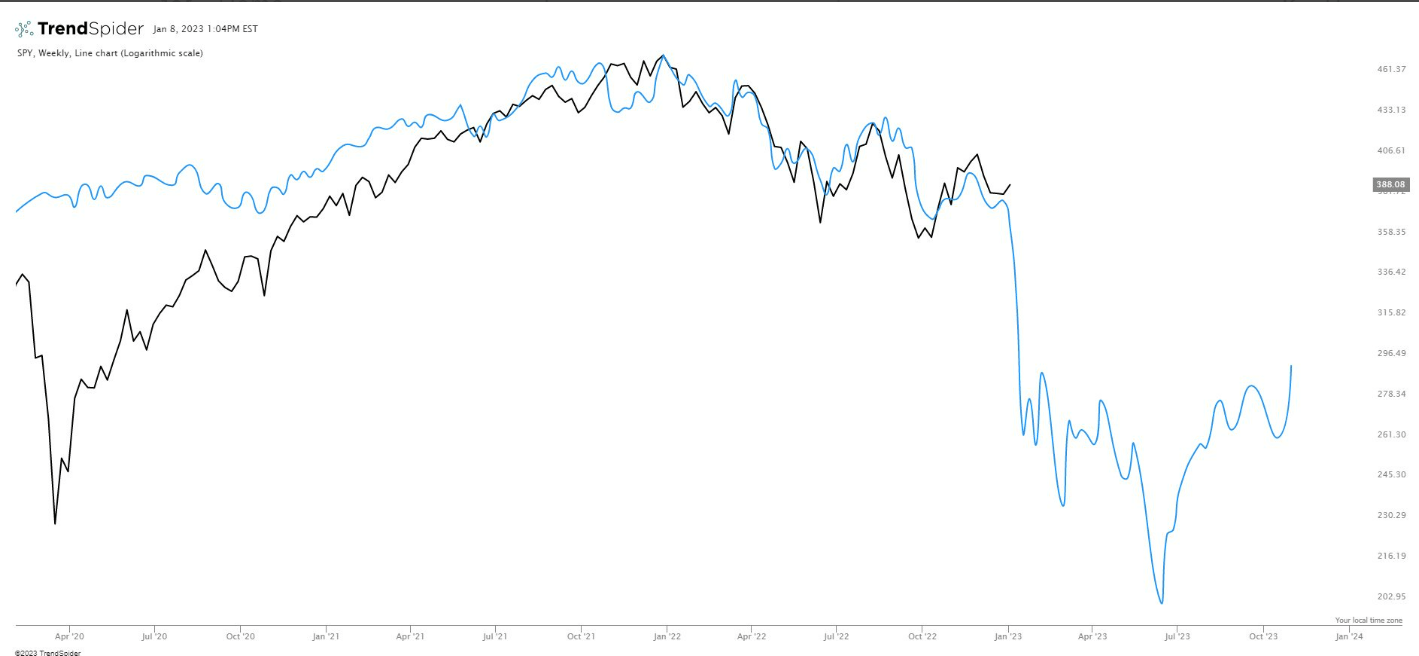
Despite all the risks, however, SoFi Technologies seems to be an interesting growth company for a long-term investment. Even with a natural slowdown in current growth rates – which we see against the backdrop of an already turbulent global economy – SoFi’s intrinsic value is already higher than what one has to pay for it.
If the current positive market trend continues, I believe that the resulting divergence in the weekly chart as well as the breakout of the triangle pattern will allow SoFi stock to rise further by at least 10-15% in the short term.
TrendSpider, SOFI, author’s notes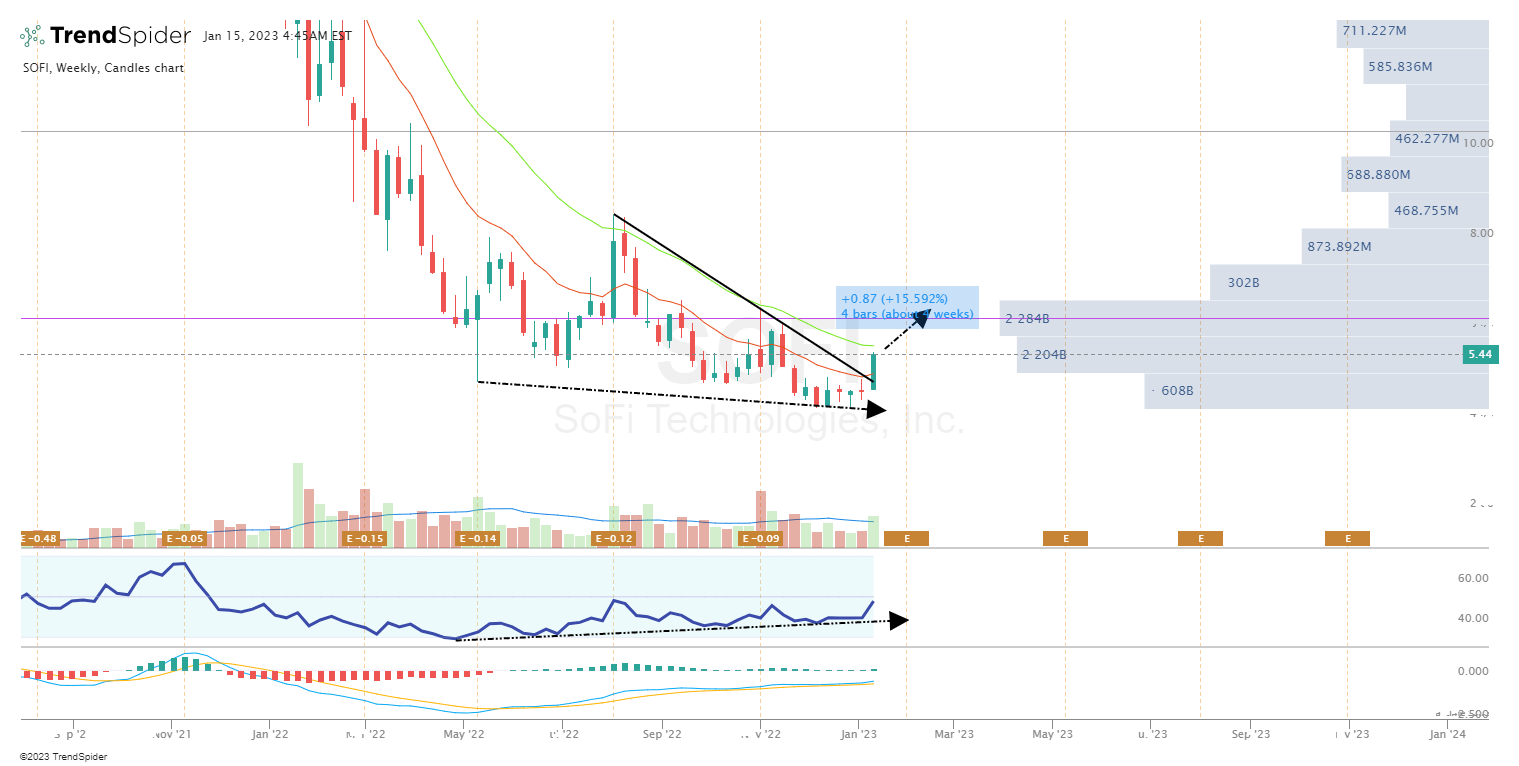
Thank you for reading!
Be the first to comment