PM Images
Dear Partners:
I hope that you are doing well. While 2022 was a challenging year, the decline in the market value of our portfolio was both moderate and I believe temporary. Due to our disciplined value investing process we avoided many land mines that caused permanent capital destruction for others.

Sometimes, what you don’t see is as important as what you do see. Had the post-bubble market environment developed into a more severe market crash last year rather than just a modest sell-off, our results would likely have been substantially better. Certainly the gap between our returns and the market’s would have been much wider. Lest you think this is just “woulda-shoulda-coulda” type thinking, this is important for two reasons. First, it is aligned with our goal of prioritizing not losing money over reaching for an extra unit of return. Second, real risk management is about considering many paths that the world can take rather than optimizing returns for any one path.
Negative returns are never a cause for celebration, and as I wrote you in the Q3 letter, I did make mistakes. However, a number of our investments were not mistakes, but simply went out of favor with the market. As fundamental developments at our companies unfold, I believe we will see more than our share of successes from what is currently in the portfolio.
More broadly, the market bubble of the last few years is over, and that strongly favors a disciplined value investing strategy such as ours. Regardless of the pace or the severity of the consequences of the popping of the bubble, a more rational environment where success is measured in cash flow rather than in stories is good for long-term investors like us.
We had one new partner join in Q4, and there are several prospective partners in various stages of onboarding. The partnership is open to long-term investors who want to safely compound their capital at attractive rates, and who use process rather than outcome to measure short-term progress.
Investment Activity
I made the following changes to the portfolio since the end of October through the end of 2022:
- Exited the Freshii (FRII:CA) position after a buyout offer from a strategic buyer who offered what I consider to be a fair price and a large, > 100%, premium, for the shares
- Exited the Naked Wines (OTCQX:NWINF) position for reasons discussed later in this letter
- Added to the Warner Brothers Discovery (WBD) position due to extreme pessimism reflected in the stock price

- White: thesis is tracking roughly in-line with my base case
- Orange: thesis is tracking somewhat below my base case
- Red: thesis is tracking significantly below my base case
- Dull Green: thesis is tracking somewhat better than my base case
- Bright Green: thesis is tracking significantly better than my base case

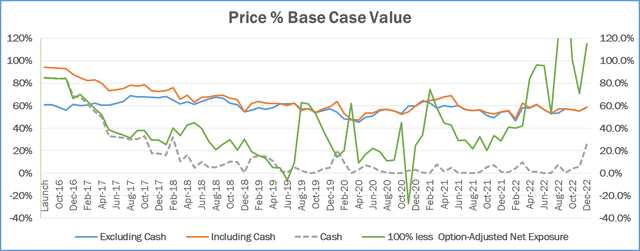
- The portfolio was attractively priced at 59% of Base Case value at the end of December 2022
- Option-adjusted net exposure was at -15%, reflecting option-based hedges.
- Excluding the inflation hedges, option-adjusted net exposure would have been 6%
- The cash in the portfolio isn’t a reflection of market timing, but rather a temporary residual of the bottom-up investment process
Operations Update
- I expect the K-1s to once again be available by mid-March.
- I switched the fund’s legal counsel from WilmerHale to Koley Jessen. The partner that I worked with at WilmerHale left to go in-house, and I didn’t see a reason to continue to work with such a giant legal firm given the simplicity of the partnership’s legal needs.
Portfolio Update
Searching For Investment Ideas
I spent a good portion of the last few months systematically looking for new ideas. In particular, I decided to rebuild, from scratch, the global sub-universe of companies to be my hunting ground for attractive investments.
My criteria, which I will expand on below, were as follows:
- Economic Profits which were positive and either flat or rising over time
- Free Cash Flow that averaged over 60% of Net Income over a 10 year period
- Countries where I judged there to be strong rule of law and relatively free market economies
- Industries which don’t necessitate forecasting macro-economic variables as the major consideration
- Sufficient liquidity in the company’s stock
Economic Profits
Economic Profit (EP) = (Return on Invested Capital – Cost of Capital) x Invested Capital. What makes this a better metric, especially when gauged over time, than Return on Invested Capital (ROIC) alone? A company can have rising economic profits even if its ROIC is falling, and that would still be a positive scenario from the perspective of the owners of the business.
Consider a company that has a cost of capital of 8% and an ROIC of 20%. Let’s say it has $100 invested, so EP = (20% – 8%) x $100 = $12. Now, let’s say that it invests another $1,000 at a ROIC of 10%. The new EP would be the old $12 plus (10% – 8%) x $1000 = $12 + $20 = $32. So EP more than doubled, whereas ROIC almost got cut in half.
A chart of EPs over time can in one picture tell you quite a bit about a business. Businesses where Return on Invested Capital is meaningfully greater than the Cost of Capital aren’t all that common to begin with. Among this subset, there are many businesses which have above-average ROIC that lack the ability to reinvest capital in the business at attractive rates. A smaller proportion of these companies do possess attractive reinvestment economics, and those are going to be the ones with rising EPs over time.
Economic profit is susceptible to mistakes of omission. That is because some very good businesses are reinvesting in growth with attractive economics via their income statement. For example, a company growing subscribers might be adding economically profitable subscribers at a high Subscriber Acquisition Cost (SAC), which is expensed at the time the customer is acquired even though the customer might provide revenues for a number of years. So accounting rules in this case would hide the true growth in EP or even show an accounting loss. This isn’t so much a flaw of the EP calculation as an accounting flaw where the SAC is not capitalized and amortized over the economic life of the subscriber as would make more sense to match the timing of costs with the timing of revenues.
So while excluding companies without positive and flat/rising EPs could lead to some mistakes of omission, it does include only economically attractive businesses in our consideration set. Given that there are plenty such businesses, I would rather err on the side of excluding a few that are deserving rather than mistakenly include those that aren’t.
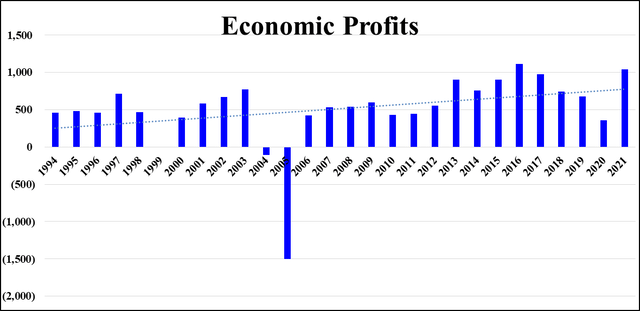
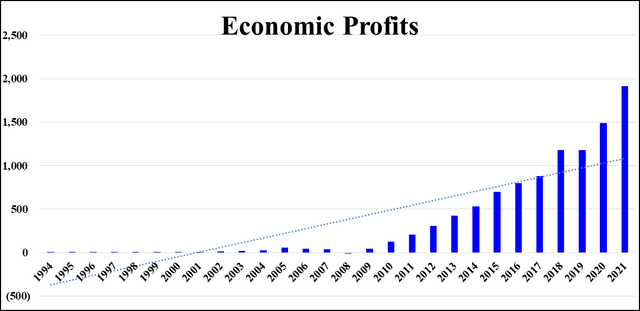
A picture is worth a thousand words. So below are two examples of the types of companies that I am including based on this consideration. The first company has positive but mostly stable EPs. The second has positive and rising EPs – the financial fingerprint of what some investors call a “compounder.”
Here is a chart of a company with strong, but stable, economic profits:
And here is what chart of a “compounder” looks like:
Free Cash Flow (FCF)
The reason for setting the 60% threshold of FCF as a % of Net Income over a decade is that it helps avoid companies with accounting shenanigans and outright frauds. For a business that is growing at modest to above-average levels FCF and Net Income shouldn’t be too far apart. FCF also gives companies optionality and usually means they can handle adversity better.
Of course, the downside of this requirement is that it also incorrectly eliminates some companies that are legitimately investing in their growth. In my experience this isn’t a large enough number of companies for the cons to outweigh the pros.
Countries
I limited the countries to U.S., Canada, Australia, New Zealand, UK and the majority of the countries in Europe. While we can argue the degree to which markets are fully free in some of those countries, they are mostly free. I don’t want to be in the business of trying to guess how the government is going to behave in various situations, especially if it can be a deciding factor in the success of an investment.
That is one reason why you don’t see countries like China on the list. Many smart investors are comfortable investing there. That’s great for them, but I am not. For me, it’s just in the “too hard” pile.
There are also some countries which I may add to the list over time, such as Japan, South Korea and India, but at this time I lack enough knowledge about them to feel comfortable investing there. There are important differences, including with respect to how capital is allocated, and I don’t yet feel comfortable investing there.
Industries
My expertise is micro economic analysis. So I want industries where it’s my analysis of industry and company-specific factors that provides the key insights. For that reason I eliminated companies whose economic outcomes are predicated upon the price of oil or natural gas.
Never say never, as it’s certainly possible to have extreme security prices in those areas or other unique circumstances, but as a general rule I don’t have any thoughtful way to estimate the long term price of oil or gas. Many well-known value investors invest in these companies. That’s fine, but I have also seen many experience permanent capital loss, some more than once, when all of their company-specific analysis gets overwhelmed by macro factors.
I have also excluded levered financials such as banks from the consideration set. I tried investing in them earlier in my career and never fully got comfortable with them. I know some experts who are quite good at figuring out the good from the bad in this area. I will leave it to them.
Liquidity
I wrote in the last letter about my focus on managing liquidity risk. That doesn’t mean never having illiquid positions, but rather limiting them in size both individually and in the aggregate. So for the purpose of this exercise I eliminated any investment where I couldn’t reasonably expect to buy shares without meaningfully disturbing the price in less than 20 trading days.
The Hunting Ground
Lest you think that all of my criteria narrowed the universe to just a small handful of companies, that’s not the case. Having started with over 10,000 companies I ended up with about 1,000. That’s still a very broad set to choose from given that our portfolio will typically have 10 to 20 investments.
Slightly more than half of this list is from the U.S. The median market capitalization is about $4B and ranges from micro-cap companies to mega-cap companies. All have attractive economic characteristics as measured by returns on capital and free cash flow. It’s possible that I will eliminate some from this list due to qualitative considerations down the road. However, it’s a pretty good starting point.
I am not restricting myself to investing solely from this list. There will be special situations which don’t fit these characteristics but where there are unique opportunities to make attractive riskadjusted returns. However, this is intended to be my normal hunting ground where I look for opportunities.
Zooming out from the nitty-gritty details, this list represents my preferences as an investor well. Some investors believe that there is an attractive price for any stock. That’s fine, but I have learned over my 20+ years of experience that quality matters a lot. On the other side of the spectrum there are investors who demand such a high level of quality and growth that they are only choosing from 50-100 possible investments. I understand their reasoning but don’t agree. I believe the list that I have put together pays due homage to business quality while still leaving enough breadth to optimize our chances of finding deeply undervalued securities.
The Hunt
I then spent quite a bit of time going through this list, one company at a time. I was looking for an attractive combination of two factors:
- Free Cash Flow Yield (FCF/Market Capitalization), as measured by using a trailing 7-10 year period and adjusted at a reasonable growth rate to a forward 12-month basis
- Growth in Economic Profits and Free Cash Flow over time
A “compounder” that is able to grow Economic Profit meaningfully via attractive reinvestment economics clearly is more valuable than a business with a high but stagnant level of Economic Profits. So the minimum FCF yield that I am willing to consider a compounder interesting enough to merit further work is lower.
There is also no mathematical minimum for the FCF yield for a stock to be undervalued, in theory. A stock trading at a 2% FCF yield might be very much undervalued and one trading at 10% might be overvalued. However, there is a practical limit to my comfort zone in most cases. A company at a 2% FCF yield requires you to be much more confident about forecasting the distant future for the business than a 5% yield.
As a result, in practice I rarely look at companies at a higher than 4% FCF yield. I acknowledge that undervalued securities exist in the area that I am intentionally passing on, but given the importance of mental comfort in investing, I will leave those opportunities to others.
The Results
After a thorough effort, I was able to narrow down the list to about a dozen potentially interesting candidates. That is a pretty small number, about 1% of the list, and I believe it speaks to the still fairly optimistic security prices in the capital markets. Interestingly, two thirds of these were from outside the U.S.
The next steps is to dig in deeper into these companies and narrow the list to 2-4 most promising candidates, and if we are fortunate to find a couple of attractive actionable investments. I hope to be able to report to you on this effort in my next letter.
Portfolio Activity
In December, Freshii received an all-cash take-over offer of CAD 2.30 from Foodtastic, representing a ~ 130% premium to the prior closing price. More importantly, I believe that it’s a fair offer given the challenges that the company is going through. I sold our shares given the liquidity event and the fairly narrow spread to the offer price.
While we ended up making a small profit on our investment, this was clearly an unsuccessful investment for the partnership. The lack of success is due to 1) my mistakes in analyzing the situation and 2) the subsequent impact on the business due to COVID. Of the two, I believe the former to be the larger contributor.
When I initiated the investment, Freshii was already in turnaround mode. Its same-store sales were declining, despite a healthy economy. It had suffered from overly rapid expansion, poor quality of franchisees and poor logistics in the new markets into which it had expanded.
I had written before on the best way to invest in turnarounds – after the key operating indicators have turned, showing the turnaround is moving in the right direction. In this case, I had ignored my own advice. Why? A combination of a really cheap stock, a founder with a meaningful stake in the business, and a pristine balance sheet with a large cash cushion.
In the end, those factors proved insufficient. COVID certainly exacerbated the problems given that a good portion of the business was dependent on the urban lunch business driven by people who worked in downtown areas. However, it’s not clear that the business would have turned around even in the absence of the pandemic.
Cash, while a nice cushion, also began to decline in the most recent quarters. So the lesson for me is clear – listen to my own insights and don’t invest in turnarounds unless there are already indicators of a turn in key performance metrics.
All of that being said, to have a mistake result in a small gain is a pretty decent outcome. Obviously not all mistakes will lead to gains – some will result in losses. In general, the partnership’s results will be driven by a combination of the percentage of investments that I get right and the asymmetry between the gains on the winners and the losses on the losers.
So the silver lining here is that our focus on margin of safety and valuation discipline did its job – a mistake didn’t lead to a loss of capital. That is the whole point of margin of safety – we want to have the cushion for things to go worse than we had expected and still avoid permanent capital loss.
The TL;DR version is that I spent 6+ months buying the most expensive $20 bottles of wine in the world. If we were to amortize our losses on this investment per bottle, I would have been far better off just buying First Growth Bordeaux.
The original investment thesis was predicated on the following points:
- Competitively advantaged business model with economies of networks from connecting niche wine makers with customers at a lower price to each party
- Aligned and competent management
- Pristine balance sheet with net cash and no debt
- Large addressable market, especially in the U.S.
- Stock that was meaningfully undervalued due to market participants overreacting to cyclical weakness in demand stemming from post-COVID reopening temporarily reducing demand for at-home wine consumption
Since I last wrote to you about Naked Wines, the following information has either come to light or become clear to me:
1.) It is hard for the company to demonstrate its value proposition to its customers. This is in part responsible for its low returns on marketing spend and its inability to develop a good marketing funnel outside of its mailed discount coupons.
I do believe the value proposition is there – the business model removes unnecessary markups and allows consumers to buy decent wine cheaper. However, unlike some other models based on passing through of lower costs (e.g. Costco), it’s much harder for the consumer to see the value. This is because when they walk into a Costco and buy something, they know it’s cheaper than the same thing elsewhere. The value proposition is clear. On the other hand when buying a bottle of wine that’s not sold elsewhere, it’s much harder to demonstrate to the consumer that it’s a much better deal than the alternatives as there is no direct comparator.
One chart that the company recently released is how its customer retention doesn’t increase all that much the longer a customer has been with the company. That is a negative sign. In theory, if the value proposition is great, customers who have been with the company for 5+ years should be much more loyal and less likely to churn than those who have only been there for a couple of years. “To know them is to love them” if you will. That is not what the data in the following chart shows given the very small improvement in retention as a function of customer tenure:
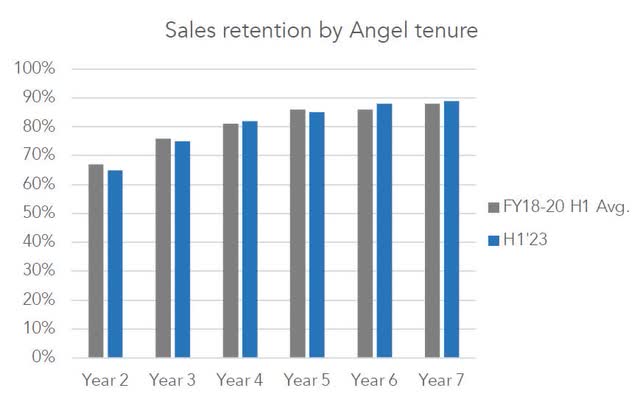
Source: Company H1 2023 Presentation
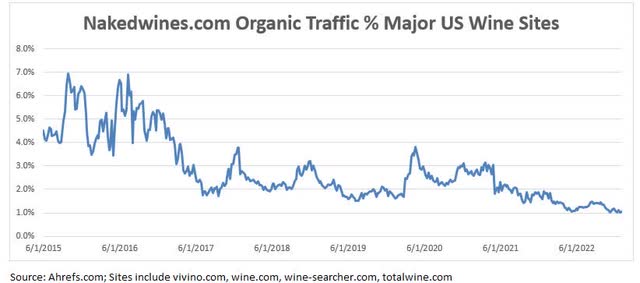
2.) The company has a meaningful competitive disadvantage in the organic reach of its U.S. website vs. major competitors. What’s more, that disadvantage is getting worse, not better. The company hasn’t shown that it can fix that, compounding its problems with building a cost-effective top-of-funnel marketing system. NakedWines.com appears to have organic traffic that’s roughly 1/5th that of Wine.com and 1/15th that of Vivino.com.
3.) The balance sheet is not as pristine as its net cash position would suggest. Given the company’s funding of its wine makers’ inventory, if there were a severe recession the company could easily run into funding trouble and require external capital. Management has negotiated a credit line that it thinks will be sufficient, but the company hasn’t gone through a real consumer recession in its history. In other words, whether intrinsic value might be diluted or not is likely a function of things outside of the control of the management team.
4.) There have been a number of management-related developments that have not, shall we say, shown them in their best light. This doesn’t mean that they are bad or that there is necessarily something sinister afoot, but they haven’t painted themselves with glory in 2022:
-
- Unforced errors in communicating with shareholders, such as going radio-silent after a period of being easily available and bungling communication with the markets (e.g. pre-announcing a pre-announcement, the first time I have seen this in 20+ years as a public market investor)
- Firing of the CFO (probably the right move, but never a great sign)
- The board member representing the largest investor quitting the board after well under a year on the board. Given that this is a shareholder who is a rational value investor, that’s particularly troubling
- The chairman resigning after “visiting” the board for about a year
I have no problem holding investments through adversity. If anything, I am frequently guilty of holding on for too long. However, in this case the problems are many and directly contradict the main points of my original investment thesis. Yes, I might look like a fool twice if it turns out that management can overcome all of these issues and restore the company on a path of growth, or if someone comes along and buys the company, which I admit is possible.
However, I have to make decisions based on the information that I have at the time. On that basis, there was material evidence that my thesis was no longer correct and I sold our shares during Q4. I plan on following the company, and am open to coming back to it, even at a higher price, if the fundamental concerns are addressed, since I think that at its core the business model makes economic sense for consumers and for wine makers.
Performance Discussion and Analysis
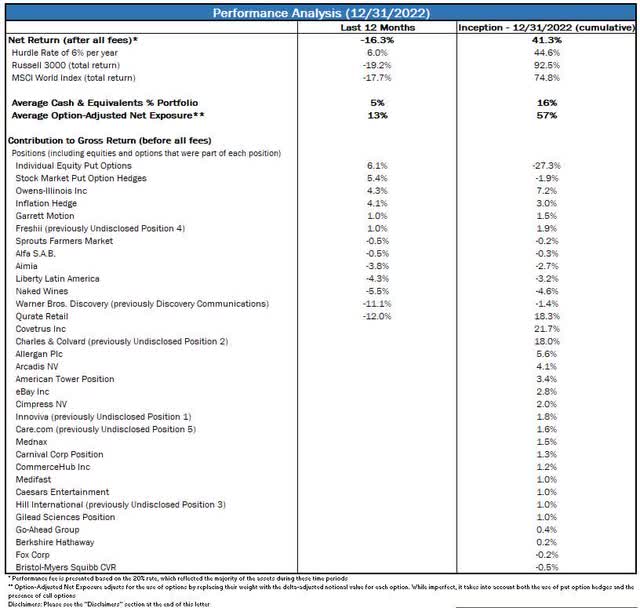
I encourage you to consider the results summarized below in conjunction with both the investment thesis tracker as well as the discussion of the individual companies in this letter. Any investment approach that is judged over less than a full economic and market cycle is liable to appear better than and worse than it really deserves at different points. Ultimately, it is the quality of the investment process and the discipline with which it is implemented that determines the long-term outcome. Therefore, I strongly encourage you to focus on process over outcome in the short-term.
Your Questions
As I have committed to do in the Owner’s Manual, I will use these letters to provide answers to questions that I receive when I believe the answers to be of interest to all of the partners. This quarter I received one question that I wanted to answer for everyone’s benefit. Please keep the questions coming; I will do my best to address them fully.
Can you please provide your in-depth investment thesis on Naked Wines?
Yes, please see the previous section of this letter.
Portfolio Metrics
I track a number of metrics for the portfolio to help me better understand it and manage risk. I track these both at a given point in time, and as a time series to analyze how the portfolio has changed over time to make sure that it is invested in the way that I intend for it to be. Below I share a number of these metrics, what each means, and what it can tell us about the portfolio. As time passes, you should be able to refer to these charts and graphs to help you gain deeper insight into how I am applying my process.
Price % Base Case Value
This metric tracks the portfolio’s weighted average ratio between market price and my Base Case intrinsic value estimate of each security. This ratio is presented both including cash and equivalents, which are valued at a Price to Value of 100%, and excluding those. All else being equal, the lower these numbers are, the better. Excluding cash and equivalents, a level above 100% would be a red flag, indicating that the portfolio is trading above my estimate of intrinsic value. Levels between 90% and 100% I would characterize as a yellow flag, suggesting that the portfolio is very close to my estimate of value. Levels between 75% and 90% are lukewarm, while levels below 75% are attractive.

Quality Quintiles
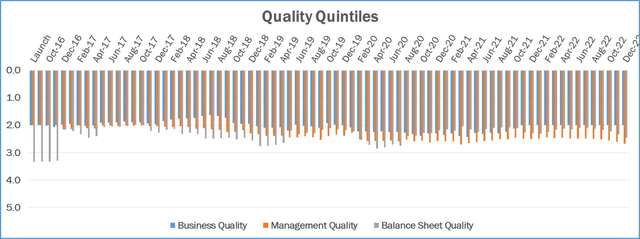
As outlined in the Owner’s Manual, I evaluate the quality of the Business, the Management and the Balance Sheet as part of my assessment of each company. I grade each on a 5-point scale with 1 meaning Excellent, 2 Above Average, 3 Average, 4 Below Average and 5 Terrible. The chart that follows presents the weighted average for each of the three metrics for the securities in the portfolio.
Portfolio at Risk ((PaR))
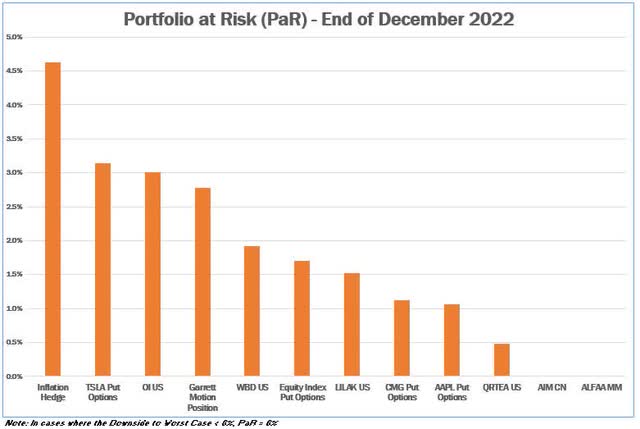
I estimate the Portfolio at Risk of each position by multiplying the weight of each position in the portfolio by the percent downside from the current price to the Worst Case estimate of intrinsic value. This helps me manage the risk of permanent capital loss and size positions appropriately, so that no single security can cause such a material permanent capital loss that the rest of the portfolio, at reasonable rates of return, would not be able to overcome. I typically size positions at purchase to have PaR levels of 5% or lower, and a PaR value of 10% or more at any time would be a red flag. The chart below depicts the PaR values for the securities in the portfolio as of the end of the quarter. Positions are presented including options when applicable.
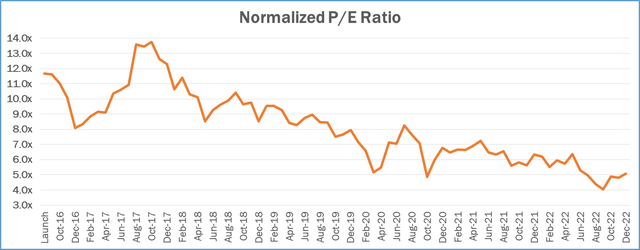
Normalized Price-to-Earnings (P/E) Ratio
I supplement my intrinsic value estimates, which are based on Discounted Cash Flow (DCF) analysis, with a number of other metrics that I use to make sure that my value estimates make sense. One of the more useful ones is the Normalized P/E ratio. The denominator is my estimate of earnings over the next 12 months, adjusted for any one-time/unsustainable factors, and if necessary adjusted for the cyclical nature of the business to reflect a mid-cycle economic environment. The numerator is adjusted for any excess assets (e.g. excess cash) not used to generate my estimate of normalized earnings. One way to interpret this number is that its inverse represents the rate of return we would receive on our purchase price if earnings remained permanently flat. So a normalized P/E of 10x would be consistent with an expectation of a 10% return. While the future is uncertain, it is typically my goal to invest in businesses whose value is increasing over time. If I am correct in my analysis, our return should exceed the inverse of the normalized P/E ratio over a long period of time. The graph below represents the weighted average normalized P/E for the equities in the portfolio.
Conclusion
I couldn’t resist. I went down the ChatGPT rabbit hole.
Prompt: Make a poem about the Federal Reserve being indecisive, markets, interest rates, and the economy using Shakespearean style
ChatGPT: “Here is a poem about the Federal Reserve being indecisive, markets, interest rates, and the economy in Shakespearean style:
The Federal Reserve, a mighty force
In charge of markets, interest, and discourse
But when indecision doth rear its head
The markets tremble, the economy dead
For when the interest rates doth fluctuate
The markets quake, their fate uncertain
Businesses suffer, investors irate
As the economy doth experience a curtain
But fear not, dear reader, for all is not lost
For the Federal Reserve doth wield great power
To stabilize markets, economy engrossed
And in the end, prosperity shall flower
So let us watch and wait, with patience and care
As the Federal Reserve doth its job ensue
For in the end, prosperity we’ll share
And the economy, it will renew.
Not bad, and seems kind of on point. However, when exactly the economy will be renewed, to quote the AI-bard, is not at all clear. It never is. So I continue to invest our capital with caution, for a range of possible scenarios ranging from a severe recession accompanied by a market rout to a quick return to healthy economic activity.
The way to become briefly famous is to pontificate on one strong directional view for the markets or the economy. There are a number of people out there doing that. If their view happens to play out, they can lay their claim to fame of being a market seer. Never mind that some of these folks have predicted 15 of the last 2 bear markets or see a new bull market every year.
The way to manage risk is to assume that we don’t know for sure how the world is going to develop, but that we need to ensure that no matter the path, we do at least alright with our capital over the long-term. That doesn’t win you fame, but that’s what real risk management is all about.
I am happy to answer any questions that you have. Your feedback is important to me; please let me know how I can improve future letters. I greatly appreciate your trust and support, and I continue to work diligently to invest our capital.
Sincerely,
Gary Mishuris, CFA, Managing Partner, Chief Investment Officer
IMPORTANT DISCLOSURE AND DISCLAIMERSThe information contained herein is confidential and is intended solely for the person to whom it has been delivered. It is not to be reproduced, used, distributed or disclosed, in whole or in part, to third parties without the prior written consent of Silver Ring Value Partners Limited Partnership (“SRVP”). The information contained herein is provided solely for informational and discussion purposes only and is not, and may not be relied on in any manner as legal, tax or investment advice or as an offer to sell or a solicitation of an offer to buy an interest in any fund or vehicle managed or advised by SRVP or its affiliates. The information contained herein is not investment advice or a recommendation to buy or sell any specific security. The views expressed herein are the opinions and projections of SRVP as of December 31st, 2022, and are subject to change based on market and other conditions. SRVP does not represent that any opinion or projection will be realized. The information presented herein, including, but not limited to, SRVP’s investment views, returns or performance, investment strategies, market opportunity, portfolio construction, expectations and positions may involve SRVP’s views, estimates, assumptions, facts and information from other sources that are believed to be accurate and reliable as of the date this information is presented—any of which may change without notice. SRVP has no obligation (express or implied) to update any or all of the information contained herein or to advise you of any changes; nor does SRVP make any express or implied warranties or representations as to the completeness or accuracy or accept responsibility for errors. The information presented is for illustrative purposes only and does not constitute an exhaustive explanation of the investment process, investment strategies or risk management. The analyses and conclusions of SRVP contained in this information include certain statements, assumptions, estimates and projections that reflect various assumptions by SRVP and anticipated results that are inherently subject to significant economic, competitive, and other uncertainties and contingencies and have been included solely for illustrative purposes. As with any investment strategy, there is potential for profit as well as the possibility of loss. SRVP does not guarantee any minimum level of investment performance or the success of any portfolio or investment strategy. All investments involve risk and investment recommendations will not always be profitable. Past performance is no guarantee of future results. Investment returns and principal values of an investment will fluctuate so that an investor’s investment may be worth more or less than its original value |
Editor’s Note: The summary bullets for this article were chosen by Seeking Alpha editors.
Editor’s Note: This article discusses one or more securities that do not trade on a major U.S. exchange. Please be aware of the risks associated with these stocks.


Be the first to comment