

Silver, XAG/USD, Reddit, r/WallStreetBets, Physical Demand – Talking Points:
- Silver surged over 7% on the back of a Reddit-inspired buying spree.
- Overwhelming physical demand, in tandem with falling real rates and rising inflation expectations, may continue to bolster prices in the near term.
WallStreetBets Fuels Buying Spree
The price of silver surged over 7% to kick off a fresh week of trade, on the back of a Reddit-inspired buying spree. Comments on silver begin appearing on the Reddit forum r/wallstreetbets early last week, calling for a silver short-squeeze of epic proportions.
One user posted that the “Silver Bullion Market is one of the most manipulated on earth. Any short squeeze in silver paper shorts would be EPIC”, while another post on the popular forum stated that “inflation-adjusted Silver should be at $1000 instead of $25. Why not squeeze $SLV to the real physical price. Think about the Gainz. If you don’t care about the gains, think about the banks like JP Morgan you’d be destroying along the way”.
The forum is behind the remarkable surge seen in heavily-shorted stocks like GameStop and AMC, and clearly has its sights set on driving the price of XAG/USD higher. However, it remains to be seen if they will be as successful in the liquidity-rich futures market.
Nevertheless, with major retail sites overwhelmed by demand for physical silver, there is the potential that supply-demand dynamics may also bolster the precious metal. Moreover, falling real rates of return and climbing inflation expectations could see silver prices continue to push higher in the near term.
Silver Price Daily Chart – RSI Hints at Further Gains
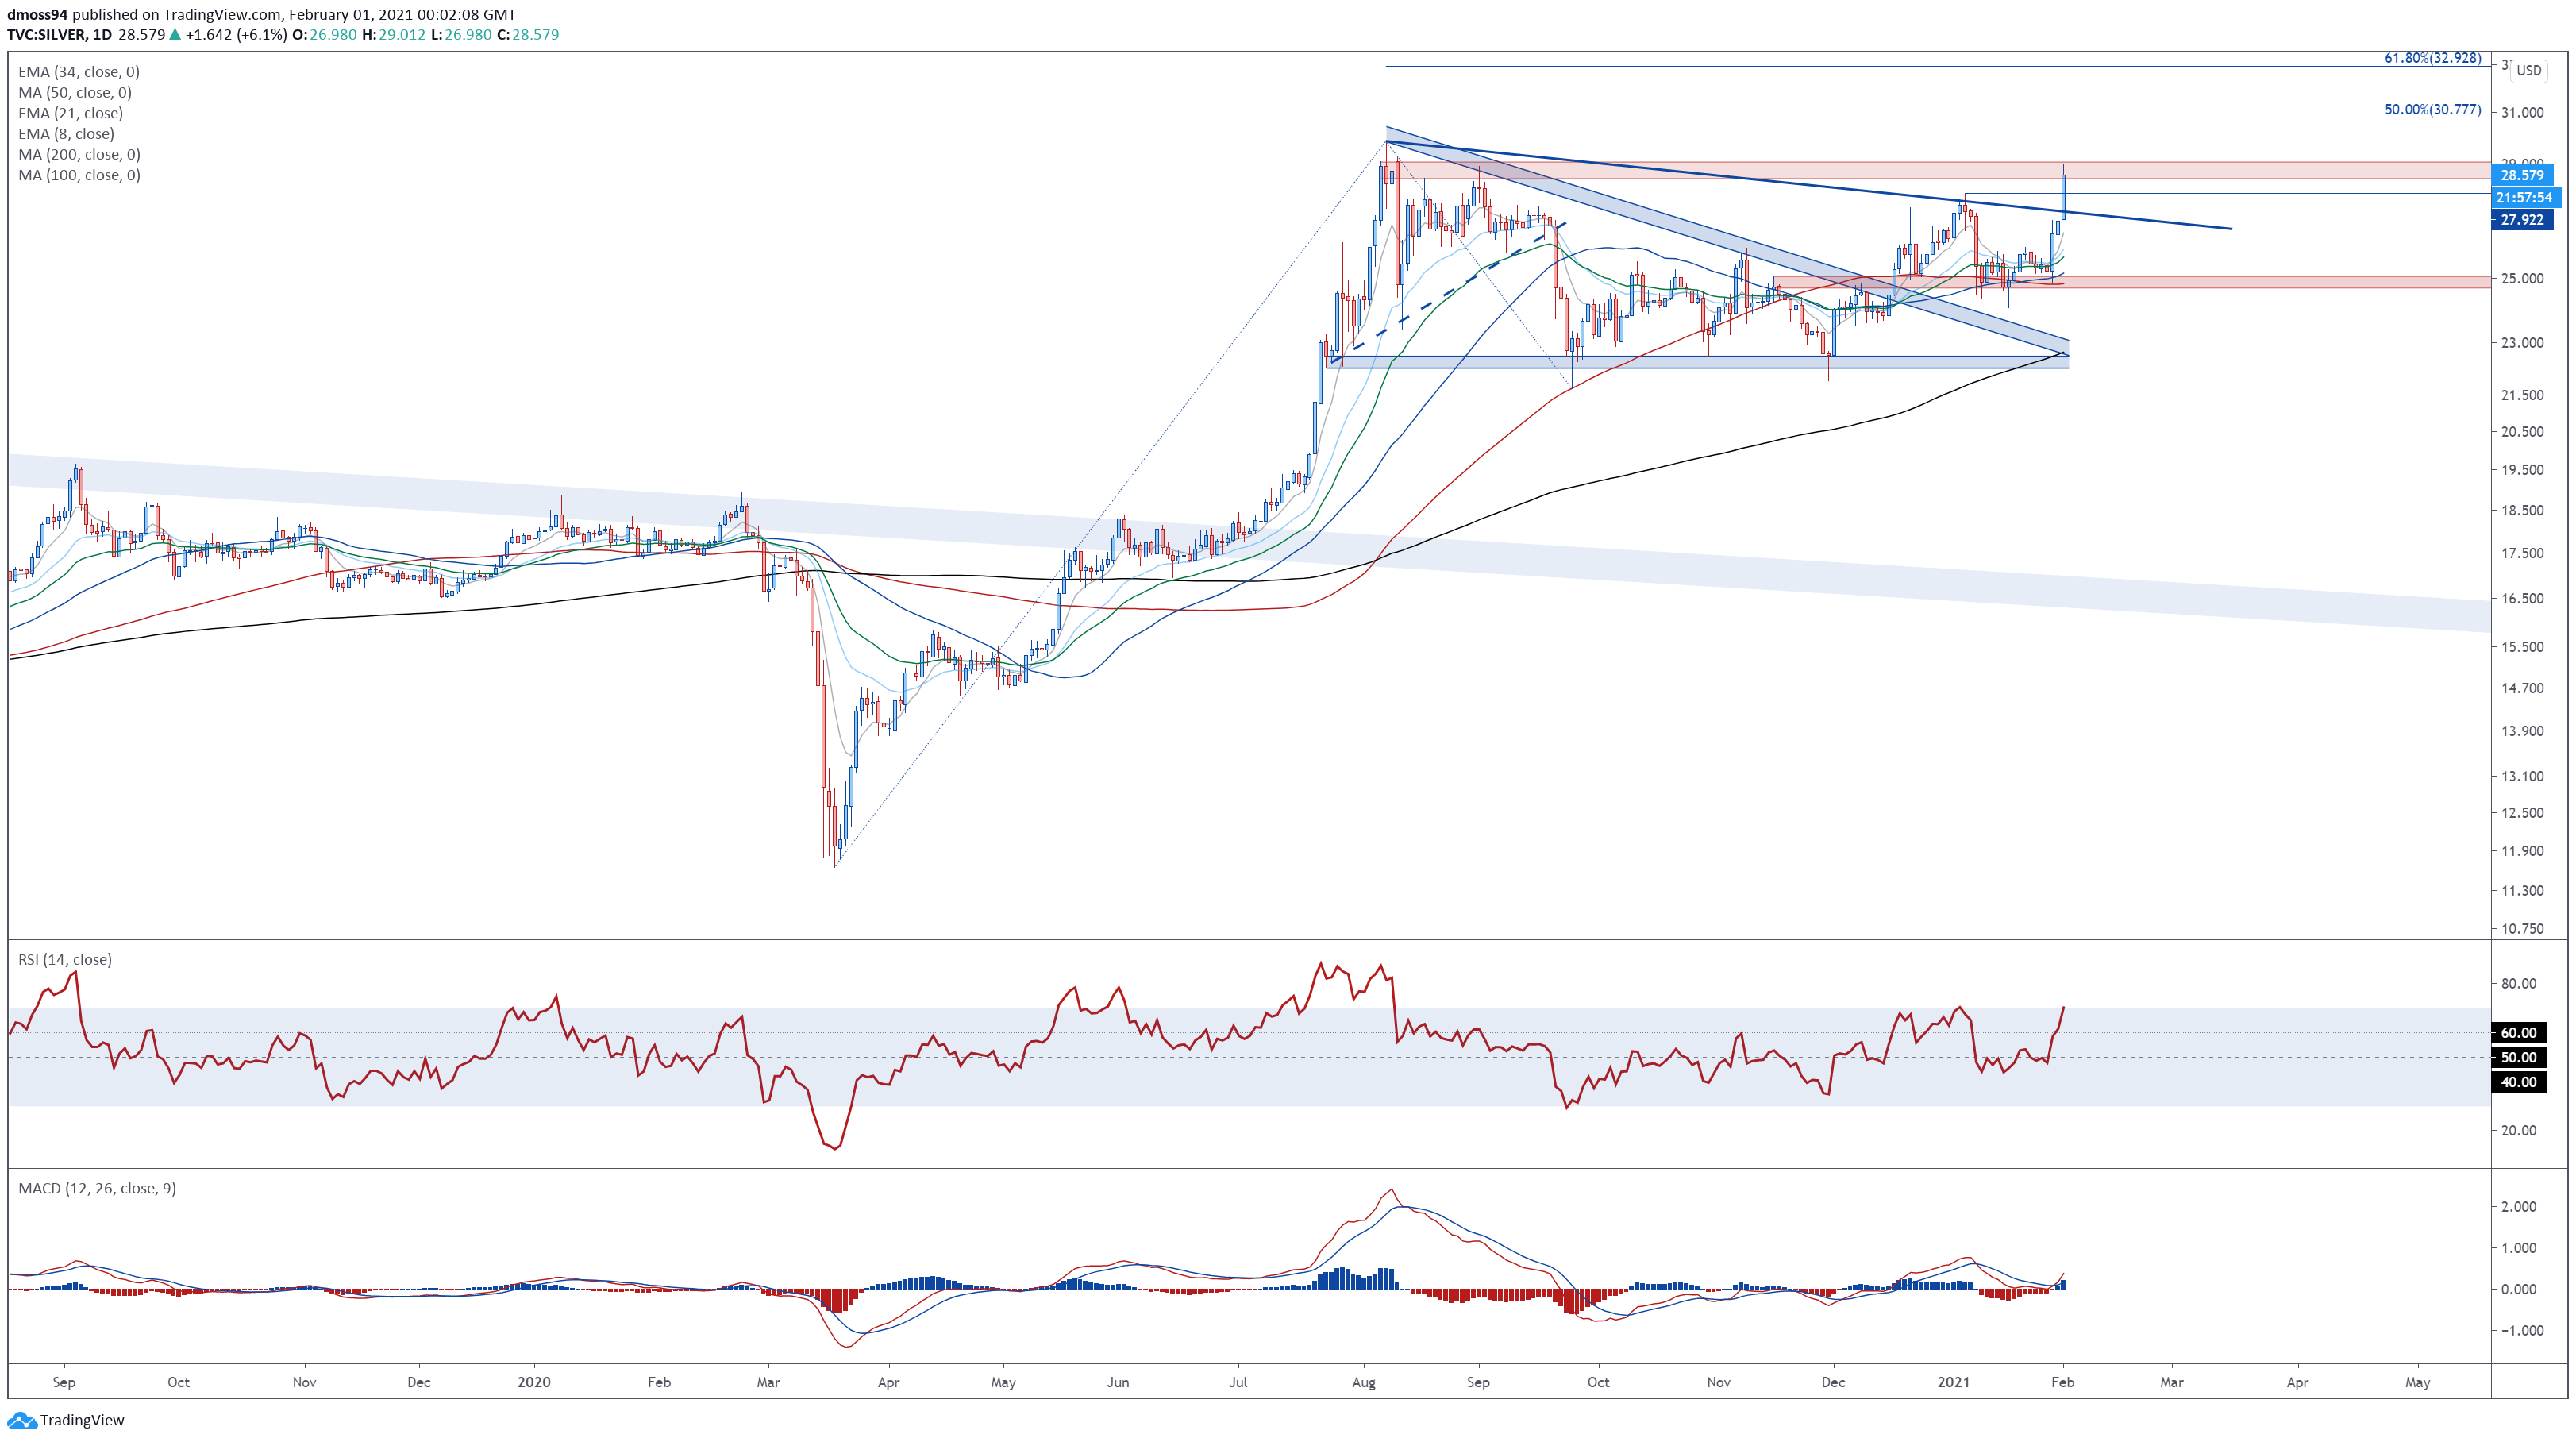
Silver price daily chart created using Tradingview
From a technical perspective, silver looks poised to extend its recent surge higher, as buyers drive the precious metal above trend resistance and the psychologically imposing $28 mark.
With the RSI eyeing a push into overbought territory, and a bullish crossover taking place on the MACD indicator, the path of least resistance seems higher.
A daily close above range resistance at 28.50 -29.10 would probably carve a path for price to challenge the 31.00 level. Breaking that likely brings the 61.8% Fibonacci (32.93) into the crosshairs.
Alternatively, failing to breach range resistance could inspire a pullback to the January 6 high (27.92). Clearing that probably opens the door for sellers to probe the 8-day exponential moving average (26.51).
— Written by Daniel Moss, Analyst for DailyFX
Follow me on Twitter @DanielGMoss

Recommended by Daniel Moss
Top Trading Lessons
Be the first to comment