

mihailomilovanovic/E+ via Getty Images
Based in the United States, Shift4 Payments, Inc. (NYSE:FOUR) is a payments processor with robust average revenue growth of 38% in the past 4 years. However, the company’s gross margins declined over the past 4 years from 25.10% in 2018 to 20.36% in 2021 despite its robust payment volume growth, with an average 3-year growth rate of 46%. Thus, we analyzed the company’s expenses, namely its network fees and cost of sales as well as take rate, to identify why its gross margins declined.
Shift4 Payments, Khaveen Investments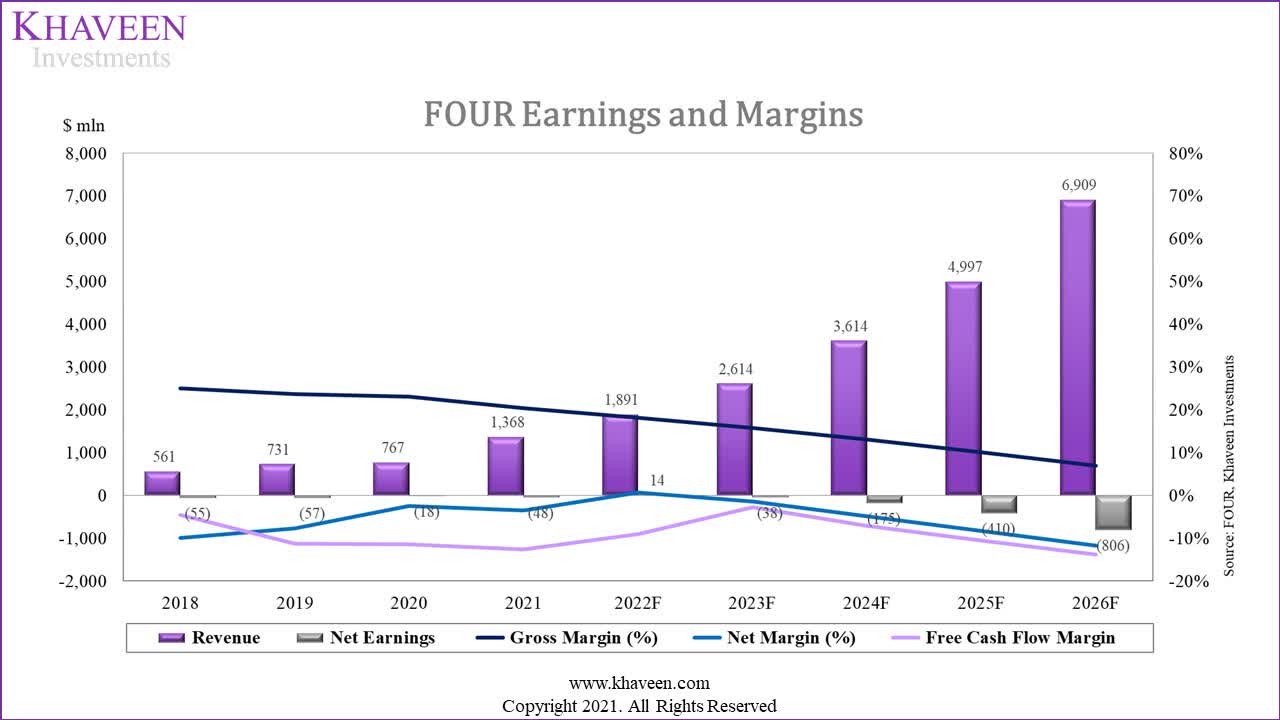
|
Shift 4 Payments ($ mln) |
2018 |
2019 |
2020 |
2021 |
2022F |
2023F |
2024F |
2025F |
2026F |
|
Gross Profit |
141 |
173 |
178 |
278 |
344 |
413 |
474 |
509 |
482 |
|
Gross Margin |
25.1% |
23.7% |
23.2% |
20.4% |
18.21% |
15.80% |
13.13% |
10.19% |
6.98% |
Source: Shift4 Payments, Khaveen Investments
Network Fee Costs
|
Shift 4 Payments Network Fees ($ mln) |
2018 |
2019 |
2020 |
2021 |
2022F |
2023F |
2024F |
2025F |
2026F |
|
Revenue |
561 |
731 |
767 |
1368 |
1891 |
2614 |
3614 |
4997 |
6909 |
|
Network Fee |
308 |
426 |
444 |
862 |
1254 |
1826 |
2658 |
3869 |
5632 |
|
Growth % |
38.3% |
4.2% |
94.1% |
45.6% |
45.6% |
45.6% |
45.6% |
45.6% |
|
|
% of revenue |
54.9% |
58.2% |
57.9% |
63.0% |
66.3% |
69.9% |
73.5% |
77.4% |
81.5% |
Source: Shift4 Payments, Khaveen Investments
In the past four years, the company’s gross margin declined from 25.1% in 2018 to 20.4% in 2021, and it decreased the most from 2020 to 2021, by 12.2%. In terms of its network fee, this is its largest expense, which accounted for 63% of its total revenue in 2021 and has increased from 54.9% in the past 4 years. Based on the company’s annual report, its network fee “includes interchange and assessment fees.” The company is registered with card networks such as Visa (V) and Mastercard (MA) to provide transaction processing services to its merchants.
When compared to its payment volume growth, the 4-year average growth rate for its network fees (45.6%) is approximately similar to the 4-years average growth for payment volume (46.5%). Thus, we believe that the network fees are a variable expense, as they grew at approximately the same rate as its payment volume growth based on its 3-year average of 45.6%. Hence, we believe this would have a neutral impact on its gross margins growing in line with its payment volumes. However, the company had stated that it could face a risk if card networks raise their fees.
Cost of Sales
|
Shift 4 Payments Cost of Sales ($ mln) |
2018 |
2019 |
2020 |
2021 |
2022F |
2023F |
2024F |
2025F |
2026F |
|
Revenue ($ mln) |
561 |
731 |
767 |
1368 |
1891 |
2614 |
3614 |
4997 |
6909 |
|
Cost of Sales ($ mln) |
111 |
132 |
145 |
227 |
292 |
375 |
482 |
619 |
795 |
|
Growth % |
18.9% |
9.9% |
56.5% |
28.5% |
28.5% |
28.5% |
28.5% |
28.5% |
|
|
% of revenue |
19.8% |
18.1% |
18.9% |
16.6% |
15.4% |
14.3% |
13.3% |
12.4% |
11.5% |
Source: Shift4 Payments, Khaveen Investments
Furthermore, besides network fees, the company also incurs other costs of sales which represented 16.6% of revenue in 2021. Based on its annual report, its other cost of sales:
consists of interchange and processing fees, residual commissions, equipment and other costs of sales.
Since 2018, its cost of sales had declined as a % of total revenue from 19.8% to 16.6% in 2021. This is as its 3-year average growth rate (28.5%) is lower than the 3-year average growth for its payment volume (46.5%), which indicates a scalable nature for its cost of sales.
Hence, we believe that due to the scalability of its cost of sales, it could improve its gross margins. We forecasted it based on its 3-year average of 28.5% in comparison to its payment volume growth which we forecasted based on its 3-year average of 46% as the company highlighted its recent client wins and the increase of its client base by 15,000 to 200,000 in 2021. Overall, we forecasted its cost of sales as a % of revenue to decline to 11.5% by 2026. However, as its cost of sales only represent 21% of its total COGS, we believe this would not have a significant impact on its gross margins.
Take Rate
Although its payment volume had an average 3-year growth of 46%, however, its revenue growth had been slower than that with an average of 38%. This is due to its take rate (revenue as a % of total payment volume) having declined in the past 4 years, from 3.5% in 2018 to 2.9% in 2021.
|
Shift4 Revenue Projection |
2018 |
2019 |
2020 |
2021 |
2022F |
2023F |
2024F |
2025F |
2026F |
|
Take Rate |
3.5% |
3.3% |
3.2% |
2.9% |
2.8% |
2.6% |
2.5% |
2.3% |
2.2% |
|
% Growth |
-5% |
-5% |
-7% |
-6% |
-6% |
-6% |
-6% |
-6% |
|
|
Revenue ($ mln) |
560.6 |
731.4 |
766.9 |
1,368 |
1,891 |
2,614 |
3,614 |
4,997 |
6,909 |
|
% Growth |
30% |
5% |
78% |
38.3% |
38.3% |
38.3% |
38.3% |
38.3% |
Source: Shift4 Payments, Khaveen Investments
As seen in the table, its take rate growth was -6% on average in the past 3 years. Furthermore, we compared the company with its competitors including Block/Square, PayPal, Adyen, and Stripe to determine its competitiveness based on its take rate.
|
Companies |
Revenue ($ bln) |
Transaction Volume ($bln) |
Take Rate |
|
Block (SQ) |
5.19 |
153.10 |
3.39% |
|
PayPal (PYPL) |
25.37 |
1,250 |
2.03% |
|
Adyen (OTCPK:ADYEY) |
6.82 |
590 |
1.16% |
|
Stripe |
12 |
640 |
1.88% |
|
Shift4 |
1.37 |
46.7 |
2.93% |
Source: Company Data, Axios, Khaveen Investments
Based on the table, the average take rate among competitors is 2.28%. Shift4 Payments has the second-highest take rate (2.93%) behind Square, whereas Adyen has the lowest (1.16%). Also, Shift4 is the smallest among competitors with the lowest revenue and transaction volume. In contrast, PayPal is the largest by revenue, having a transaction volume with 27 times greater revenue than Shift4. With one of the highest take rates among larger competitors, we believe this could be negative to the company’s competitiveness. Thus, we forecasted its take rate to continue declining based on its 3-year average growth rate of -6% to 2.2% by 2026, which is close to the industry average based on the table.
Risk: Larger Competition
|
Companies |
Revenue ($ bln) |
3-years Revenue CAGR |
|
Shift4 |
1.37 |
38.30% |
|
PayPal |
25.37 |
17.56% |
|
Adyen |
6.82 |
53.65% |
|
Stripe |
12 |
121.83% |
|
Square |
5.193 |
66.50% |
Source: Company Data, Axios, Khaveen Investments
The company competes against larger competitors in the payment processing market. We compared the company revenue and 3-year revenue CAGR where Shift4 is the smallest among all. Although Shift4’s 3-year Revenue CAGR (38.30%) is high, the growth is still lower as compared to all of its larger competitors except for PayPal with a 3-year Revenue CAGR of 17.56%. However, PayPal has an 18.43 times larger revenue as compared to Shift4.
Verdict
Overall, despite its robust payment volume growth of 46%, a neutral impact from network fees, and a positive impact from the scalability of its cost of sales, we expect FOUR’s gross margins to be compressed with its declining take rate, which is one of the highest among competitors. We forecasted its gross margins to continue declining to 6.98% by 2026 due to a lower forecasted take rate. However, we referred to the lower end of the analyst consensus price target of $38, which represents a 17% upside from the current price, as its stock had declined by 67% in the past 1 year.
Be the first to comment