

Inside Creative House/iStock via Getty Images
This is an update to our article on March 12th and this article on February 13th.
The Two Master Sentiment Indicators
We have two master sentiment indicators: one long term and one shorter term. They are composite indicators made from other, established sentiment indicators. They measure what investors are either thinking and doing. We form a composite because any one indicator always has some weakness but by using them all, you get better results. The two indicators are called the Master Sentiment Indicator (MSI) and the short-term Master Sentiment Indicator (ST-MSI).
The Master Sentiment Indicator back to 2007 (Michael McDonald)
The MSI is composed of nine indicators and is updated weekly. It’s shown in the chart above and has a history back to 2007. We’ve indicated when it went into the Green Zone with dashed arrows.
The Red and Green Zones
Whenever you see red or green colors, you know you’re at extreme sentiment readings. Green represents fear or extreme bearishness, while red represents greed or extreme bullishness.
The red and green areas are shaded a little since there’s no sudden demarcation when you enter into a zone. It would be wonderful if one number always represented a top or bottom of the market, but that doesn’t exist. There are always degrees and a top or bottom never occurs at the exact same reading.
Our ranking system puts all sentiment indicators on the same numerical scale. We call it the SK scale. The scale goes from 10 to -10. Minus 10 represents the most negative or fearful reading for that indicator while +10 is the most optimistic, greedy or bullish reading.
What do these numbers mean? A ranking between -9 and – 10 means the current reading is within 5% of the most extreme negative readings of that indicator’s history. The next band represents the next 5%, until we get the highest 5% of all historic readings, which are between +9 and +10.
This allows us to establish the degree of bullish or bearish sentiment for every indicator, combine them and graph them on the same scale.
A Closer Look at MSI
The first chart, which goes back to 2007, is a little too long-term for many investors. So the chart below presents a little closer look at the ups and downs of the indicator since 2018.
The reader must remember that this is a long-term indicator; it does not look for, or attempt to find, short term market moves. The current reading of the MSI is minus 5.2; on February 13th, it was minus 3.4.
The Master Sentiment Indicator Graphed from 2018 (Michael McDonald)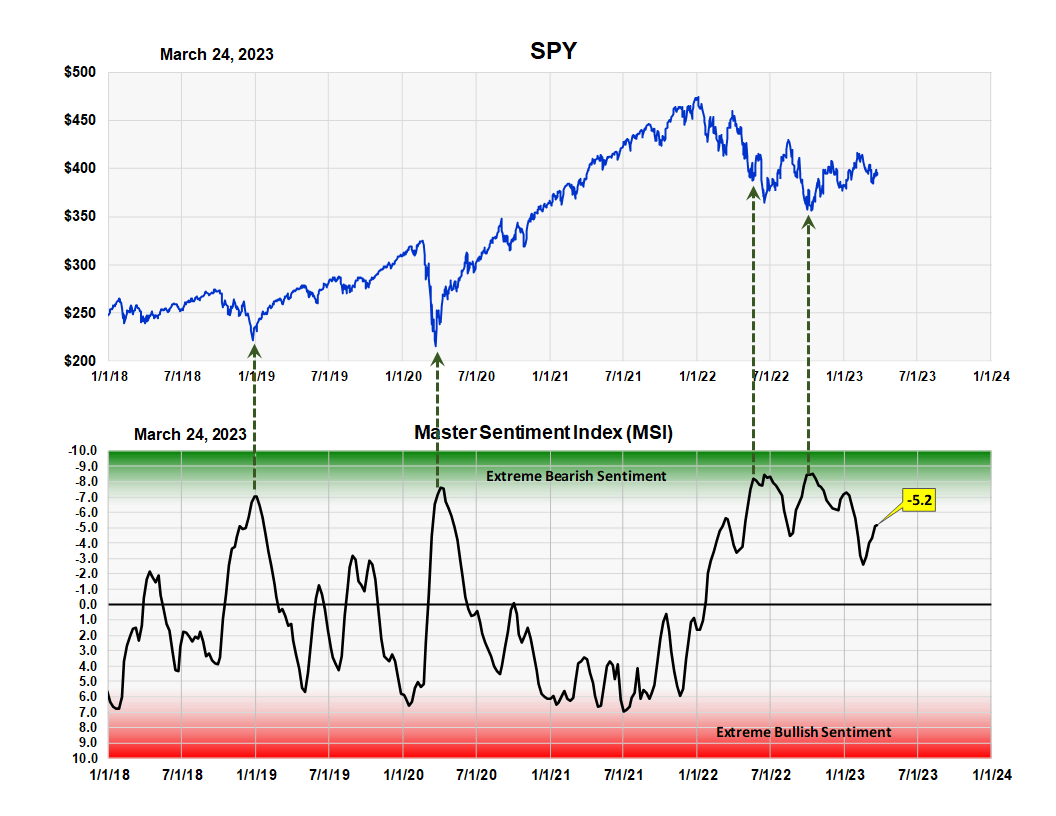
The Nine Components that Make Up the MSI
This table shows the nine sentiment indicators that go into making the MSI, and where each is on the SK ranking scale. They’re listed across the top.
Table of Sentiment Indicators that make up the MSI (Michael McDonald)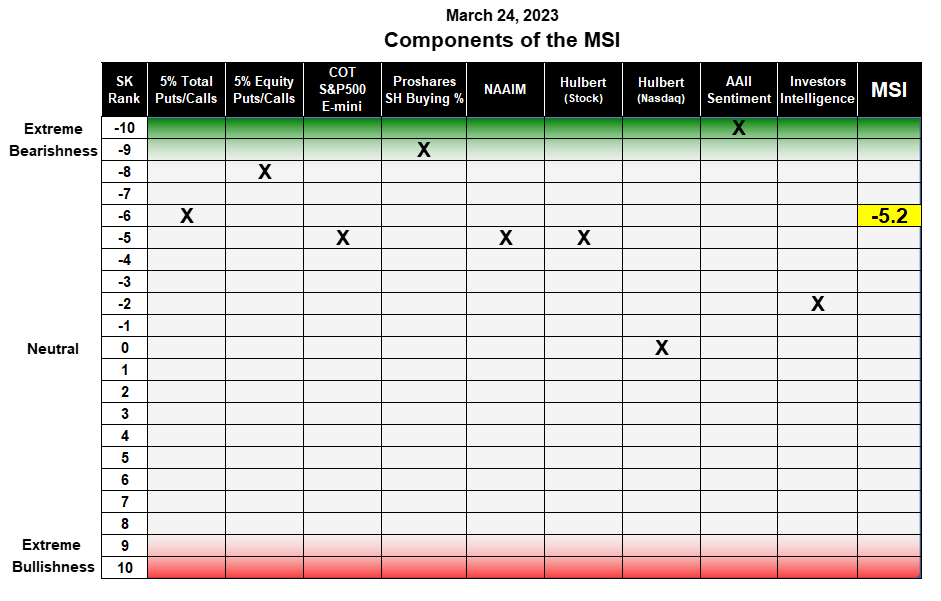
Two of them – the ProShares SH buying percent and the AAII sentiment survey – are in the Green Zone, with the 5% equity puts and calls ratio almost in the Green Zone. We use time weighted moving averages and the 5% refers to the fact that any day’s “puts to calls” ratio is reduced in importance by 5% every following day.
Most of the indicators are currently at negative numbers on the scale and only the Hulbert survey of Nasdaq newsletter writers is in the middle of the scale.
MSI Summary
Ever since the strong buy signal in mid-October, investor sentiment, as measured by the MSI, has been hovering just below the extreme bearish zone. It’s not at an extreme reading but it’s not far away either. After a buy signal like we had in October, one usually doesn’t have to worry until sentiment shift back over towards the bullish range, and we’re not anywhere near there yet. However, we do have this looming banking crisis to contend with. More on that later.
The Short-Term MSI (ST-MSI)
Our second sentiment indicator, the short-term Master Sentiment Indicator was designed to try to find short to intermediate market moves. It’s a composite indicator with seven components that are calculated daily. The graph below shows its track record back to 2010.
the ST-MSI Graphed from 2010 (Michael McDonald)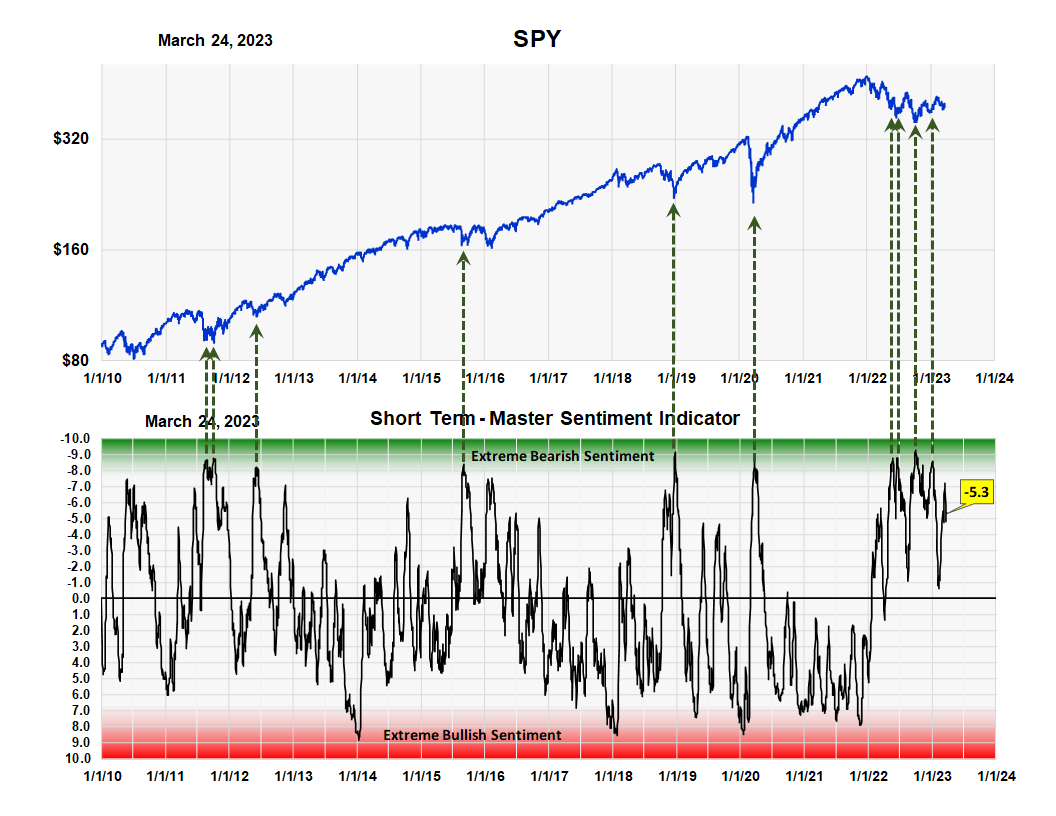
The ST-MSI fluctuates up and down more than the MSI, which it should because one’s looking for shorter term changes in investor sentiment. We’ve indicated with green arrows, like we did the MSI, times when the ST-MSI went into the Green Zone.
The current reading of the ST-MSI is minus 5.3, which almost identical to the MSI. We don’t think this has any real meaning and is just a random coincidence. Two weeks ago it was minus 6.5.
The chart below gives a closer look at the ST-MSI from 2018 to present. It’s sharp, back and forth swings on the SK ranking scale highlights its shorter term nature at measuring sentiment.
The ST-MSI graphed from 2018 (Michael McDonald)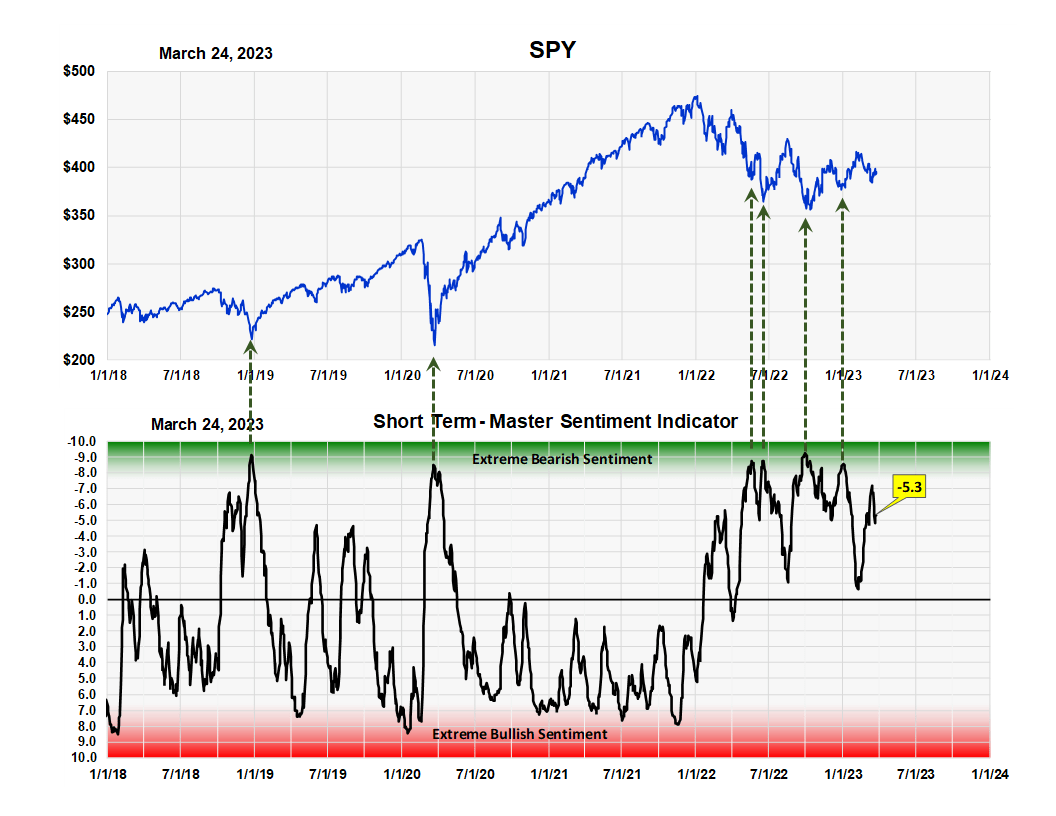
The Seven Components that Make Up the ST-MSI
This table shows the seven sentiment indicators that go into making the ST-MSI, and where each currently is on the SK ranking scale.
Table of seven Sentiment Indicators that make up the ST-MSI (Michael McDonald)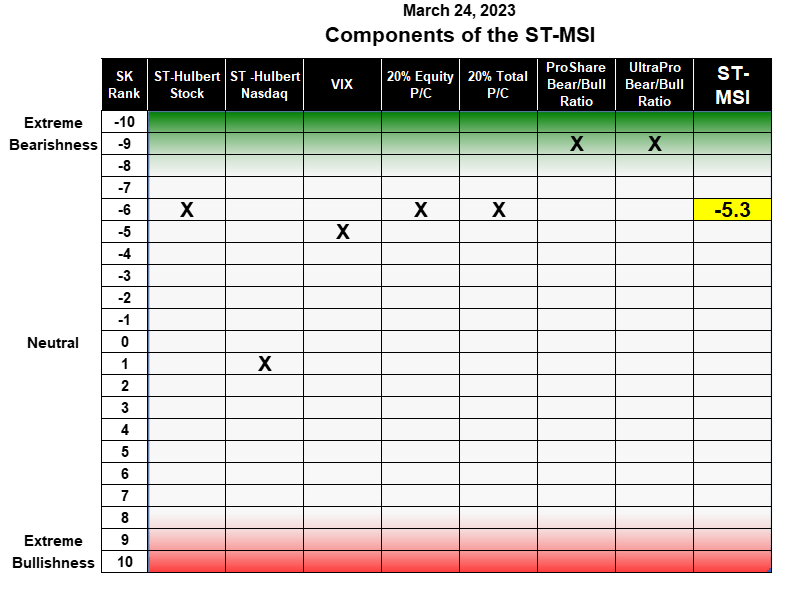
The two indicators that compare how much money is buying ProShares long funds to ProShares short funds are still in the green zone. Only our ranking of the Hulbert NASDAQ Writer survey is near the middle of the sentiment range.
Summary
Panics and crashes happen fast. It was one week between the bankruptcy of Lehman and the bankruptcy of our entire financial system. Runs on banks take place in days, not months. With confidence in our government already shaky, one misstatement by Janet Yellen could trigger a panic and a market crash. Because of this risk the treasury should simply guarantee all investor savings in all banks no matter how large. It will at least stop any capital loss that might trigger a contagion of bankruptcies. They can lift the blanket guarantee in the future once the risk of contagion is over. I think they believe a blanket guarantee itself might trigger a panic as people wonder that things must be bad if they’re doing it. But that idea is wrong; people may wonder but they won’t panic.
If we don’t have a banking panic in the next three weeks, I don’t think there will be one. Market sentiment says we should continue higher under normal conditions. But there is this three week window that contains the risk. I think investors should look for a short term asymptotic investment; one that has a constant downward bias but that will rise sharply if a crisis develops. A position that would hedge 30% to 40% of one’s portfolio. If no crisis develops over the next three weeks, it should be liquidated, and a small loss taken.
Be the first to comment