

2021 IPOs Underperform: From Boom to Bust
A bustling U.S. economy in 2021 led to a record number of Initial Public Offerings [IPOs], one of the most significant events for a company – the sale of its first share of stock. In addition, 2021 saw a real gross domestic product [GDP] surge, growing faster than any year since 1984. A strong economy and GDP sound like perfect ingredients for high-growth companies seeking financing and wanting to IPO; you’d expect a positive correlation, hence the record-setting number of IPOs in 2021.
Annual U.S. IPO Activity (FactSet)
But 2021’s IPO boom came to a screeching halt this year, as inflation and macroeconomic headwinds have been eating away at profits, and negative sentiment is moving the markets. According to FactSet data, 1073 companies IPO’d in 2021 compared to just 92 this year. After raising $317B in 2021, less than $9B was raised in 2022, a mere drop in the bucket. As recession fears mount and the U.S. stock markets endured their worst first half since 1970, Q2 of 2022 has resulted in a 0.6% fall in real GDP. Although there were upward revisions to consumer and federal spending, downward revisions on exports and private inventory investments offset the upward revisions.
Real GDP: % change from preceding quarter (U.S. Bureau of Economic Analysis (BEA))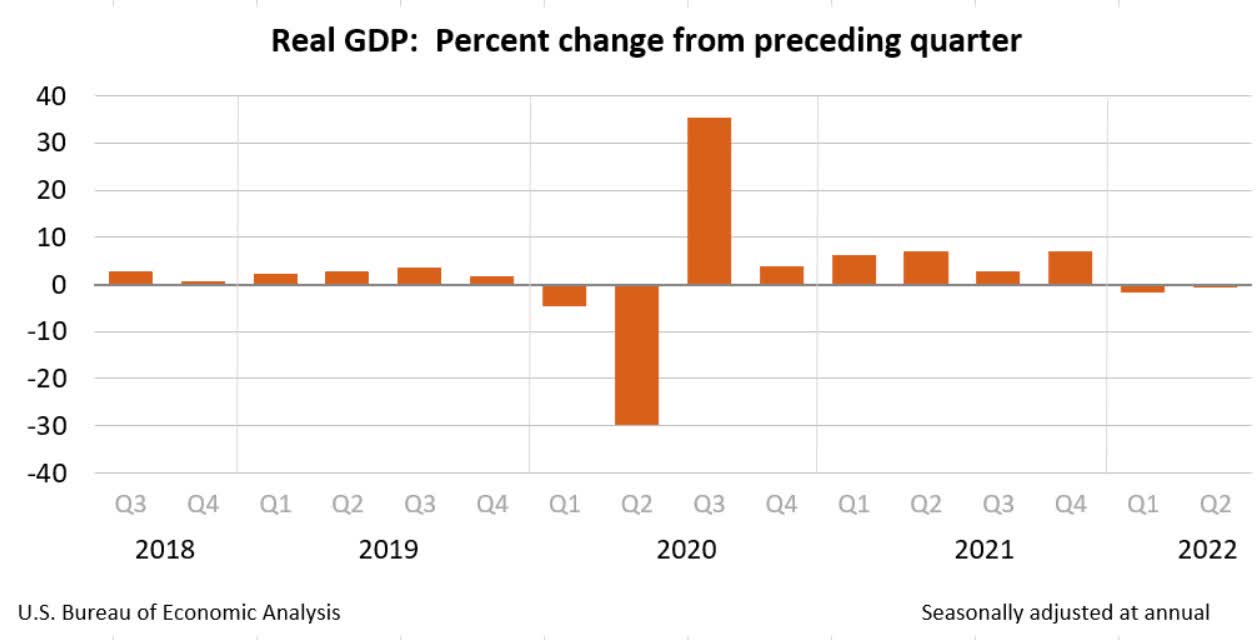
An uncertain outlook and questions surrounding Fed policy have companies strategically planning for the future, making cuts, and those that considered going IPO are taking a step back in hopes of a market rebound. Companies – and investors – that bought into 2021 IPOs and subsequently the stock amid their potential peak growth periods may not have considered that, but for the pandemic, these companies would not have otherwise been profitable. Take some of the COVID convenience stocks of 2020-2021 that became need-to-haves like DoorDash (DASH), Upstart (UPST), and Squarespace (SQSP). Each has given way to easy access to goods and services. Without the pandemic, some of the rapidly expanding businesses would likely still be private or a long way from IPO consideration. Companies like (BROS), (ZIP), (WOOF), (DOLE), (PLTR), and (RBLX) managed to expand their user bases and rode the momentum of 2020-2021 by going IPO at the top of the market or during some of their peak growth moments in time. In the current environment, these businesses have a challenging outlook. Companies that IPO tend to be in high accelerated growth mode and unprofitable; a recipe for disaster in today’s high rate and inflationary environment.
Why are IPOs unsuccessful?
Many factors affect why IPOs are unsuccessful. Where there’s leeway for private companies to operate as they wish, public companies have requirements and systems that need to be in place to sufficiently report financial information to shareholders and the Securities Exchange Commission (SEC). Not only does this require an investment of time, but the cost of going public can also be a lot to deliver, upwards of millions of dollars, according to PWC data based on the public filings of 829 companies.
PricewaterhouseCoopers (PWC) IPO Underwriting Fees (based on 829 public filings)
PricewaterhouseCoopers (PWC) IPO Underwriting Fees (based on 829 public filings) (PWC)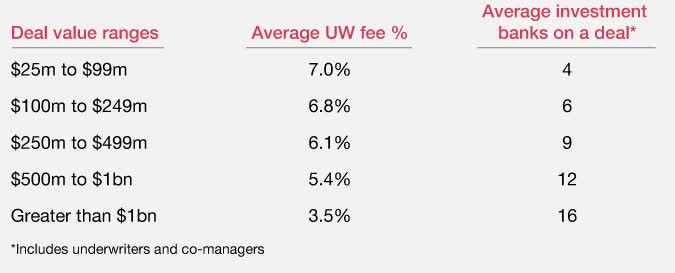
The average fees for underwriting an IPO range from 3.5% to 7% of gross IPO proceeds. Not only do these fees eat into profits, but we’re also talking about millions of dollars in some instances to go IPO that may never be recouped if the now public company never turns a profit. To put it into perspective, it took Amazon (AMZN) six years following its 1997 IPO to turn a profit, no easy feat for now behemoth. When investing in new IPO companies, the key is fundamental analysis. Seeking Alpha’s powerful computer processing performs for you and ranks stocks based upon multiple metric points to meet investors’ strategies. Let’s dive into the power of the quant ratings.
Power of the Quant Ratings
Emotional investing, or fear and greed, is moving the markets, causing volatile swings that have resulted in many investors buying at the top and selling at the bottom. Companies are beaten down, and earnings misses push stocks even lower, adding to the negative sentiment.
The 2021 stocks like BROS, WOOF, FORG, TWKS, and COOK are on a downward trend. The chart below illustrates how IPOs in Q1 of 2022 have plunged 73.1% from Q4 2021 heights, making it the weakest single quarter of IPOs since 2017.
Quarterly U.S. IPO Activity (FactSet)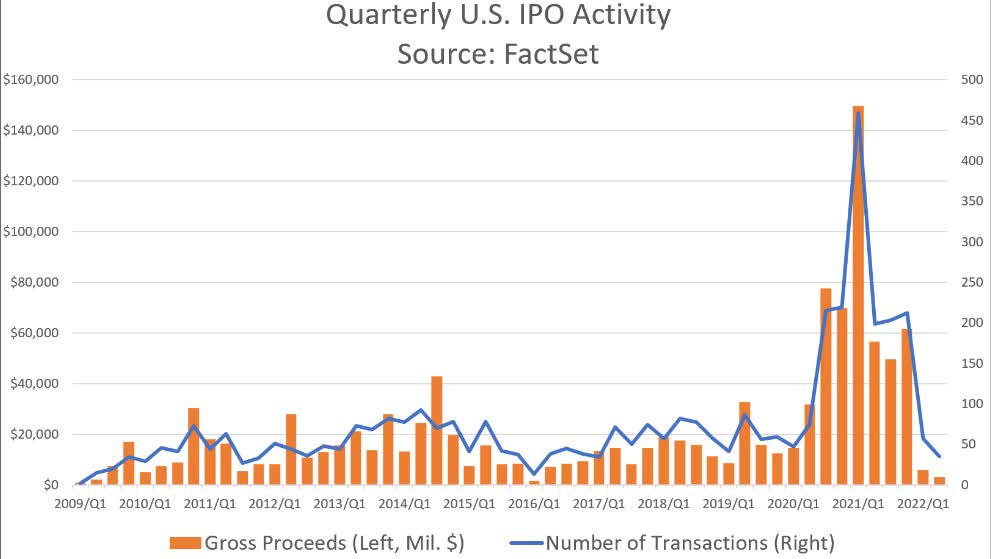
While many investors may believe there is still an upside for these unprofitable IPOs and perhaps an opportunity to buy these stocks on the dip or at lower prices, inflation is eating away at profits and taking away from companies that went public at or near peak growth. As Amanda Agati, chief investment officer at PNC Financial Services Group said,
“It really is more of a ‘slow your roll’ environment in that we have been on such a torrid pace in terms of this market rally off the bottoms of the pandemic last year…This is much more of a resetting of investor expectations about what the path forward may hold.”
The key when assessing a company’s pre-IPO and stocks is fundamental analysis. Pre-IPO investments are considered high-risk investments because they are unproven and based on speculation about their long-term prospects. Like stocks, it’s crucial to understand an investment fundamentally, and one of the key metrics is understanding its true value.
Company Valuations
When companies plan an IPO, many values themselves more than what they are worth. But the actual value of anything is simple supply and demand and what people are willing to pay. A pre-IPO company is in growth mode and raising capital to later deploy to create shareholder value. In the current environment, higher interest rates and the macro conditions influence supply, demand, and the ability to raise capital, hence the fall in IPOs and stock prices we’ve seen from 2021 to now. Unprofitable companies, especially in today’s high rate environment, have an uphill battle, as they have discounted future earnings. We like to base the quant investment strategy on highlighting companies at a reasonable price with solid growth potential.
Stock Valuation
Valuation is a critical focal point in determining a stock’s current – and projected worth – and whether the company is under- or overvalued. Using Dutch Bros Inc. (BROS) stock as an example, the rapidly growing drive-through coffee shop out of Oregon went public on September 15, 2021, raising $484M in its IPO, well above its $100M target and valuing the company at nearly $3.8B. As Seeking Alpha author Noah Wilson wrote in an article titled Dutch Bros IPO: Good Business, Not So Good Price, he was spot on regarding its price drop.
Dutch Bros Valuation Grade (Seeking Alpha Premium)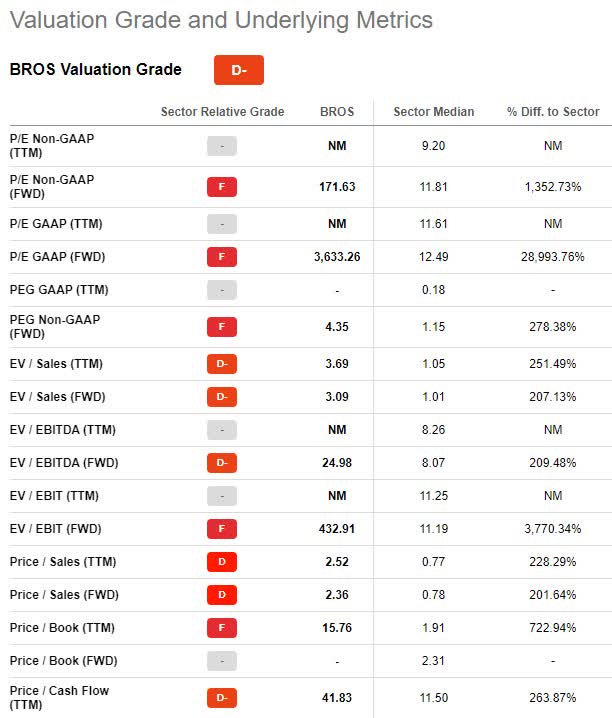
As the D- valuation grade and underlying metrics indicate, the company was highly overvalued due to COVID profitability, hype, and tailwinds. BROS is overpriced compared to its sector peers, but its forward P/E ratio of 171.63x is also an F grade, 1,352.73% higher than the sector. BROS has a trailing Price/Book of 15.76x, ranking last in the restaurant industry. Meanwhile, the Consumer Discretionary sector is 1.91x. And with its latest EPS miss resulted in six analysts’ downward revisions in the last 90 days. BROS may have peaked during the pandemic like many 2021 IPO’d companies, which is why our quant ratings rate it a Sell. Let’s dive next into the growth and profitability metrics.
Stock Growth & Profitability
Newly publicly traded companies are in high growth mode, typically taking 100% of their earnings and reinvesting them back into the company for growth, which is often associated with high debt levels. Earnings are typically negative as newer companies tend to be in exponential spending mode, especially in consumer-driven products and services, where the marketing budget is vital yet eats into revenue and margins, reducing the ability to make a profit.
Using Thoughtworks Holdings Inc. (TWKS) as the growth and profitability example, this $3.26B tech consultancy company went IPO on September 15, 2021. It surged as much as 42.3% after being priced above its anticipated $18-20/share range. Where many tech companies benefited early in the pandemic, TWKS’s rapid rise was shortly followed by growth challenges, which continue to loom. TWKS momentum is strongly bearish, as investors have been actively selling the stock, whose price is trading near its 52-week low of $10.28 from its high of $33.69.
Despite Thoughtworks EPS of $0.11 in line and revenue of $332.1M beat by $4.01M, its downward momentum, the economic environment, and growth headwinds have resulted in 11 downward analyst revisions.
TWKS Stock EPS Revisions (Seeking Alpha Premium)
Momentum and EPS revisions are two of the most important out of five core factors concerning a company’s outlook and price predictability. With D and F grades, respectively, TWKS is underperforming its sector, and the stock is down 59% year-to-date, which is why the risk warning is well warranted. Given bearish indicators, the health of TWKS is in question. Growth, especially for newer companies, measures a company’s strength and how fast its revenues and earnings climb. Now more than ever is a time that TWKS will have to grapple with economic risks and uncertainties, which is why our quant ratings give it a Strong Sell.
Should I buy stock after an IPO?
Stocks with strong fundamentals, good growth prospects, and attractive valuation metrics can be attractive purchases after an IPO. Companies without strong fundamentals, especially whose appeal shot up in 2021, are being exposed, underperforming the S&P 500, and pose risks to investor portfolios. Avoid stock losers like BROS, WOOF, FORG, TWKS, and COOK by using the power of our Quant Ratings and Factor Grades. The stocks highlighted in this article all possess Sell or Strong Sell Quant Ratings. Seeking Alpha Quant Sell recommendations have underperformed the S&P 500 on a total return basis going back to 2010.
Seeking Alpha’s Sell Recommendations vs S&P 500 (Seeking Alpha Premium)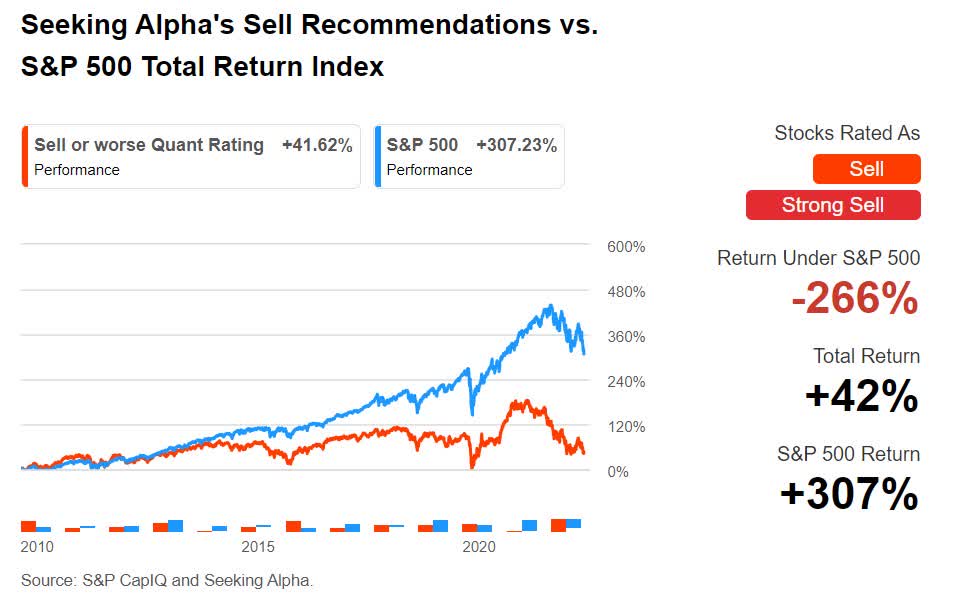
Our tools expose some of the risks to investments, such as poor valuation frameworks, weak growth dynamics, downward analysts’ earnings revisions, and subpar profitability. These signals can warn investors to avoid or sell long before their latest earnings miss. At first glance, stocks like Dutch Brothers, Petco, Thoughtworks, and ForgeRock may have appeared attractive or captured headlines in 2021, but the environment has changed, causing a fall in stocks with poor fundamentals and lacking profits.
TWKS’ Poor Report Card & Ratings on Key Investment Characteristics
TWKS’ Poor Report Card & Ratings on Key Investment Characteristics (Seeking Alpha Premium)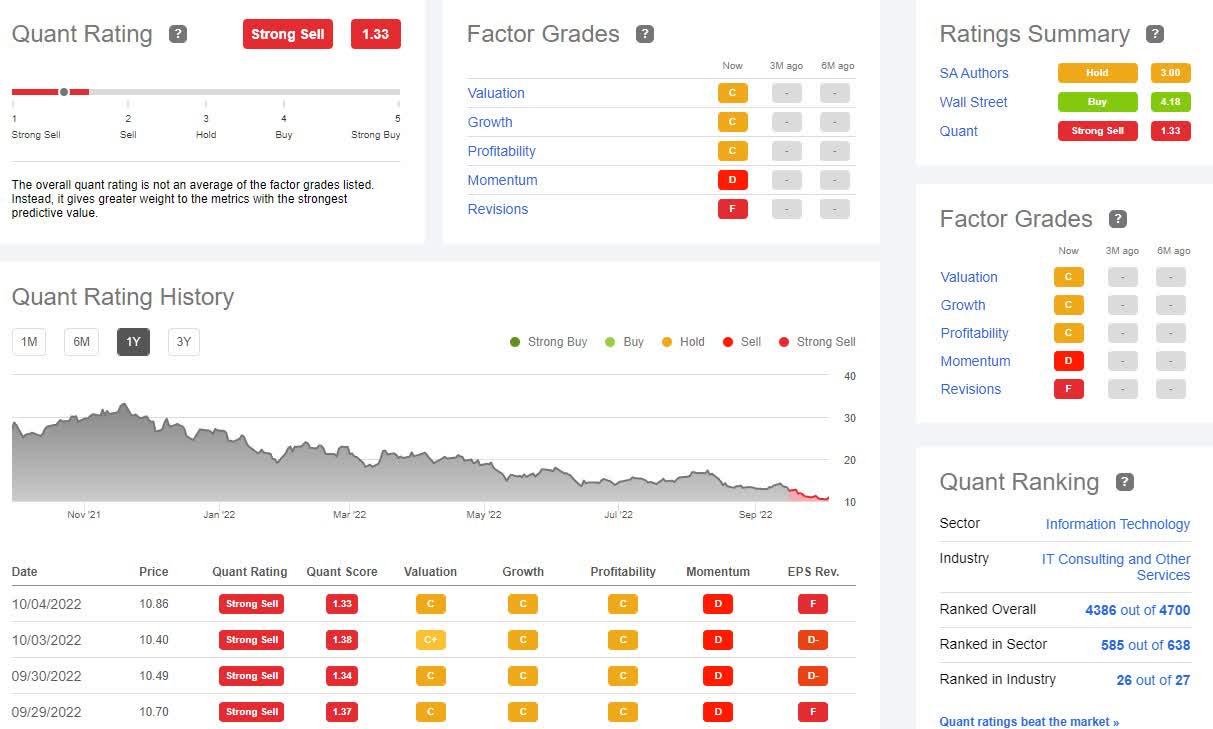
Check out the report card on your stocks and consider evaluating your pick((s)) by creating a Seeking Alpha portfolio to help you determine the losers in a portfolio that can save you from catastrophic losses.
Be the first to comment