


Dilok Klaisataporn
The Chart of the Day belongs to the P&C insurance company Selective Insurance (SIGI). I found the stock by sorting the Russell 3000 Index stocks first by the most frequent number of new highs in the last month and having a Trend Spotter buy signal, then used the Flipchart feature to review the charts for consistent price appreciation. Since the Trend Spotter first signaled a buy on 8/20, the stock gained 15.52%.
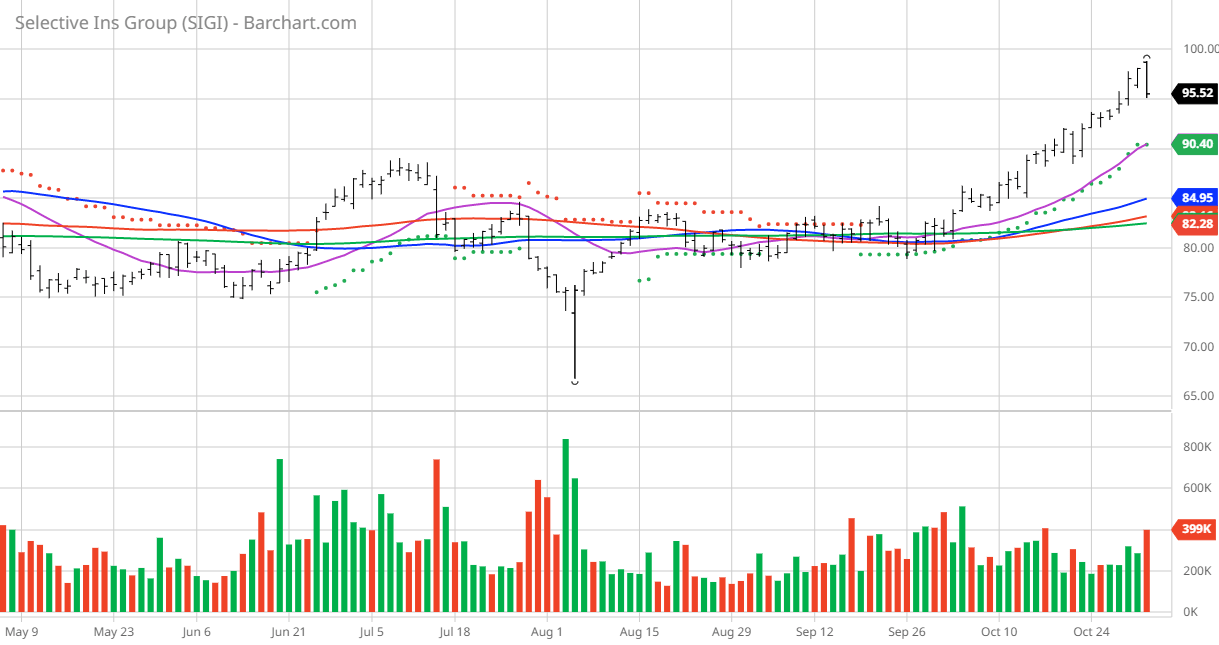
SIGI Price vs Daily Moving Averages
Selective Insurance Group, Inc., together with its subsidiaries, provides insurance products and services in the United States. It operates through four segments: Standard Commercial Lines, Standard Personal Lines, E&S Lines, and Investments. The company offers property insurance products, which covers the financial consequences of accidental loss of an insured’s real property, personal property, and/or earnings due to the property’s loss; and casualty insurance products that covers the financial consequences of employee injuries in the course of employment, and bodily injury and/or property damage to a third party, as well as flood insurance products. It also invests in fixed income investments and commercial mortgage loans, as well as equity securities and alternative investment portfolio. The company offers its insurance products and services to businesses, non-profit organizations, local government agencies, and individuals through independent retail agents and wholesale general agents. Selective Insurance Group, Inc. was founded in 1926 and is headquartered in Branchville, New Jersey.
Barchart’s Opinion Trading systems are listed below. Please note that the Barchart Opinion indicators are updated live during the session every 20 minutes and can therefore change during the day as the market fluctuates. The indicator numbers shown below therefore may not match what you see live on the Barchart.com website when you read this report.
Barchart Technical Indicators:
- 100% technical buy signals
- 23.40+ Weighted Alpha
- 22.28% gain in the last year
- Trend Spotter buy signal
- Above its 20-, 50- and 100-day moving averages
- 17 new highs and up 17.07% in the last month
- Relative Strength Index 66.38%
- Technical support level at 96.74
- Recently traded at $95.52 with 50-day moving average of $84.95
Fundamental factors:
- Market Cap $5.92 billion
- P/E 18.24
- Dividend Yield 1.14%
- Revenue expected to grow 10.70% this year and another 8.50% next year
- Earnings estimated to decrease 13.90% this year and increase an additional 19.80% next year and continue to compound at an annual rate of 13.40% for the next 5 years
Analysts and Investor Sentiment – I don’t buy stocks because everyone else is buying but I do realize that if major firms and investors are dumping a stock it’s hard to make money swimming against the tide:
- Wall Street analysts have 1 buy and 5 hold opinions in place on this stock
- Analysts have price targets from $80.00 to $98.00 with an average of $88.50
- The individual investors on Motley Fool voted 44 to 5 that the stock will beat the market with the more experienced investors voting 14 to 1 for the same result
- 1,520 are monitoring this stock on Seeking Alpha
Ratings Summary
Factor Grades
Quant Ranking
Sector
Industry
Property and Casualty Insurance
Ranked Overall
Ranked in Sector
Ranked in Industry
Quant ratings beat the market »
Dividend Grades
Be the first to comment