

Thinkhubstudio/iStock via Getty Images
I am reaffirming a positive risk/reward rating for Schlumberger (NYSE:SLB) based on the early stages of a new growth cycle, an exceptional multiyear earnings growth trajectory, material upside surprise potential, the company’s global leadership position, and its asymmetric potential return profile.
Risk/Reward Rating: Positive
Schlumberger reported its third consecutive quarter of year-over-year revenue growth on January 21, 2022. The Q4 2021 and full-year financial results confirmed that the energy services sector has officially exited a 6-year bear market while signaling that the first new growth cycle since 2009 is now in force. Given the early stage of the nascent energy services growth cycle, Schlumberger continues to represent an intriguing cyclical growth opportunity as the global leader in the space.
The Growth Cycle
The scale and duration of the new upturn remains highly uncertain due to the global focus on decarbonization and the resulting negative sentiment surrounding the traditional oil and gas sector. As a result, there remains heightened investor uncertainty and industry cautiousness compared to prior cyclical upturns. In my last Schlumberger report published on December 21, 2021, I made the following observation:
Ironically, the generally negative investor sentiment and cautious industry behavior sets the stage for an unusually strong upcycle for the group.
Olivier Le Peuch, Schlumberger’s CEO, hints at this possibility in Schlumberger’s recent Q4 2021 8-K filed with the SEC (emphasis added):
Looking ahead into 2022, the industry macro fundamentals are very favorable, due to the combination of projected steady demand recovery, an increasingly tight supply market… We believe this will result in a material step up in industry capital spending… These favorable market conditions are strikingly similar to those experienced during the last industry supercycle, suggesting that resurgent global demand-led capital spending will result in an exceptional multiyear growth cycle.
From my perspective, the last industry supercycle was the period from roughly 2003 through 2014. During this period, with a brief interruption during the Great Financial Crisis in 2008, Schlumberger’s share price appreciated 556%, rising from $18 to $118. Interestingly, the majority of this appreciation occurred by mid-2008, with a sideways trading pattern thereafter into the 2014 peak. In other words, nearly all of the gains from the 11-year supercycle were pulled forward into the first 5 years.
Performance: Can it Continue?
Since my last report on December 21, 2021, Schlumberger has produced a total return of roughly 45% compared to -4.3% for the S&P 500 index. Schlumberger’s current share price is $42.39 compared to $29.41 at the time of the last report. This is incredible outperformance over such a short period of time and raises the natural question: can it continue?
The statement above from Le Peuch, was made on January 21, 2021. Since this time and the time of my last report, industry conditions have become materially more bullish. Unfortunately, Russia’s invasion of Ukraine is a large contributor to the increasingly bullish industry backdrop for oil and gas.
Nonetheless, oil and gas prices were trending higher prior to the invasion and have now entered a powerful, if volatile, bull-market phase. The recent breakout of Brent crude oil above the orange line on the following 5-year weekly chart confirms the phase transition in the traditional energy markets. The orange line served as upside resistance in October 2018 and again in October 2021 before being overtaken in January 2022.
Brent crude oil 5-year weekly chart (Created by Brian Kapp using a chart from Barchart.com)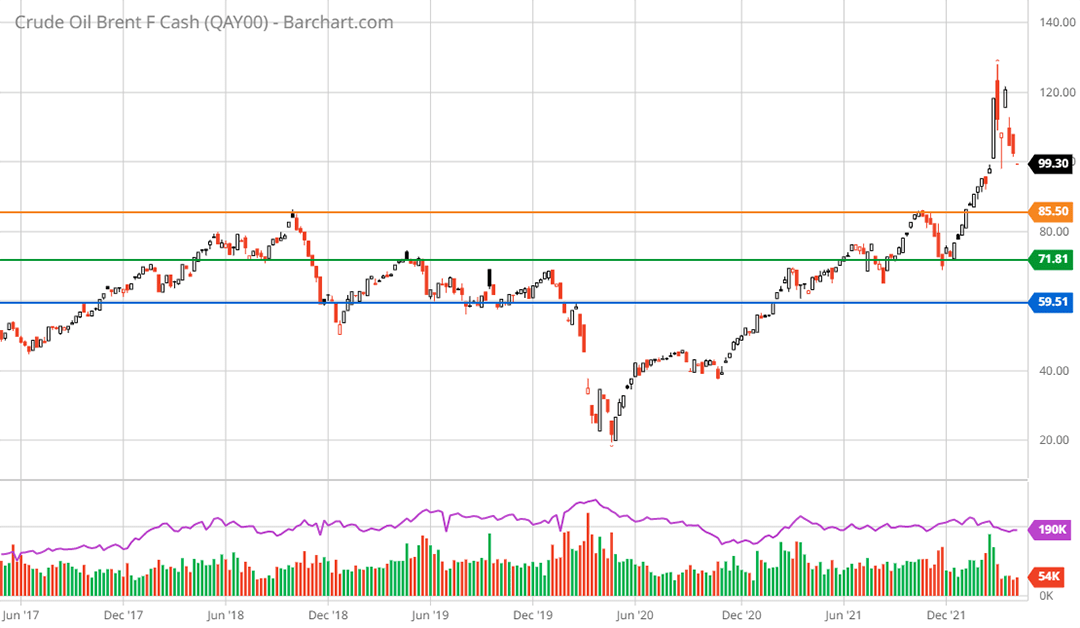
The orange line near $85 now represents key support. At the time of my last report, the green line near $72 represented the primary support level. This level now looks to be a nearer-term floor as things stand, with $85 replacing it as the primary support level.
With increasing geopolitical risks and runaway inflation in many parts of the world, oil and gas markets are beginning to price in the potential for supply disruptions and the increasing possibility that there may be regional imbalances between supply and demand. This is occurring against a macroeconomic backdrop that features a once-in-a-generation attempt at an energy transition.
I say attempt because the thrust of global policy initiatives is generally not well aligned with the most efficient and sustainable long-term pathway to zero-carbon energy production and utilization. For example, from the perspective of utility-scale electrical grid applications, nuclear energy is by far the single most efficient, sustainable, and resilient pathway forward. As a result, nuclear energy provides the greatest leverage if one is trying to electrify the world’s energy usage and replace hydrocarbons. Interestingly, global policy initiatives are not well aligned with this reality.
In fact, many nuclear power plants are in various stages of being decommissioned in the Western world as the installed nuclear fleet nears its end of life and requires substantial capital investment to upgrade and modernize. The aging of the nuclear fleet alone could offset much of the impact from policy initiatives which favor more intermittent energy supplies such as solar and wind. For those interested in more detail regarding burgeoning nuclear technologies, please see my recent BWX Technologies report (NYSE: BWXT).
The nuclear example above combined with policies designed to disincentivize oil and gas production are important in understanding the oil and gas demand backdrop and the likely trajectory of the new upcycle. For example, the policy initiatives being employed may prove to be ineffective or, at minimum, insufficient in supporting sustained global energy demand growth over the coming cycle and beyond.
If this is indeed the case, global demand for oil and gas will continue to set new records for the foreseeable future. In turn, this would place unexpected pressure on the oil and gas producers to increase output. Skyrocketing oil and gas prices are a possible signal that this scenario is already unfolding. In fact, global oil and gas demand is projected to reach pre-pandemic highs in 2022 and ascend to new all-time highs going into 2023. Given the supply tightness in the energy services sector following 6 years of downsizing, these dynamics would confer substantial pricing power to Schlumberger.
The cautious stance of the oil and gas industry toward investment in new capacity is a rational choice given the just completed 6-year bear market and depression-like conditions in 2020 and into 2021. When combined with global policy initiatives which disincentivize new oil and gas investment, supply and demand conditions look to remain exceptionally strong for the industry over the coming years.
In summary, as suggested by Schlumberger’s CEO, supply and demand conditions in the oil and gas sector may indeed rival the bullish setup at the beginning of the last industry supercycle. As a result, the short answer to the question of whether the outperformance can continue, is yes.
Consensus Growth Estimates
With positive industry trends firmly in place and a transitioning to a more bullish phase since my last report, one would expect to see consensus growth estimates moving materially higher for Schlumberger. Interestingly, consensus growth estimates remain largely unchanged since the end of 2021. The following table was compiled from consensus earnings and sales estimates provided by Seeking Alpha.
The top section of the table displays consensus earnings estimates and the lower section displays consensus sales estimates. On the left side of the table you will find the current consensus estimates, the middle displays consensus estimates as of my last report date, and the right-hand side displays how much consensus estimates have changed in absolute and percentage terms since my last report on December 21, 2021.
Source: Seeking Alpha. Created by Brian Kapp, stoxdox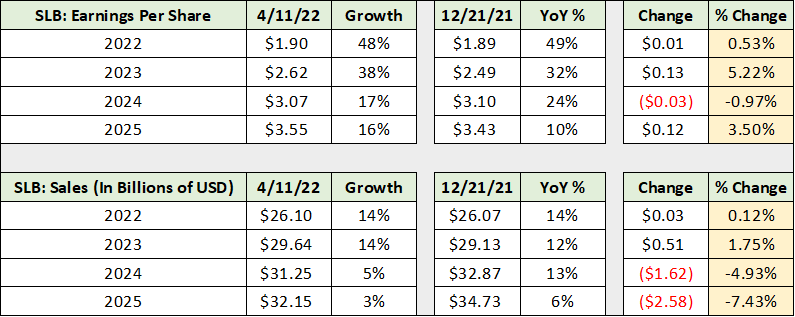
I have highlighted in yellow the percentage change in consensus estimates through 2025 since my last report. For all intents and purposes, there has been no change to consensus estimates for sales and earnings since the end of 2021. Of note, there was actually a reduction to sales estimates for 2024 and 2025. Given the upward-trending industry conditions discussed above, this is quite surprising and remarkably interesting.
This is especially the case in light of the materially higher baseline for energy prices since the last report. Over the same time horizon as the above tables (December 21, 2021 to April 11, 2022), Brent crude oil has risen by 35%, and was higher by 73% at one point.
It should be noted that Brent crude oil is not unique as most energy prices are in similar price trends, if to differing degrees. For example, the spot NYMEX natural gas price is up 77% over this period. The price trends are an exceptionally bullish signal for demand from Schlumberger’s customers as these are the commodities that they produce.
Upside Surprise Potential
There are a few possibilities as to why estimates have not changed in response to increasingly bullish industry trends. These are important to consider in checking the investment thesis. The marketplace may view the energy price spike as an aberration tied to transitory geopolitical events. While the Brent oil price spike to $128 was certainly caused by a shock, the Russian invasion of Ukraine, prices were trending solidly higher throughout the period since my last report.
The fundamental uptrend was and is being driven by conservative capital allocation policies at most major oil and gas producers. Keep in mind that they had just survived negative prices and depression-like conditions in 2020.
This leads to another potential reason for estimates not responding to bullish industry trends. The marketplace may not see a meaningful supply response from oil and gas producers no matter how high the price of oil and gas in the short term. Scott Sheffield, the CEO of Pioneer Natural Resources (NYSE:PXD), made comments in this regard during recent interviews. In February, Sheffield stated in a Bloomberg article:
Several other producers are having trouble getting frack crews, they’re having trouble getting labor and they’re having trouble getting sand… I just don’t think the industry can grow anyway.
One thing is certain about commodity cycles, at the right price companies will expand production capacity. The quote above from Sheffield was in speaking to the situation facing US oil and gas producers. He also discussed which regions of the world could invest and expand production. As stated in my prior report, this actually bodes well for Schlumberger:
Schlumberger is at its core a technology company, which is an excellent fit for the current state of the North American marketplace.
While North America may be labor constrained near term, Schlumberger’s competitive advantage is in engineering and technology. Maximizing the output and productivity of existing assets, in response to higher prices, is an incredibly low-risk and high-reward investment decision compared to investing in new wells. In addition, over 80% of Schlumberger’s sales are outside of North America.
This is important because North America was one of the first markets to recover in 2021. Most other geographies have yet to reach a meaningful growth inflection point, as discussed in my prior report:
These trends are important because 80% of Schlumberger’s markets had not inflected toward growth as of the end of Q2 2021, while only 39% had reached the growth inflection point by the end of Q3. 61% of Schlumberger’s markets have yet to join the new growth cycle as of the end of Q3.
This is excellent news for near-term growth at Schlumberger as the vast majority of its markets are still in the process of bouncing off the very deep bottom reached in 2020 and 2021 following a brutal 6-year bear market.
A final reason estimates have not reacted to the bullish trends may be due to the previously discussed policy incentives. The marketplace may view oil and gas as a mature to declining industry as a result. A related factor is the length of time that has passed since the last new upcycle in oil and gas. In essence, the market may have developed an embedded recency bias toward a negative view of the growth prospects for the industry.
Cyclical Context
To place the above possibilities in context, it is helpful to view current growth estimates with Schlumberger’s actual results following the last cycle bottom in 2009, following the Great Financial Crisis. Keep in mind that the 2009 bottom was a rapid downcycle within the middle of the last supercycle. Whereas the 2021 bottom was the culmination of a 6-year bear market for the oil and gas industry that ended in depression-like conditions.
The following table is from my prior Schlumberger report in which I compared consensus estimates at the time (they remain largely unchanged today) to the actual growth rates achieved by Schlumberger coming off the prior industry bottom in 2009.
Created by Brian Kapp, stoxdox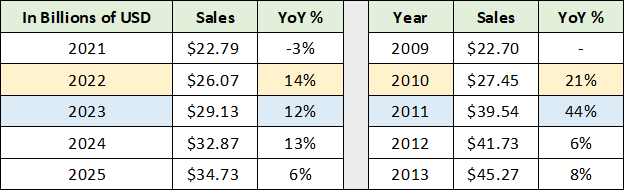
I have highlighted the important differences. Growth in 2022 is estimated to be only two-thirds of the growth achieved in the first full year after the 2009 bottom (2010). The growth estimates for 2023 look to be exceptionally conservative at roughly one-quarter of that achieved in year two of the prior upcycle. While I do not expect 44% growth to be repeated in 2023, there appears to be considerable room to surpass the current consensus growth estimate of 12%.
Additionally, this cycle is beginning with oil and gas producers adhering to disciplined and conservative capital allocation policies that have been ingrained by a long downcycle and policy disincentives. As a result, the current shape of consensus growth estimates looks to be correct with higher growth estimated for 2024 compared to 2012. In other words, this upcycle does indeed look to be more stable and persistent than the prior cycle.
In summary, consensus growth estimates look to be materially too low for 2023 and too low generally through 2025. If this is in fact the case, current consensus earnings estimates are likely to be quite low given Schlumberger’s commitment to expand and sustain higher profit margins. The 6-year bear market culminating in depression-like conditions for the industry in 2020 has likely left a durable mark on the entire industry.
Earnings and Upside Potential
Speaking to the commitment to expand and sustain higher profit margins, in the Schlumberger Fourth-Quarter and Full-Year 2021 Results Prepared Remarks, Le Peuch had the following to say (emphasis added):
Finally, the macro environment is increasingly supportive of a potential supercycle. As these favorable market conditions extend both onshore and offshore, well beyond 2022, we have increased confidence in reaching our midcycle EBITDA margin ambition of 25% in the second half of 2023.
The following table was compiled from my prior report and the current consensus earnings estimates provided by Seeking Alpha. To begin construction of Schlumberger’s potential return spectrum, I reviewed its historical valuation multiple during the prior upcycle. The average PE multiple during the last upcycle (2009 to 2014) was 24. Each year’s high PE is displayed in the upper portion of the table below.
Source: Seeking Alpha. Created by Brian Kapp, stoxdox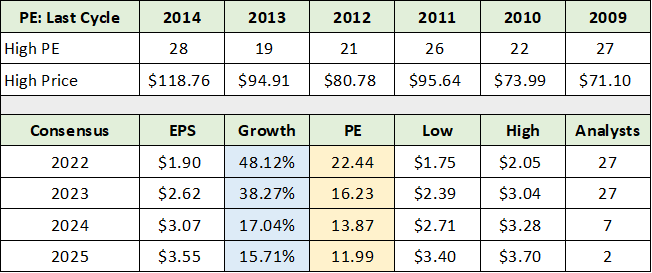
For ease of contrast, I have highlighted Schlumberger’s consensus growth estimates in blue and the current PE based on those estimates in yellow. A cursory glance points to upside return potential given the discrepancy between the expected growth rates and the associated valuations. For example, if earnings estimates are hit in 2023, Schlumberger would be producing 38% earnings growth while trading at only 16 times earnings with several years of cyclical growth remaining. This is well below the historical PE of 24, and well beneath the current market averages in the 20x range.
In addition to the upside return potential using consensus earnings estimates, Schlumberger also offers an excellent opportunity to materially surpass consensus sales growth estimates through 2025. As a result, it is worthwhile to examine Schlumberger’s potential return based on consensus earnings estimates as well as scenarios in which Schlumberger surpasses consensus estimates.
Potential Return Spectrum
To anchor the potential return spectrum, I use Schlumberger’s average historical PE multiple during the last upcycle (2009 through 2014). This has the benefit of eliminating extremely high PE ratios that occur near cyclical bottoms. For example, Schlumberger’s average PE multiple over the past 5 years is near 35x.
In the following table, I apply a 24x valuation multiple to various earnings estimates through 2025 and calculate the associated return potential ignoring dividends. I use consensus earnings estimates in the upper portion of the table. In the middle and lower portion, I estimate potential upside earnings surprises assuming various operating profit margins (Op margin), stable interest expense, and a 20% tax rate.
Please note that no sales surprises are incorporated into the upside scenarios below, only margin expansion. The scenarios below capture the essence of the upside surprise potential. That said, if the upside surprises occur, they will most likely result from a combination of upside sales surprises in addition to margin expansion.
The middle section assumes Schlumberger achieves an 18% and 20% operating margin on consensus sales estimates for 2022 and 2023. In the lower portion of the table, I assume a 25% operating profit margin on consensus sales estimates for 2023 and 2024. While the last scenario is aggressive, it is not out of the realm of possibilities given the increased EBITDA margin confidence of 25% by 2023 and the potential for upside sales surprises outlined above.
Created by Brian Kapp, stoxdox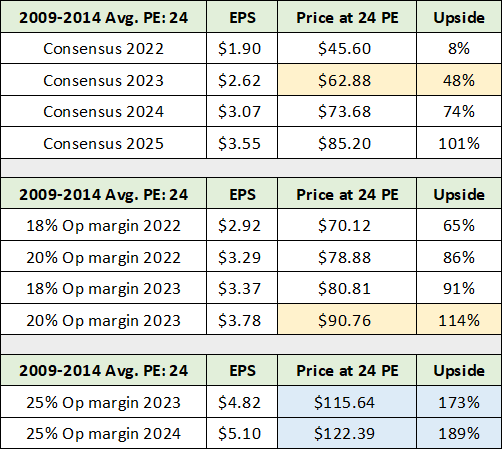
I have highlighted in yellow what I view as being a high probability upside return spectrum over the coming 1-3 years. The blue highlighted cells reflect what I view to be realistic, if less probable, higher-end possibilities through 2024. While I have only used margin expansion on consensus sales estimates for the upside scenarios, if they play out, sales growth surprises are likely to play a large role. Given the bullish industry trends, the technical backdrop offers the most relevant context within which to estimate the downside potential.
Technicals
The technical backdrop for Schlumberger is a tale of three time frames: daily, weekly, and monthly. The common feature of each is strong support at $35 and then $30. Beginning with the 2-year daily chart below, it is clear that Schlumberger is in a well-defined primary uptrend. The key support levels are highlighted by the horizontal lines. Notice the green line near $35 and the blue line near $30. These are extraordinarily strong long-term support levels as we will see.
Schlumberger 2-year daily chart (Created by Brian Kapp using a chart from Barchart.com)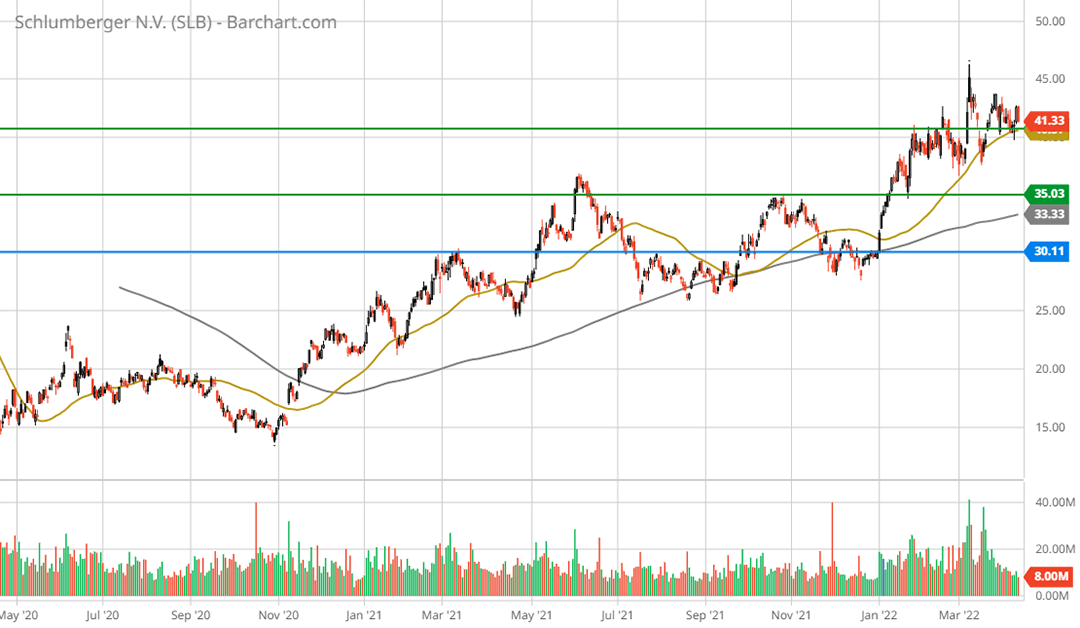
Please note that the upper green line near $41 was prior resistance and is now being tested as support. I would consider the zone between $35 and $41 to be exceptionally strong support given the bullish industry backdrop. The $30 level appears to be a worst-case scenario as things stand.
The downside potential to $35 and $30 is 17% and 29%, respectively. I view 17% as the most likely downside potential given the early stage of the new growth cycle. The following 5-year weekly chart places the key levels in greater context and introduces technical resistance levels which are denoted by the orange lines. The resistance levels can be thought of as technical upside price targets.
Schlumberger 5-year weekly chart (Created by Brian Kapp using a chart from Barchart.com)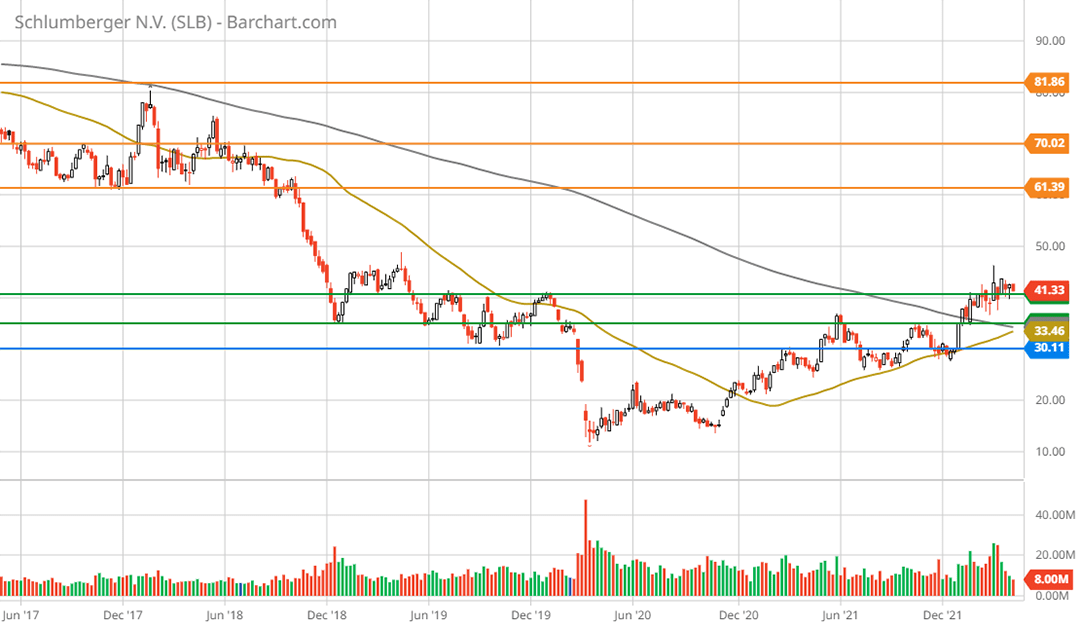
Notice that the area outlined by the green lines should be extraordinarily strong support given that the breach of this level occurred during the COVID crash and the extraordinary spectacle of negative oil prices. The orange resistance levels are at $61, $70, and $82.
The first resistance level coincides nicely with the first fundamental upside return target near $63 displayed in the potential return spectrum table above. This represents 48% upside potential. The return potential to the first target level compares quite favorably to the likely downside potential of 17%.
The upper technical target near $80 is not far removed from the upper end of the high-probability potential return spectrum near $91 per share, which represents upside potential of 114%. This return potential is exceptional compared to the technical downside potential. The following monthly-price chart places the upper price levels in the appropriate context.
Schlumberger monthly chart (Created by Brian Kapp using a chart from Barchart.com)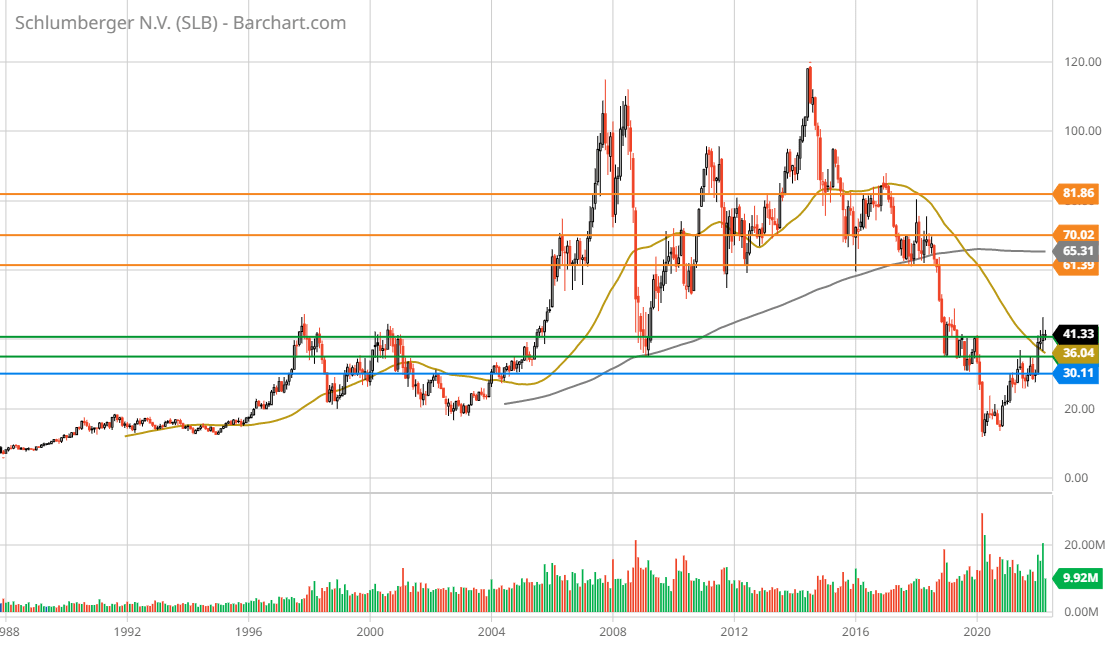
Notice that during the 2008 and 2014 tops, Schlumberger peaked near $120 per share. If the current cycle were to follow the same pattern, the higher-end return potential near $115 per share from the potential return spectrum would be in play (highlighted in blue in the table above). This represents 173% upside return potential and completes the asymmetric risk/reward profile for Schlumberger.
2025 and Beyond
The above analysis and the prior research report did not speak to Schlumberger’s growth plans, only its cyclical growth potential. The oil and gas industry has a long and prosperous future in front of it, the energy transition notwithstanding. While the return potential from the oil and gas business is exceptional in its own right, Schlumberger is methodically expanding in the alternative energy space. As stated in my last report: “Schlumberger is at its core a technology company.”
Schlumberger is planting the seeds of future growth. While these new business ventures remain immaterial today, they have meaningful potential for Schlumberger looking past 2025. My intent here is to provide a flavor for Schlumberger’s growth ambitions. Remember, these ventures offer pure upside potential to what has been covered here. The following is a list of Schlumberger’s most visible venture investments with a link to more details for those interested.
- NeoLith: Novel Lithium mining technology with transformative potential and a pilot project underway.
- EnerVenue: Nickel-hydrogen battery technology with proven potential that is now being deployed.
- Genvia: Electrolyzer technology used to produce hydrogen with zero emissions, pilot projects underway.
- Celsius Energy: Proven building-scale geothermal energy technology that is being deployed.
Summary
Schlumberger is an asymmetric growth opportunity in the early stages of a new upcycle. The cyclical growth opportunity could be quite large given the exceedingly favorable industry conditions, which were described by Schlumberger’s CEO as being “strikingly similar to those experienced during the last industry supercycle.” All things considered, Schlumberger remains a top choice for growth over the coming years.
Be the first to comment