

R&A Studio
We all dream of a “buy and hold forever” portfolio that we can set, forget, and count on to make us rich over time.
High-yield dividends are one time tested and easy to understand way to retire rich and stay rich in retirement.
But don’t forget that combining yield with growth can deliver up to 19X more retirement income over time.
For those who don’t want to pick individual companies for their growth, yield, or hedge buckets, ETFs are a great low cost way to construct your dream retirement portfolio.
I just explained why I’m investing 100% of my 401K (and Roth IRA) into five world-beater blue chips.
After I published that article, a Dividend Kings member asked me whether Schwab U.S. Large-Cap Growth ETF (NYSEARCA:SCHG) might not be a better or at least reasonable alternative to the Nasdaq 100 (NASDAQ:QQQ) (NASDAQ:QQQM).
So let me show you why both SCHG and QQQM (the lowest cost version of QQQ) are wonderful growth ETFs. But while there is a lot to love about both, I’m personally sticking with QQQM in my 401K, and it all comes down to dividends.
SCHG: One Of The Best Growth ETFs In The World
There are three main reasons to choose SCHG as a great growth ETF.
Schwab U.S. Large-Cap Growth ETF is an excellent large-growth fund. It charges a razor-thin fee for a market cap-weighted portfolio that captures the full opportunity set available to active large-growth investors. It earns a Morningstar Analyst Rating of Silver.
The Dow Jones U.S. Large-Cap Growth Total Stock Market Index, which this fund fully replicates, absorbs stocks representing the faster-growing half of the U.S. large-cap market and weights them by market capitalization.” – Morningstar
First, is the 4-star silver rating from Morningstar, which praises its 0.04% expense ratio (vs 0.15% for QQQM).
What’s great about this growth ETF is that, just like SCHD, the gold standard high-yield blue-chip ETF, it uses a very attractive strategy of selecting the best companies to own.
Specifically, it uses several growth metrics instead of just one, and ranks the largest 500 US companies by overall growth, to generate a highly diversified portfolio of world-beater blue chips.
Morningstar
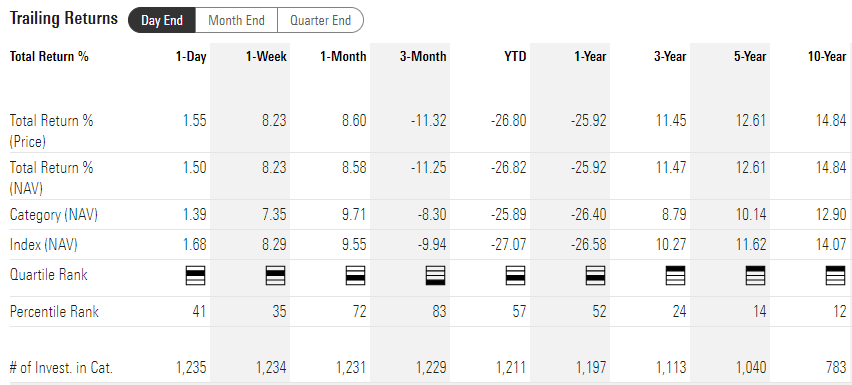
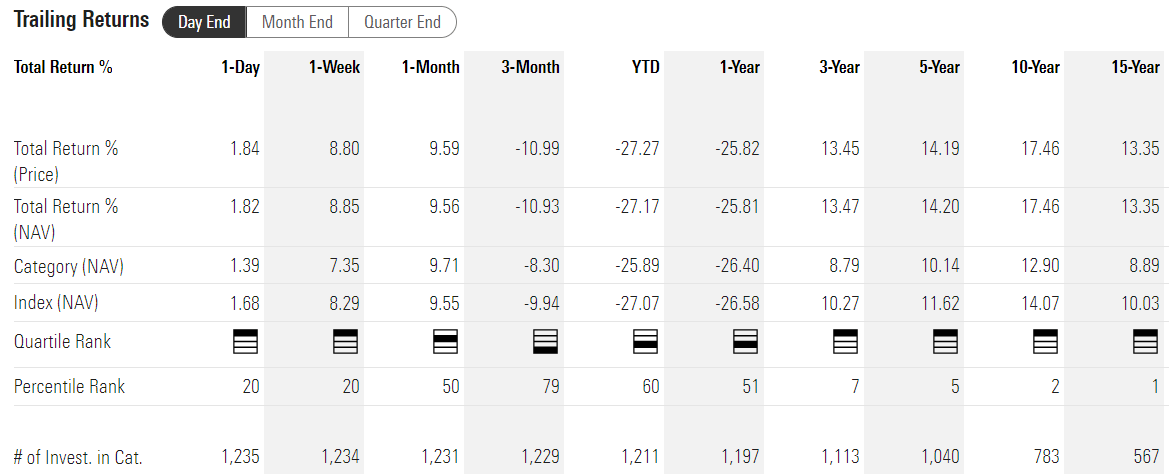
Over the last decade, out of 783 large cap growth funds, SCHG’s returns have been in the top 12%, and it’s now hard to see why.
Morningstar
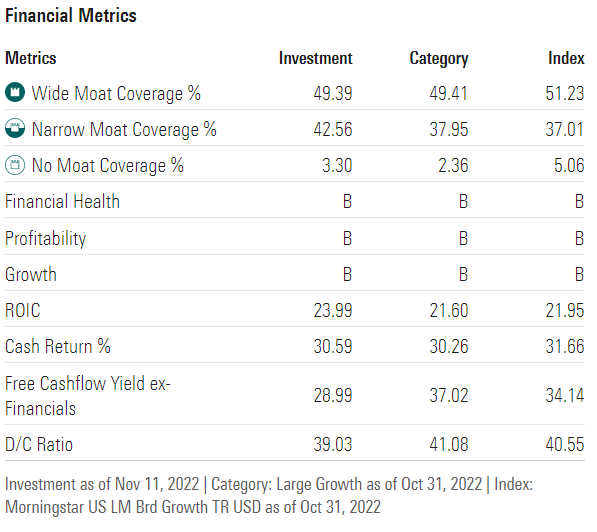
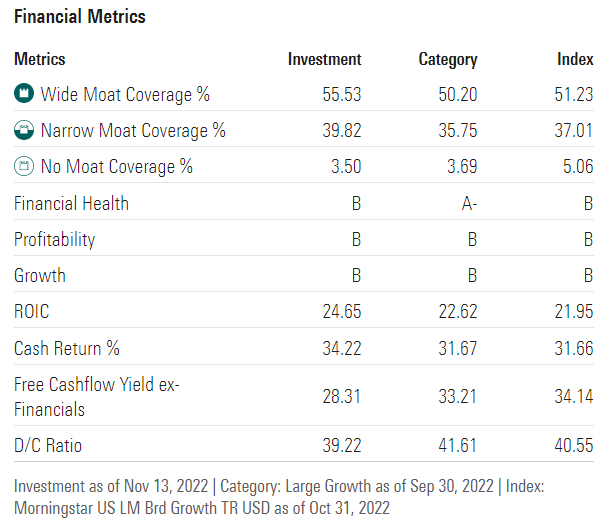
This is one of the moatiest groups of companies on earth according to Morningstar, with above-average balance sheets and profitability including 29% free cash flow yields.
Morningstar
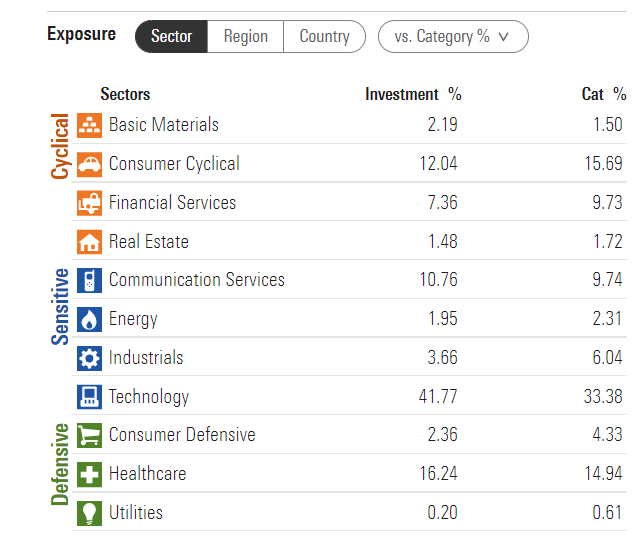
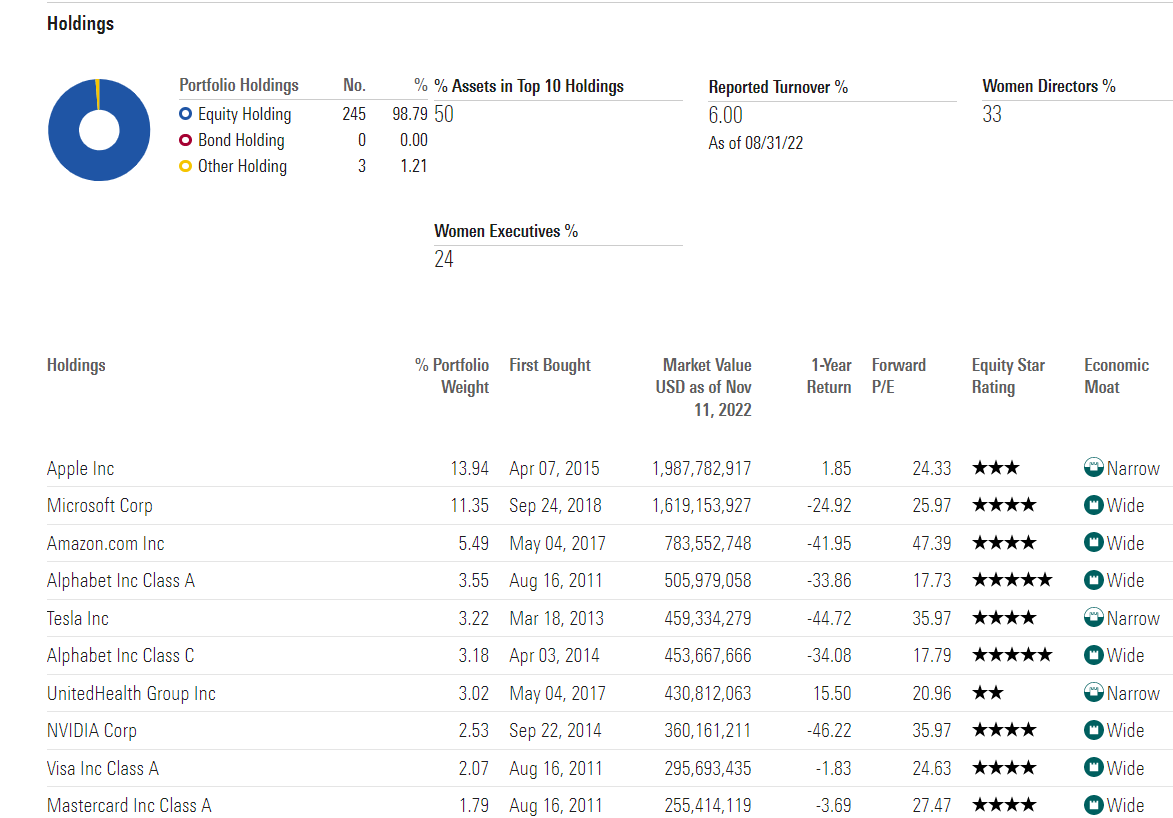
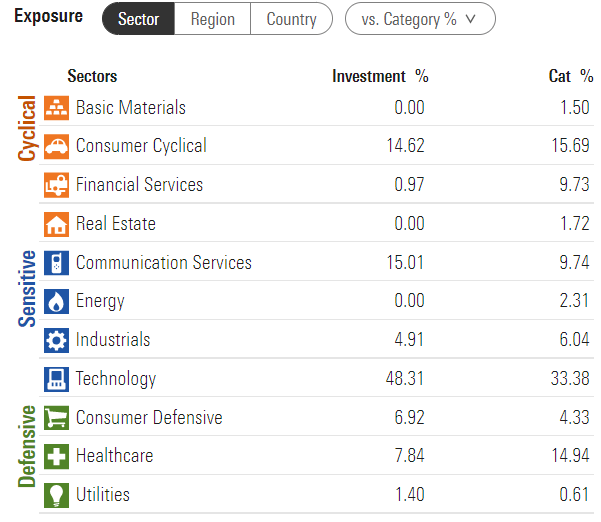
As one would expect from a large-cap growth ETF, it’s heavily focused on tech and communication (Alphabet (GOOG), Meta (META), Netflix (NFLX)), and consumer discretionary (Amazon (AMZN) and Tesla (TSLA)).
Morningstar
Morningstar
These are 250 of the greatest growth blue chips on earth, packed to the rafters with world-beaters and Ultra SWANs.
Naturally, a market-cap weighted portfolio will be heavily concentrated, with the top 10 representing 50% of the portfolio.
But look at the fundamentals of this 240-company portfolio.
Morningstar
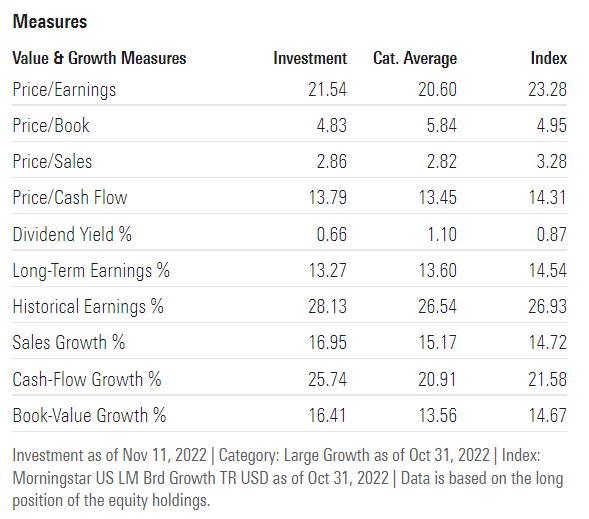
Thanks to its screening focus on growth, Morningstar’s analysts think SCHG could deliver 13.3% CAGR long-term growth, or about 13.9% CAGR long-term total returns.
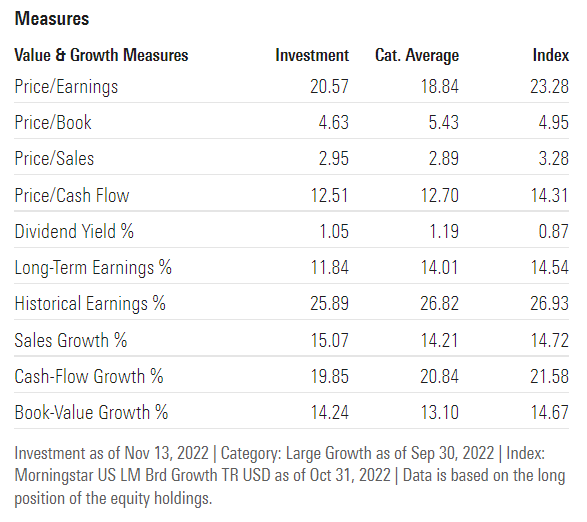
What about valuation? Isn’t a PE of 21.5 too high? Actually the price/cash flow is a far more reasonable 13.8.
- cash flow PEG of 1.04 = growth at a reasonable price
The cash-adjusted PE of SCHG is 13.9 and thus a cash-adjusted PEG ratio of 1.05.
- also growth at a reasonable price
Historical Market-Determined Fair Value For SCHG
| Year | PE |
| 2010 | 17.87 |
| 2011 | 15.71 |
| 2012 | 15.63 |
| 2013 | 19.45 |
| 2014 | 21.17 |
| 2015 | 18.54 |
| 2016 | 22.29 |
| 2017 | 25.74 |
| 2018 | 21.76 |
| 2019 | 26.23 |
| 2020 | 42.24 |
| 2021 | 32.86 |
| 2022 | 25.11 |
| 2023 | 21.75 |
| 2024 | 18.90 |
| 13-Year Average | 23.43 |
| 13-Year Median | 21.76 |
| 10-Year Average | 25.54 |
| 10-Year Median | 23.70 |
| 5-Year Average | 29.64 |
| 5-Year Median | 26.23 |
| 12-Month Forward | 22.07 |
| Historically Overvalued | -6.86% |
(Source: DK ETF Tracker, FactSet)
SCHG appears about 7% historically undervalued, a potentially good buy for anyone who is comfortable with its risk profile (more on that in a moment).
Nasdaq 100: Still The King Of Fast Dividend Growth ETFs
The Nasdaq 100 is my favorite fast-dividend growth ETF because I’ve yet to find any ETF with superior income growth over the last 17 years.
- 17.1% CAGR since 2005 vs S&P 500’s 8.9% CAGR
The Nasdaq 100 represents the 100 largest market cap companies in the Nasdaq composite which is actually about 3,500 companies.
The biggest downside of this ETF is that anything that doesn’t trade on the Nasdaq can’t ever be included.
- LOW and MA are NYSE world-beater blue chips you’ll have to buy separately if you want to own them
The expense ratio of 0.2% for QQQ and 0.15% for QQQM also is relatively high compared to SCHG or other large-cap growth ETFs.
Then again, historically speaking that extra 0.1% in expenses has been well worth it.
Morningstar
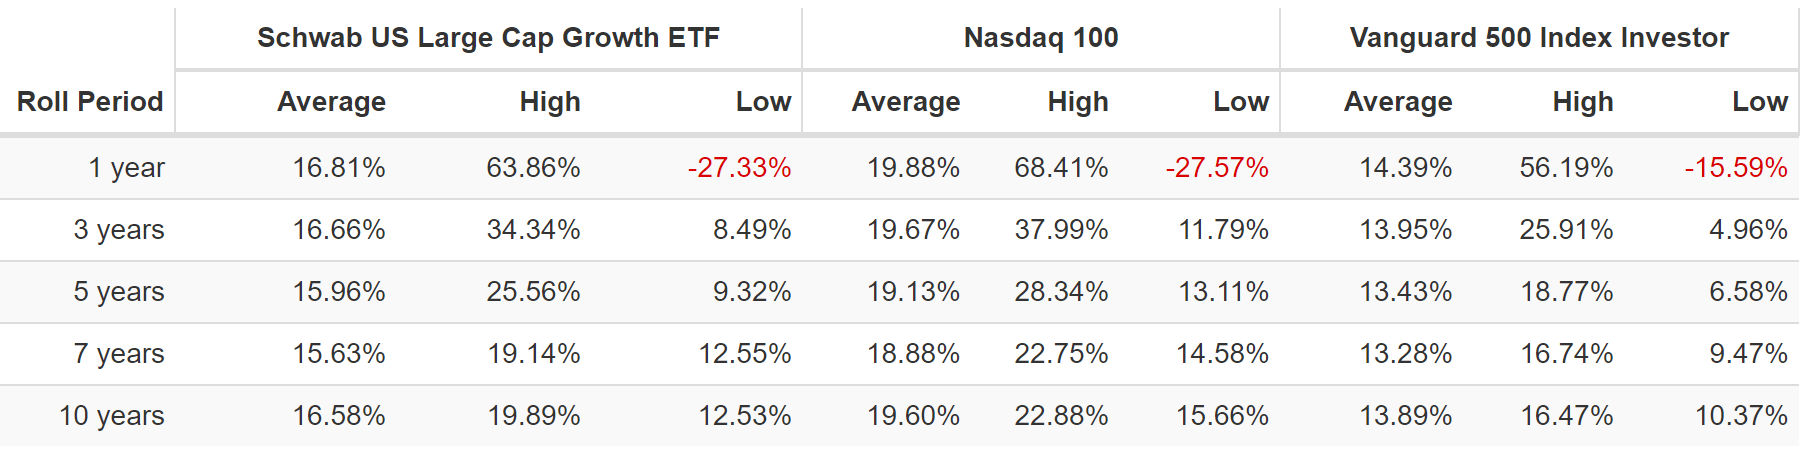
SCHG’s total returns have been in the top 12% of growth ETFs over the last 12 years but QQQ’s have been in the top 2%.
And out of the 567 large cap growth ETFs that have been around for 15 years, QQQ is in the top 1%.
- just five growth funds on earth have beaten the Nasdaq 100 over the last 15 years
- a period of time when 91% of total returns were the result of fundamentals, not luck
What kind of fundamentals?
Morningstar
96% narrow and wide moat companies with above-average balance sheets, profitability and growth (just like SCHG).
29% free cash flow yields and very safe 39% payout ratios, on average.
Morningstar
QQQ is thought of as a tech ETF and that’s for good reason.
Including communication and consumer discretionary, it’s about 80% big cap tech.
Morningstar
Morningstar’s analysts think the Nasdaq 100 can grow at 11.8% over time, delivering 12.6% CAGR long-term returns.
- similar to the returns of the last 20 years
The valuation is slightly better than SCHG’s at 12.5X cash flow and 13.5X cash-adjusted earnings (EV/EBITDA).
Nasdaq 100’s Historical Cash-Adjusted PE Fair Value
| Year | EV/EBITDA (Net Cash -Adjusted Earnings) |
| 2008 | 7.16 |
| 2009 | 10.73 |
| 2010 | 10.45 |
| 2011 | 9.1 |
| 2012 | 8.82 |
| 2013 | 11.45 |
| 2014 | 11.96 |
| 2015 | 10.63 |
| 2016 | 12.56 |
| 2017 | 14.29 |
| 2018 | 13.01 |
| 2019 | 14.38 |
| 2020 | 20.16 |
| 2021 | 17.36 |
| 2022 | 14.06 |
| 2023 | 13.49 |
| 2024 | 12.08 |
| 15-Year Average | 12.92 |
| 15-Year Median | 12.56 |
| 10-Year Average | 14.20 |
| 10-Year Median | 13.78 |
| 5-Year Average | 15.43 |
| 5-Year Median | 14.06 |
| 12-Month Forward | 13.54 |
| Historically Overvalued | -1.67% |
(Source: Dividend Kings S&P 500 Valuation Tool, FactSet)
Nasdaq 100’s Historical Cash-Adjusted PE Fair Value
| Year | PE |
| 2008 | 13.69 |
| 2009 | 20.2 |
| 2010 | 18.11 |
| 2011 | 15.47 |
| 2012 | 14.58 |
| 2013 | 19.5 |
| 2014 | 21.24 |
| 2015 | 18.36 |
| 2016 | 21.96 |
| 2017 | 24.69 |
| 2018 | 21.06 |
| 2019 | 24.19 |
| 2020 | 33.78 |
| 2021 | 26.97 |
| 2022 | 23.45 |
| 2023 | 21.77 |
| 2024 | 19.04 |
| 15-Year Average | 21.15 |
| 15-Year Median | 21.06 |
| 10-Year Average | 23.52 |
| 10-Year Median | 22.71 |
| 5-Year Average | 25.89 |
| 5-Year Median | 24.19 |
| 12-Month Forward | 21.93 |
| Historically Overvalued | -3.41% |
(Source: Dividend Kings ETF Tracker, FactSet)
The Nasdaq is trading at historical fair value, a potentially reasonable buy for anyone looking for world-beater dividend growth titans.
Why I’m Choosing QQQM Over SCHG For My 401K
Both SCHG and QQQM are about evenly matched in terms of their fundamentals.
The Pros And Cons Of SCHG And QQQM
| Metric | SCHG | QQQM | Winner SCHG | Winner QQQM |
| Expense Ratio | 0.04% | 0.15% | 1 | |
| Dividend Yield | 0.5% | 0.8% | 1 | |
| Discount To Fair Value | 6% | 3% | 1 | |
| PE | 22.1 | 21.9 | 1 | |
| Cash-Adjusted PE | 13.9 | 13.5 | 1 | |
| LT Growth Consensus/Management Guidance | 13.3% | 11.8% | 1 | |
| LT Consensus Total Return Potential | 13.8% | 12.6% | 1 | |
| LT Risk-Adjusted Expected Return | 10.4% | 9.5% | 1 | |
| Inflation-Adjusted Consensus LT Return Potential | 11.5% | 10.3% | 1 | |
| LT Risk-And Inflation-Adjusted Return Potential | 9.1% | 7.1% | 1 | |
| Conservative Years To Double | 7.9 | 10.1 | 1 | |
| Historical Total Return Since 2010 | 13.5% | 16.8% | 1 | |
| Average 7-Year Rolling Return | 15.6% | 18.9% | 1 | |
| Average 10-Year Rolling Return | 16.6% | 19.6% | 1 | |
| Historical Dividend Growth | 6.9% | 14.3% | 1 | |
| ROIC | 24.0% | 24.7% | 1 | |
| FCF Yield | 29.0% | 28.3% | 1 | |
| Payout Ratio | 39.0% | 39.2% | 1 | |
| Financial Strength | B | B | 1 | 1 |
| Profitability | B | B | 1 | 1 |
| Growth | B | B | 1 | 1 |
| Wide Moat | 49.4% | 55.5% | 1 | |
| Narrow Moat | 42.6% | 39.8% | 1 | |
| Wide + Narrow Moat | 92.0% | 95.4% | 1 | |
| Total | 14 | 13 |
(Source: Morningstar)
Their future expected returns are very similar, though the Nasdaq 100’s historical returns are slightly better.
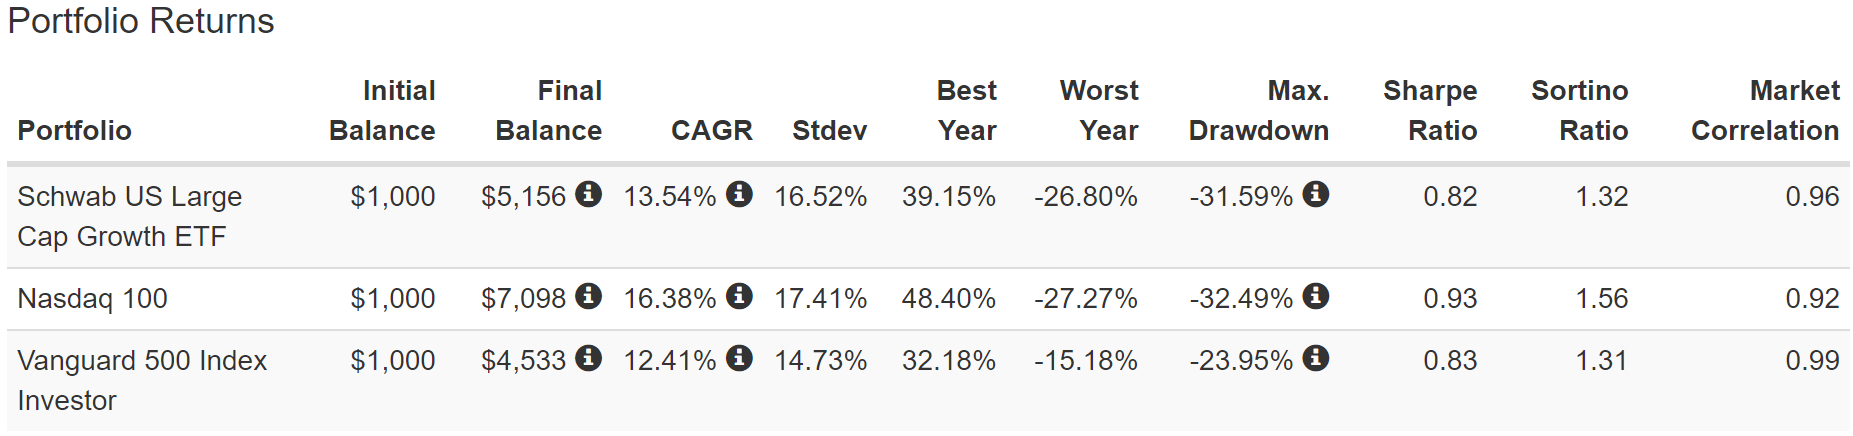
Historical Returns Since January 2010
Portfolio Visualizer Premium
Portfolio Visualizer Premium
Nasdaq beat SCHG over the last 12 years, though I don’t read too much into that.
- QQQ is a more concentrated portfolio
Do I think it’s possible for SCHG to achieve the 14% long-term returns analysts expect? Yes, because those 240 companies are selected for based on growth rates, including consensus growth rates.
QQQ is purely based on the 100 largest Nasdaq listed companies. Given QQQ’s historical 11% to 12% annual returns, I do consider the analyst consensus of 12.6% reasonable.
Rolling Returns Since 1999
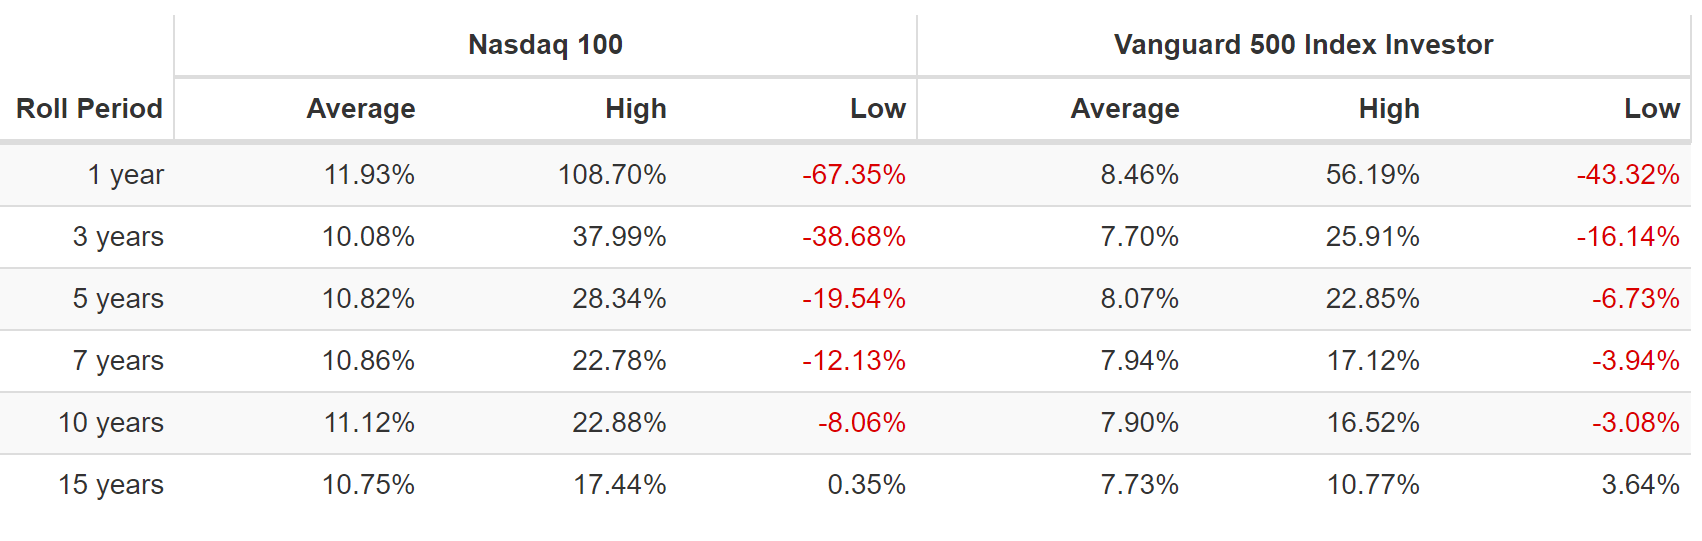
Portfolio Visualizer Premium
But since I’m seeking maximum long-term income growth I’m going with QQQM and here’s why.

Portfolio Visualizer Premium
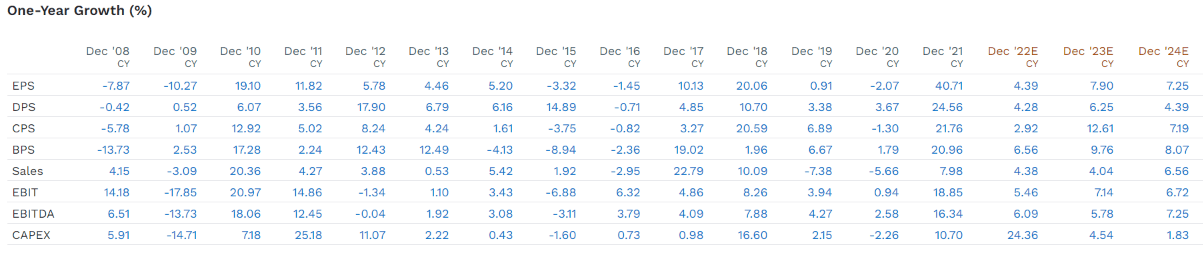
SCHG owns many of the same companies in the top 10, yet due to how its index is constructed and rebalanced SCHG’s dividend growth is both slower and less dependable than QQQ.
SCHG Historical Annual Growth Rates
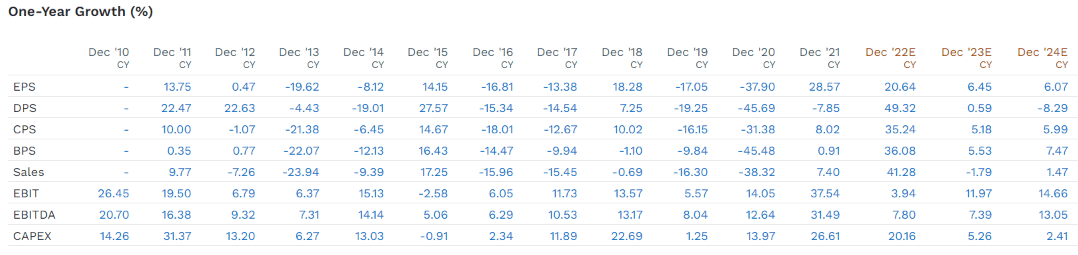
FactSet Research Terminal
SCHG’s annual rebalancing has resulted in seven years of negative dividend per share growth with another -8% income growth year expected in 2024.
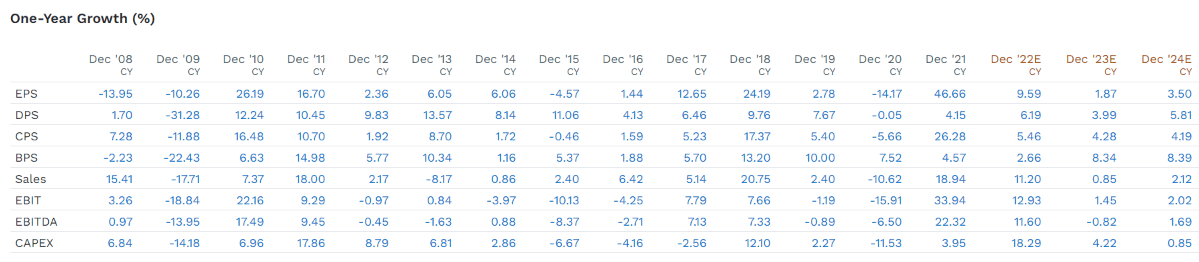
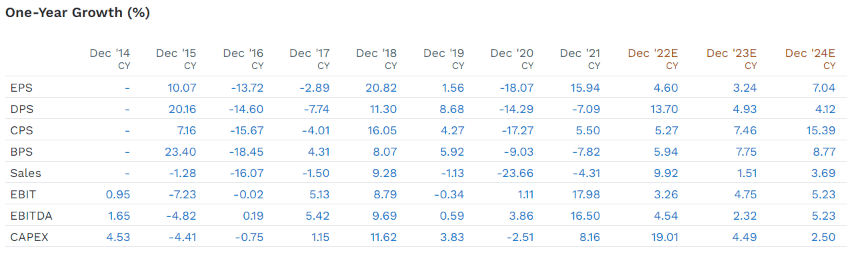
Now compare that to the Nasdaq 100.
QQQ Historical Annual Growth Rates

FactSet Research Terminal
QQQ’s only negative year of dividend growth was -2% in 2014.
- Great Recession dividend growth: 17%
- Pandemic dividend growth: 9%
In fact, take a look at how impressive and dependable QQQ’s dividend growth is compared to other blue-chip dividend growth ETFs.
NOBL Historical Annual Growth Rates

FactSet Research Terminal
The dividend aristocrat ETF (NOBL) is literally populated with 100% S&P companies with 25+ year dividend growth streaks. But thanks to annual rebalancing NOBL has delivered five years of negative dividend growth since 2014, including consensus estimates for 2023 and 2024.
SCHD Historical Annual Growth Rates

FactSet Research Terminal
SCHD also has some modest annual income variability, though with dividend reinvestment it raises its dividend every year.
VYM Historical Annual Growth Rates
FactSet Research Terminal
VYM has only had two negative years of dividend growth (and 2020 was basically flat). But in the Great Recession banks caused the annual dividend to fall by a rather nasty 31%.
VIG Historical Annual Growth Rates
FactSet Research Terminal
VIG’s claim to fame is that it owns only companies with 10-year-plus dividend growth streaks, and is so diversified that the annual dividend dependability is second to none.
- flat dividend in the Great Recession
- 2016 was the only other negative year and -0.7% was basically flat
- dividend reinvestment more than compensates for these two flat years
DGRO Historical Annual Growth Rates
FactSet Research Terminal
Bottom Line: Both SCHG And QQQ Are Great Growth ETFs But I’m Buying QQQM For My 401K
QQQM, SCHG, VIG, SCHD, VYM, and DGRO are the five gold-standard dividend ETFs Dividend Kings can recommend as a core portfolio allocation.
- they are in our DK ETF tracker
- with historical fair values updated weekly
But when it comes to what dividend growth ETFs I want to own for my 401K? I need the best combination of current yield, and strong and dependable long-term income growth.
- thus SCHD and QQQM is what I will buy for my 401K and in future portfolio rebalances
What do I mean?
Portfolio Visualizer Premium
Cumulative Dividends Since 2012: Per $1,000 Initial Investment
| Metric | S&P 500 | SCHD + QQQ | SCHD + SCHG |
| Total Dividends | $471 | $584 | $545 |
| Total Inflation-Adjusted Dividends | $359.54 | $445.80 | $416.03 |
| Annualized Income Growth Rate | 9.0% | 16.3% | 13.9% |
| Total Income/Initial Investment % | 0.47 | 0.58 | 0.55 |
| Inflation-Adjusted Income/Initial Investment % | 0.36 | 0.45 | 0.42 |
| More Inflation-Adjusted Income Than S&P | NA | 1.24 | 1.16 |
| Starting Yield | 2.5% | 2.3% | 2.4% |
| Today’s Annual Dividend Return On Your Starting Investment (Yield On Cost) | 5.9% | 10.4% | 8.8% |
| 2022 Inflation-Adjusted Annual Dividend Return On Your Starting Investment (Inflation-Adjusted Yield On Cost) | 4.5% | 7.9% | 6.7% |
(Source: Portfolio Visualizer Premium)
Combining SCHD with QQQM historically produces about 12% to 13% long-term returns along with the best income growth combination of any dividend growth ETF, other than the Nasdaq itself.
But with a starting yield that’s about 3X higher than the Nasdaq.
And then if you combine with it individual blue-chips and other blue-chip assets (like 9.5% yielding DBMF) that’s how you can achieve portfolio fundamentals like my 401K.
- 5.0% safe yield
- 8.2% CAGR growth consensus
- 13.2% CAGR long-term return potential (better than the Nasdaq)
- historical returns of 12% to 13% CAGR for the last 16 years (using the worst managed futures fund, 2% to 3% higher with DBMF or other 4 or 5 star rated funds)
- 75% likely to beat the S&P 500 over the next 50 years
- 96% likely to beat a 60/40 over the next 50 years
- less than 1% chance of falling 40+% in the next 75 years
- 11% chance of falling 20+% in the next 75 years
- 23% peak decline in the Great Recession Vs. 56% S&P and 44% 60/40
- 33% to 66% smaller peak declines than the S&P through five bear markets.
The key to retiring rich and staying rich in retirement is 100% fundamentals.
- the right asset allocation for your risk profile and goals
- the best combination of world-beater blue-chip assets that meet those goals
- sufficient yield for your goals
- sufficient growth for your goals
- reasonable to attractive valuation
- annual rebalancing (or whatever periodic schedule works best for you)
There is no need to try to time the market (98% of people fail at this).
There is no need to pray for luck on Wall Street.
There is no need to obsess over interest rates and curse the Fed.
There is no need to lose sleep over inevitable but unpredictable market downturns.
When you own the right diversified and prudently risk-managed blue-chip portfolio you command the work of tens of millions of employees from around the world.
From every corner of the globe doth your dividends flow.
And the world’s best, most adaptable, and trustworthy management teams are working hard for you, so that one day you don’t have to.
Centuries ago we had a word for those who could command the labor of millions and would receive cash tributes from every corner of the globe.
- they were called emperors
- some were self-proclaimed god-kings (like Persian emperor Xerxes the 1st)
Today such people are called long-term blue-chip dividend growth investors… 😉
Be the first to comment