

holgs
In this analysis of Samsung Electronics Co., Ltd. (OTCPK:SSNLF) (OTCPK:SSNNF), we covered the company’s semiconductor business following its recent announcement of the company’s planned investments in the US which could be worth $192.1 bln over the next 20 years. We examined its foundry business and projected the company’s growth.
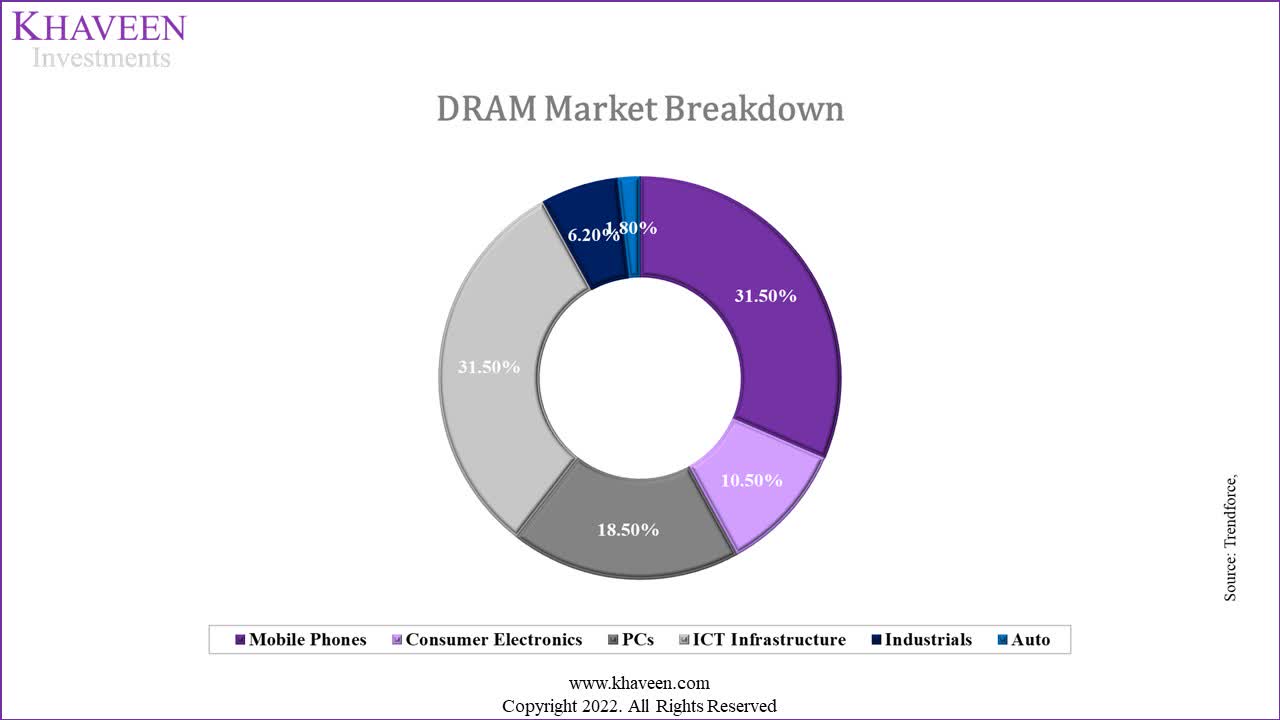
Moreover, we examined the company’s memory semiconductor business segment following the weak guidance provided by competitors Micron and SK Hynix. We analyzed the DRAM and NAND market demand drivers in PC, smartphone, ICT Infrastructure, and automotive end markets.
Lastly, we analyzed the company’s display panel business segment as the company indicated its positive outlook with new smartphone launches and entry into automotive LED markets. We examined its automotive LED products and projected its display panel revenue growth.
Major Foundry Expansion to Benefit from US Government Assistance
Previously, Samsung announced in 2021 that it was investing $17 bln to build a fab in Texas. Samsung was recently reported to be planning to build 11 new production lines in Texas over the next 20 years. According to Business Korea, the proposed investments total $192.1 bln with $167 bln for nine facilities in Taylor and $24.5 bln to increase production in Austin.
In our previous analysis, we analyzed its planned investments of $151 bln over the next 10 years for its foundry business and projected its wafer capacity growth based on its planned investments and historical incremental wafer capacity per capex to forecast its 10-year CAGR. We updated our projection of the company’s planned investments to include the $192.1 bln investments in the US, which we assumed includes the initial investment of $17 bln, prorated across 20 years and derived a new CAGR of 8.8% for its capacity growth which is higher compared to our previous forecast of a CAGR of 6%.
|
Projections of Wafer Capacity |
Samsung Foundry |
|
Planned Investments ($ bln) (‘a’) |
230 |
|
Incremental Capacity (2020) (‘b’) |
30.31 |
|
Capex (2020) (‘c’) |
6.8 |
|
Incremental Capacity/Capex (Kwpm/$bln) (‘d’) |
4.48 |
|
Incremental Capacity (‘e’) |
1,031 |
|
Capacity (2021E) |
783 |
|
CAGR |
8.8% |
* d = b /c
* e = a x d
Source: IC Insights, Samsung, Khaveen Investments
Following the US CHIPS Act 2022, US chipmakers and foreign companies such as TSMC (TSM) and Samsung are likely beneficiaries of the subsidies and tax credit according to Protocol. We determined the potential benefit to Samsung by estimating its share of the subsidies based on the planned investments in the US as seen in the table below. For Samsung, we prorated its planned investments of $192.1 bln by 10 years and estimated its share to be 39.4%.
|
Company |
Planned Investments |
Share |
|
GLOBALFOUNDRIES (GFS) |
1.0 |
0.4% |
|
Intel (INTC) |
42.5 |
17.5% |
|
Micron (MU) |
40.0 |
16.4% |
|
Samsung |
96.1 |
39.4% |
|
SK Hynix |
22.0 |
9.0% |
|
TSMC (TSM) |
12.0 |
4.9% |
|
Texas Instruments (TXN) |
30.0 |
12.3% |
|
Total |
243.6 |
100% |
Source: Company Data, Khaveen Investments
We then estimated the subsidy amount for Samsung by multiplying its estimated share of investments (39.4%) by the total subsidy amount of $19 bln in 2022 and $5 bln subsequently through 2026. We subtracted this subsidy amount from our estimate of its US semiconductor capex amount of $9.6 bln per year ($192.1bln divided by 20 years) to obtain its net capex in the US. From that, we subtracted the change of its capex from our estimated total Samsung semiconductor capex ($230 bln divided by 10 years). Additionally, we added Samsung’s capex for its other segments based on its 10-year average of 4.2% of total revenue. Overall, we forecasted its capex as a % of revenue to decline to 12.3% from 13.2% in 2022.
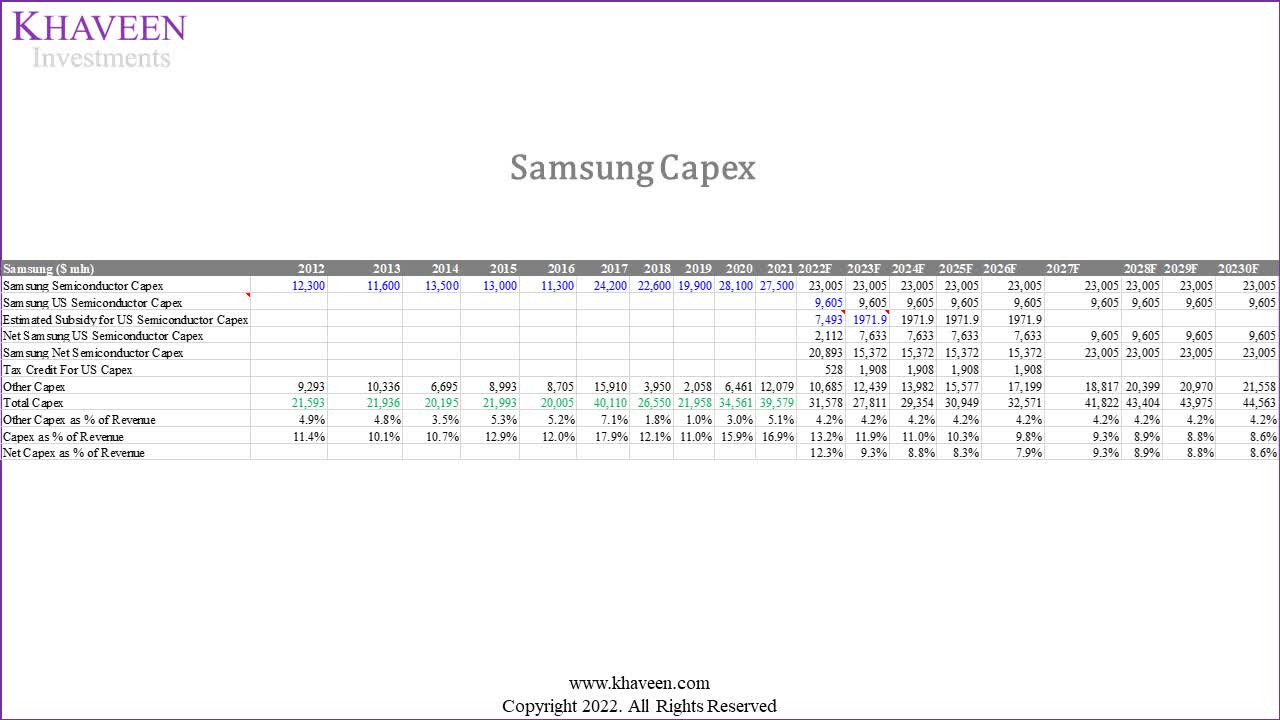
Samsung, Khaveen Investments
Moreover, we forecasted the company’s effective tax rate in the table below with the impact of the 25% tax credits on our estimate of Samsung’s US capex. As seen below, we estimated the company’s effective tax rate to reduce to 23.2% in 2022 from 24.3% based on its 10-year average.
|
Samsung ($ mln) |
2022F |
2023F |
2024F |
2025F |
2026F |
2027F |
2028F |
2029F |
20230F |
|
EBT |
47,712 |
60,203 |
71,859 |
83,554 |
95,150 |
106,480 |
116,037 |
118,302 |
120,909 |
|
Effective Tax (Before Tax Credits) |
11,596 |
14,632 |
17,465 |
20,308 |
23,126 |
25,880 |
28,202 |
28,753 |
29,387 |
|
Effective Tax Rate (Before Tax Credits) |
24.3% |
24.3% |
24.3% |
24.3% |
24.3% |
24.3% |
24.3% |
24.3% |
24.3% |
|
Effective Tax (After Tax Credits) |
11,068 |
12,724 |
15,557 |
18,399 |
21,218 |
25,880 |
28,202 |
28,753 |
29,387 |
|
Effective Tax Rate (After Tax Credits) |
23.2% |
21.1% |
21.6% |
22.0% |
22.3% |
24.3% |
24.3% |
24.3% |
24.3% |
Source: Company Data, Khaveen Investments
Furthermore, in terms of ASPs, Samsung was reported to be raising its prices by 15% to 20% where legacy processes would get a higher price hike and leading-edge nodes with a lower increase. This is as the company launched its 3nm process built with gate all around (‘GAA’) technology and 3nm planned for volume production in 2025. Moreover, TSMC was believed to be negotiating price increases of between 5% to 9% in 2023. We updated our projections of Samsung’s foundry business with the capacity CAGR and ASP assumption in 2022 and 2023.
|
Samsung Foundry Revenue Forecast ($ mln) |
2021 |
2022F |
2023F |
2024F |
2025F |
2026F |
|
Foundry Revenue |
18,796 |
24,020 |
27,952 |
30,401 |
33,064 |
35,960 |
|
Growth % |
33.7% |
27.8% |
16.4% |
8.8% |
8.8% |
8.8% |
|
Estimated Foundry Capacity Growth % |
8.76% |
8.76% |
8.76% |
8.76% |
8.76% |
|
|
Foundry ASP Growth % |
17.50% |
7.00% |
0.00% |
0.00% |
0.00% |
Source: IC Insights, Samsung, Khaveen Investments
All in all, with the passage of the US CHIPS Act 2022, Samsung is expected to benefit following the report of its planned $192.1 bln in investments to expand its foundry manufacturing capacity in the US. We estimated its share of the subsidies based at 39.4% and expect it to be a key beneficiary of the planned investments of the semicon companies in the US. we forecasted its capex as a % of revenue to decline to 12.3% from 13.2% in 2022 and its effective tax rate to reduce to 23.2% in 2022 from 24.3% based on its 10-year average.
Trendforce, Khaveen Investments
Strong Memory Business Drivers Despite Near-Term Headwinds
Based on Samsung’s latest earnings briefing, the company highlighted its memory business outlook reading solid for server demand but consumer products had weakened due to “widening impacts of macro issues”. It added that its bit growth for DRAM and NAND was below guidance but supported by server demand. The company’s management guided that it expected server demand to remain solid as investments in infrastructure continue but demand for PC and mobile are likely to weaken. The company indicated that it would manage supply flexibility. In comparison, SK Hynix and Micron also echoed the weak outlook for memory and plans to reduce capex. Micron’s management stated that it plans to supply growth and use existing inventory to fill demand. Despite the near-term headwinds to the market with declining PC and mobile shipment growth forecasted as covered in our previous analysis of Micron, we examined the capacity growth of memory products and determined the long-term drivers of the memory market by end market.
Smartphone
DRAM
In our analysis of Micron, we highlighted
the advancement of mobile connectivity as another driver of rising DRAM growth. For example, Micron stated that 5G phones feature 50% more DRAM content than 4G phones for increased data bandwidth handling capabilities and is also supported by Cowen. Besides that, it expects 5G and AI to drive new applications such as optimized video capture and editing fueling greater DRAM requirements.
According to data from Counterpoint Research, the average DRAM capacity in smartphones (iOS and Android) has increased by a CAGR of 20.9% in the past 2 years.
NAND
In terms of NAND for smartphones, we previously analyzed that
NAND content in smartphones has continuously risen driven by increasing storage requirements to handle rising data volume creation. The continued rise in storage capacity is expected to be driven by increasing camera capabilities, high-capacity apps, as well as the development of 5G and, AI requiring high-capacity storage to support high-speed communication, big data and machine learning applications.
Based on data of the average smartphone NAND capacity (iOS and Android), it has increased at a CAGR of 29.4% in the past 6 years. We projected the smartphone DRAM and NAND growth based on our derived historical CAGR and market shipment forecasts.
|
Smartphone DRAM and NAND |
2021 |
2022F |
2023F |
2024F |
2025F |
2026F |
|
Unit Sales (‘mln’) |
1,352 |
1,335 |
1,341 |
1,348 |
1,355 |
1,362 |
|
Growth Rate |
5% |
-3.5% |
1.9% |
1.9% |
1.9% |
1.9% |
|
Smartphone DRAM Content Growth % |
20.89% |
20.89% |
20.89% |
20.89% |
20.89% |
20.89% |
|
Total Smartphone DRAM Growth % |
26% |
17% |
23% |
23% |
23% |
23% |
|
Smartphone NAND Content Growth % |
29.4% |
29.4% |
29.4% |
29.4% |
29.4% |
29.4% |
|
Total Smartphone NAND Growth % |
35% |
25% |
32% |
32% |
32% |
32% |
Source: Khaveen Investments
ICT (Data Center)
DRAM
According to OpenAI, artificial intelligence (‘AI’) and machine learning training capability have increased by a CAGR of 506% between 2012 and 2019. High memory bandwidth and low latency GPUs are required to get from raw data to analytics to action in the fastest time possible. To optimize performance, the GPUs must be paired with the right type and amount of memory as different GPUs have different memory requirements. We calculated the CAGR of data center DRAM at 28.7% based on a 518GB module and 32GB module in the past 11 years.
NAND
According to Seagate, the growth of data volumes is driving the growth of structured and unstructured data. Thus, mass storage is becoming more critical across cloud infrastructures to deploy storage solutions. According to the IDC, over 90% of storage data is stored on HDDs in cloud data centers. We calculated the growth in HDD capacity based on Seagate’s 20TB product launched in 2021 with a 2TB product in 2012 and calculated a CAGR of 29.2%. We projected the ICT infrastructure DRAM and NAND growth based on our derived historical CAGR and market shipment forecasts.
|
Server |
2022F |
2023F |
2024F |
2025F |
2025F |
|
Shipment Growth |
5.10% |
5.10% |
5.10% |
5.10% |
5.10% |
|
Server DRAM Content Growth % |
28.7% |
28.7% |
28.7% |
28.7% |
28.7% |
|
Total Server DRAM Content Growth % |
35.2% |
35.2% |
35.2% |
35.2% |
35.2% |
|
Server NAND Content Growth |
29.2% |
29.2% |
29.2% |
29.2% |
29.2% |
|
Total Server NAND Content Growth % |
35.7% |
35.7% |
35.7% |
35.7% |
35.7% |
Source: Khaveen Investments
PC
DRAM
RAM in PCs is needed to improve computer speed when using multiple programs or browsing the computer. Also, memory-intensive tasks such as gaming and Photoshop consume large memory. Since 2010, the maximum capacity of RAM sticks had increased from 1GB to 16GB in 2021, representing a CAGR of 32%.
NAND
Storage devices like hard disks are needed to
install operating systems, programs and to save documents.
According to Statista, the average hard disk capacity of Seagate (STX) had increased at a CAGR of 32.3% in the past 7 years. We projected the PC DRAM and NAND growth based on our derived historical CAGR and market shipment forecasts.
|
PC |
2021 |
2022F |
2023F |
2024F |
2025F |
2026F |
|
Unit Sales (‘mln’) |
342 |
314 |
325 |
336 |
348 |
360 |
|
Growth Rate |
10.65% |
-8.20% |
3.50% |
3.50% |
3.50% |
3.50% |
|
PC DRAM Content Growth % |
31.95% |
31.95% |
31.95% |
31.95% |
31.95% |
31.95% |
|
Total PC DRAM Content Growth % |
46% |
21% |
37% |
37% |
37% |
37% |
|
PC NAND Content Growth |
32.29% |
32.29% |
32.29% |
32.29% |
32.29% |
32.29% |
|
Total PC NAND Content Growth % |
46% |
21% |
37% |
37% |
37% |
37% |
Source: Khaveen Investments
Automotive
DRAM
According to Trendforce, automotive DRAM is
driven by such factors as the continued development of autonomous driving technologies and the build-out of 5G infrastructure, the demand for automotive memories will undergo a rapid growth going forward.
Trendforce forecasts that the average DRAM content of cars will continue to grow in the next three years, with a CAGR of more than 30% for the period.
NAND
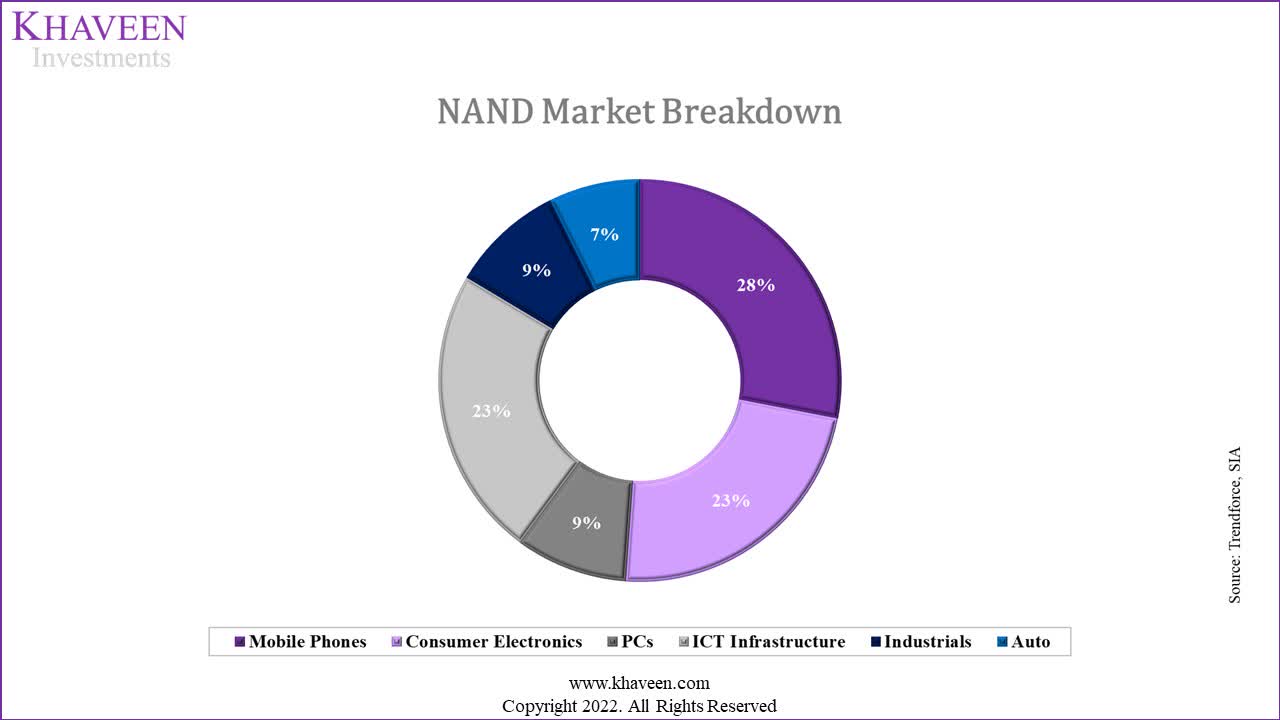
In our previous analysis, we analyzed the automotive NAND driven by
the rise of ADAS and clusters of vehicle instruments added to infotainment requires greater storage capabilities. Although automotive only accounts for 7% of the NAND market, it is projected to see rapid growth due to the continued advancements in automotive technologies. Based on Yole Development, the average NAND bit demand is expected to grow to 97GB in 2027 from just 2GB in 2019.
We projected the automotive DRAM and NAND growth based on our derived historical CAGR and market shipment forecasts.
|
Automotive |
2021 |
2022F |
2023F |
2024F |
2025F |
2026F |
|
Unit Sales (‘mln’) |
85.37 |
88.04 |
89.07 |
90.12 |
91.19 |
92.30 |
|
Growth Rate |
10.0% |
3.1% |
1.2% |
1.2% |
1.2% |
1.2% |
|
Auto DRAM Content Growth % |
30.0% |
30.0% |
30.0% |
30.0% |
30.0% |
30.0% |
|
Total Auto DRAM Content Growth % |
43.0% |
34.1% |
31.5% |
31.5% |
31.5% |
31.6% |
|
Auto NAND Content Growth |
67% |
80% |
89% |
82% |
58% |
43% |
|
Total Auto NAND Content Growth % |
83.3% |
85.6% |
91.1% |
84.5% |
59.9% |
44.6% |
Source: Khaveen Investments
In the following table, we summarized our projections of the DRAM and NAND demand growth based on the market breakdown of DRAM and NAND by end markets. We projected the growth for the PC, smartphone, automotive and ICT Infrastructure based on our forecast of their content growth and unit shipment growth. Whereas for Industrial and Consumer Electronics, we based it on the market forecast CAGR of 1.7% and 7.2% respectively.
Trendforce, Khaveen Investments
Trendforce, Khaveen Investments
|
DRAM |
2021F |
2022F |
2023F |
2024F |
2025F |
2026F |
|
Mobile Phones |
26.4% |
16.7% |
23.2% |
23.2% |
23.2% |
23.2% |
|
Consumer Electronics |
7.2% |
7.2% |
7.2% |
7.2% |
7.2% |
7.2% |
|
PCs |
46.0% |
21.1% |
36.6% |
36.6% |
36.6% |
36.6% |
|
ICT Infrastructure |
19% |
35% |
35% |
35% |
35% |
35% |
|
Industrials |
1.70% |
1.70% |
1.70% |
1.70% |
1.70% |
1.70% |
|
Auto |
43% |
34% |
32% |
32% |
32% |
32% |
|
Total DRAM Shipment Growth % |
24.6% |
21.7% |
26.6% |
26.6% |
26.6% |
26.6% |
|
NAND |
2021F |
2022F |
2023F |
2024F |
2025F |
2026F |
|
Mobile Phones |
35.3% |
24.9% |
31.9% |
31.9% |
31.9% |
31.9% |
|
Consumer Electronics |
7.2% |
7.2% |
7.2% |
7.2% |
7.2% |
7.2% |
|
PCs |
46% |
21% |
37% |
37% |
37% |
37% |
|
ICT Infrastructure |
19.4% |
35.7% |
35.7% |
35.7% |
35.7% |
35.7% |
|
Industrials |
1.70% |
1.70% |
1.70% |
1.70% |
1.70% |
1.70% |
|
Auto |
83.3% |
85.6% |
91.1% |
84.5% |
59.9% |
44.6% |
|
Total NAND Shipment Growth % |
29.7% |
27.2% |
31.9% |
31.4% |
29.6% |
28.4% |
Source: Khaveen Investments
Furthermore, we updated our projections of Samsung’s DRAM and NAND revenues through 2025 with the demand forecasts and our assumptions for the DRAM ASP in 2022 to be 0% as a conservative estimate as discussed in our analysis in Micron before recovering in 2023 based on the long-term DRAM trend.
|
NAND and DRAM Market Revenues ($ mln) |
2021 |
2022F |
2023F |
2024F |
2025F |
|
NAND ASP Growth % |
-1.7% |
-1.7% |
-1.7% |
-1.7% |
|
|
NAND Shipment Growth % |
27.2% |
31.9% |
31.4% |
29.6% |
|
|
Samsung NAND Revenue |
23,177 |
28,988 |
37,582 |
48,544 |
61,841 |
|
Growth % |
25.2% |
25.1% |
29.6% |
29.2% |
27.4% |
|
DRAM ASP Growth % |
0.0% |
18.7% |
4.9% |
4.7% |
|
|
DRAM Shipment Growth % |
21.7% |
26.6% |
26.6% |
26.6% |
|
|
Samsung DRAM Revenue |
40,840 |
49,713 |
74,724 |
99,247 |
131,530 |
|
Growth % |
42.6% |
21.7% |
50.3% |
32.8% |
32.5% |
Source: Khaveen Investments
All in all, we projected Samsung’s DRAM revenue growth to slow in 2022 with the impact of the slowdown in PC and smartphone market shipments and lower ASP projection. In NAND, we projected its revenue growth to be 25.1% in 2022 which is slightly lower compared to 2021.
LED Business Segment Supported by New Smartphone Launches and Expansion in Automotive
Khaveen Investments
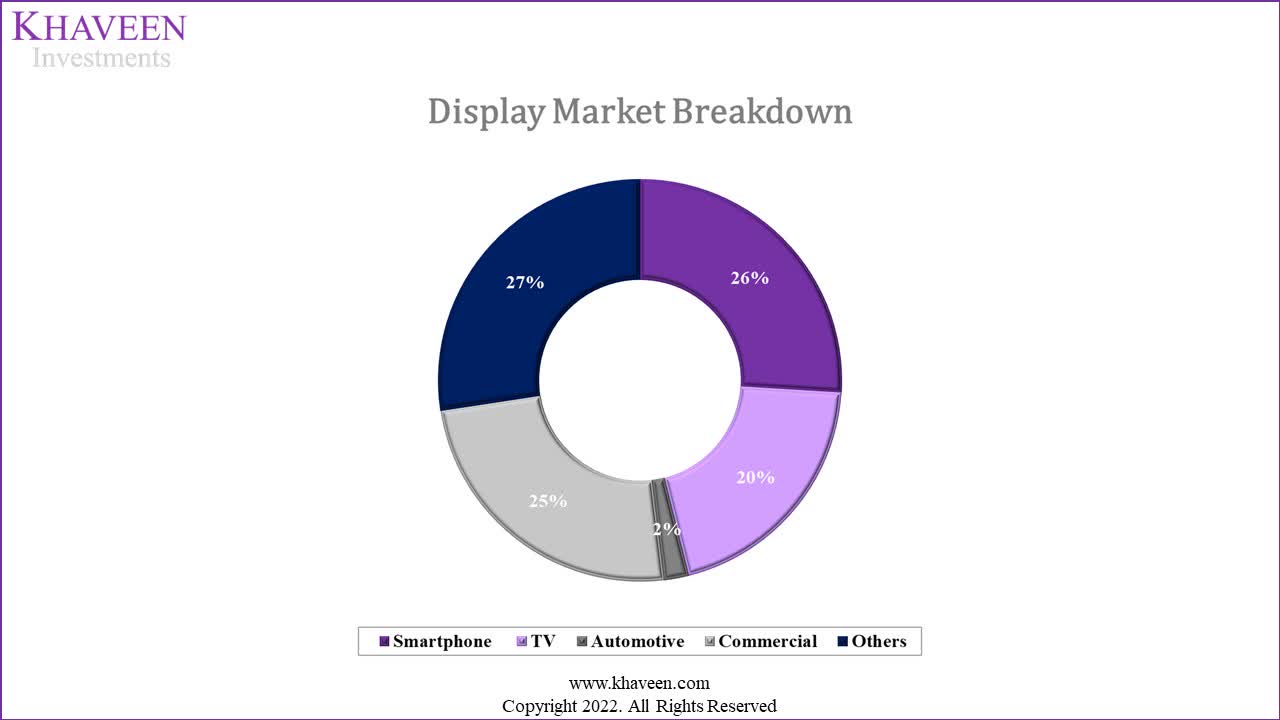
In the chart above, we broke the down display market valued at $177.1 bln in 2021 according to Markets and Markets into the major end markets including smartphone, TV, commercial and automotive. Based on the chart, the smartphone display is the largest end market accounting for 26% of the total display market followed by commercial and TV whereas automotive is the smallest at only 2%. Based on the company’s earnings briefing, the company attributed its growth in its Display segment to demand customer flagship smartphones. The company’s management highlighted its outlook to be supported by new smartphone launches and adoption in new applications such as IT, automotive and gaming.
Results to grow with the release of new products by major smartphone customers; expansion of the customer base for foldables, and increase in adoption in new application areas such as IT, automotives, and gaming – Samsung
In our previous analysis of Samsung, we noted that the company dominated the smartphone display market with a 49% market share in 2021 ahead of competitors such as BOE and LG. According to Omdia, OLED smartphones are expected to grow to 794 mln by 2025, which we estimate to reach a penetration rate of 51.2% of the total smartphone market, growing at a CAGR of 10.4% from 2021. According to Android Authority, LED has several advantages over LCD including colour gamut, contrast ratio and refresh rates. Also, it highlighted the falling cost of manufacturing.
The falling production costs and additional benefits of OLED displays have made them a more popular choice than ever across a wide range of price segments. OLED dominates the high-end smartphone and TV spaces owing to its wider color gamut, superior contrast ratio, while still supporting decent refresh rates – Android Authority
In smartphone displays, Samsung offers active-matrix OLED (AMOLED) displays, a type of OLED since the launch of the M7500 Emporio Armani in 2008. In comparison, LG’s displays are called Passive-matrix OLED (POLED). According to Ars Technica, passive-matrix are cheaper and are easier to produce but AMOLED displays have superior image quality. We believe that although AMOLED is more expensive than POLED to produce, Samsung’s position as one of the leading smartphone makers (22% market share) makes it well-positioned to develop these displays for its own consumption. In 2017, China-based BOE started production of AMOLED displays and supplied to customers including Huawei, Oppo, and Vivo.
In the newest smartphone models, Samsung developed LTPO (Low-Temperature Polycrystalline Oxide) OLED which is used in premium smartphone models such as the S22, S21, iPhone 13, Pixel Pro 6 and Xiaomi (OTCPK:XIACF) 12 Pro. Recently, Samsung was reported to ship 80 mln OLED displays for Apple’s (AAPL) upcoming iPhone. According to Digital Trends, Samsung supplied 80% of the iPhone’s OLED display with the other using LG displays. BOE started supplying Apple with OLED panels but did not use them for its top-tier models which used a more advanced LTPO (Low-Temperature Polycrystalline Oxide) display technology. However, BOE has also developed its new LTPO OLED displays which are featured in Chinese smartphones such as Honor. Though, in terms of brightness, Samsung’s displays are brighter with a max of 1,750 nits compared to 1,000 peak brightness for BOE.
Trendforce
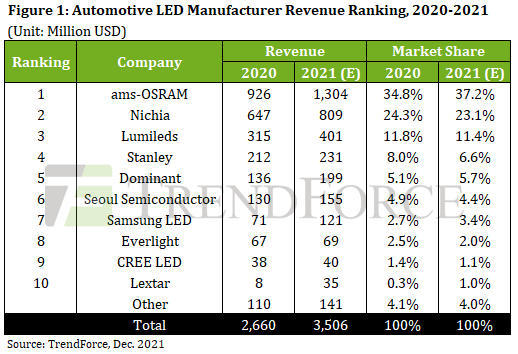
In the automotive LED market, Samsung competes against more dominant companies such as ams (OTCPK:AMSSY), Nichia, Lumileds, etc. Compared to the smartphone display market, the automotive LED market is projected to grow at a faster rate with a forecast CAGR of 8% compared to 5.7% for the smartphone display market according to Research and Markets. According to Trendforce, the penetration rate of LED was 60% in 2021 while NEV exceeded 90%. In automotive vehicles, LEDs are brighter than halogen headlights which results in better visibility and safety for drivers.
Moreover, in TV displays, Samsung was reported to be exiting its LCD TV panel business due to strong competition from cheaper products from China. Its market share fell from 22% to around 2% in 2022 according to Omdia. Though, the company is focusing on the premium segment with its QD-OLED technology which offers greater brightness and color than OLED. We believe this is positive for Samsung as we previously discussed the advantages of OLED vs LCD displays for TVs and the expected shift from LCD to OLED TVs.
We updated our forecast of the company’s display panel business from our previous analysis. For its smartphone display, we based it on the smartphone market forecast of -3.5% in 2022 followed by a long-term CAGR of 3.5%. Also, we projected its automotive revenue growth based on the market CAGR of 8% while for the TV display segment, we based it on the market forecast CAGR of 7.4% by Omdia. For other display revenue growth, we based it on the total display market forecast CAGR.
|
Samsung Display Panel Revenue Projections |
2021 |
2022F |
2023F |
2024F |
2025F |
|
Smartphone Display |
22.5 |
21.8 |
22.5 |
23.3 |
24.1 |
|
Growth % |
4.8% |
-3.5% |
3.5% |
3.5% |
3.5% |
|
Automotive |
0.121 |
0.131 |
0.141 |
0.152 |
0.165 |
|
Growth % |
8.0% |
8.0% |
8.0% |
8.0% |
|
|
TV Display |
0.71 |
0.77 |
0.82 |
0.88 |
0.95 |
|
Growth % |
7.4% |
7.4% |
7.4% |
7.4% |
|
|
Other Display Revenue |
3.4 |
3.5 |
3.6 |
3.7 |
3.9 |
|
Growth % |
3.50% |
3.50% |
3.50% |
3.50% |
|
|
Total Display Revenue |
26.75 |
26.1 |
27.1 |
28.1 |
29.1 |
|
Growth % |
0.5% |
-2.3% |
3.6% |
3.6% |
3.6% |
Source: Samsung, Khaveen Investments
Risk: Uncertainty in DRAM and NAND Demand
According to the company’s management, it expects weakness in its outlook for its DRAM and NAND businesses weighed down by the consumer market. This is similar to Micron which guided weakness in consumer electronics such as PC and smartphones, forecasted to decline by -8.2% and -3.5%, respectively, in terms of shipments in 2022. In its latest earnings report, the company’s management highlighted its outlook for server demand to remain strong.
Fundamental server demand to stay solid as investments in new growth areas and core infrastructure are expected to continue, but demand for PC and mobile is likely to weaken due to weakened consumer sentiment caused by macro issue. – Samsung Q2
However, SK Hynix’s management expects memory chip demand for servers to slow down as customers cut costs and reduce investments due to poor macroeconomic outlook concerns. Additionally, Micron also guided recently that its Q4 FY2022 results are expected to be lower than previous guidance. Thus, we believe a potential demand slowdown could affect the revenue growth outlook of Samsung in 2022 in DRAM and NAND with the market slowdown.
Valuation
We updated our revenue projections with our latest projections for its semiconductor businesses including foundry, DRAM, NAND, and display panel. Compared to our previous projections, we obtained a higher 5-year forward average of 12.5% compared to 8.1% previously. Based on our forecasts, we expect most of its growth to be contributed by its semiconductor business segments such as DRAM, NAND, and Foundry segments which we believe is reasonable with the expansion and planned investments of the company.
|
Segment Revenue |
2021 |
2022F |
2023F |
2024F |
|
Consumer Electronics |
47.06 |
48.6 |
50.2 |
51.9 |
|
Growth % |
12.5% |
3.3% |
3.3% |
3.3% |
|
IT |
3.86 |
4.1 |
4.3 |
4.6 |
|
Growth % |
25.7% |
5.7% |
5.7% |
5.7% |
|
Mobile communications |
88.24 |
93.37 |
98.80 |
104.54 |
|
Growth % |
6.4% |
5.8% |
5.8% |
5.8% |
|
DRAM |
40.84 |
49.71 |
74.72 |
99.25 |
|
Growth % |
42.6% |
21.7% |
50.3% |
32.8% |
|
NAND |
23.18 |
28.99 |
37.58 |
48.54 |
|
Growth % |
25.2% |
25.1% |
29.6% |
29.2% |
|
Foundry |
18.80 |
24.02 |
27.95 |
30.40 |
|
Growth % |
33.7% |
27.8% |
16.4% |
8.8% |
|
Display Panel |
26.75 |
26.14 |
27.09 |
28.08 |
|
Growth % |
0.5% |
-2.3% |
3.6% |
3.6% |
|
Harman |
8.46 |
8.73 |
9.00 |
9.28 |
|
Growth % |
5.9% |
3.1% |
3.1% |
3.1% |
|
Less: Ukraine Conflict Risk |
3.3 |
3.3 |
3.3 |
|
|
Total |
257.18 |
280.38 |
326.41 |
373.28 |
|
Growth % |
15.0% |
9.0% |
16.4% |
14.4% |
Source: Samsung, Khaveen Investments
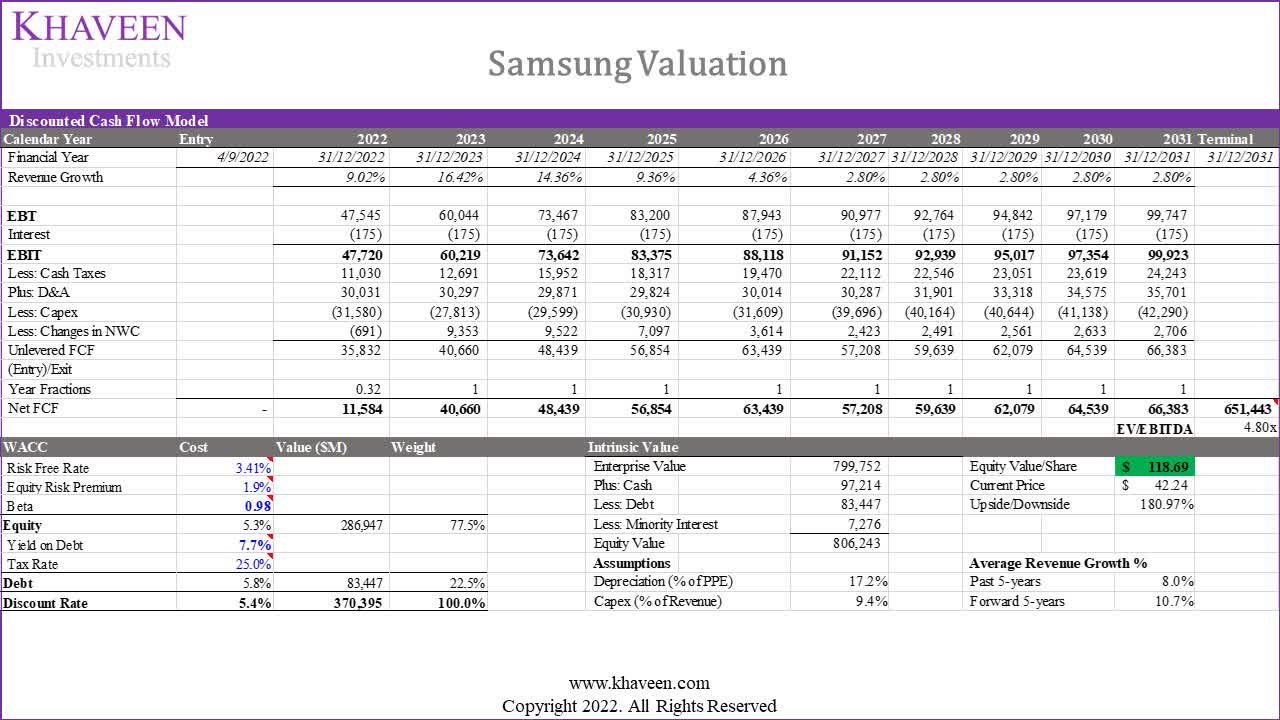
We updated our valuation based on DCF as we expect the company to continue to have positive FCFs. We based its terminal value on its 3-year average EV/EBITDA of 4.8x. For our capex assumptions, we projected it to be lower at a 5-year forward average of 9.3% with the contribution of subsidies from the US CHIPS Act compared to 11.2% without subsidies.
Based on a discount rate of (5.4%), our model shows an upside of 181%.
Khaveen Investments
Verdict
To conclude, we expect Samsung to be a key beneficiary of the US CHIPS Act 2022 with an estimated share of 39.4% of subsidies following the report of its planned $192.1 bln expansion in the US for its foundry business and projected its capex and effective tax to decline with subsidies and tax credits. Moreover, we forecasted its DRAM and NAND segments based on the breakdown by end markets including PC, smartphone, ICT infrastructure and automotive which we projected based on its content growth CAGR and market shipment growth forecast. Lastly, we analyzed its display panel business and forecasted it to decline by -2.3% in 2022 with the smartphone display accounting for the largest segment. While the company’s stock price had declined by 22% over the past 1 year, we still maintain our Strong Buy rating for the company with a price target of $118.69 (KRW161,599 on the Korea Exchange) with an upside of 181%.
Be the first to comment