

Royce Investment Partners Ultima_Gaina/iStock via Getty Images
Our Blue Harbinger Income Equity portfolio has significantly outperformed the S&P 500 this year. There are a lot of factors that have contributed to the outperformance, and one of them is the strategy’s noticeable omission of small cap stocks. However, there is growing evidence to believe now is an attractive time to add an allocation to small cap stocks within your portfolio. In this report, we review a very attractive way to do that (particularly if you are an income-focused investor) via the Royce Value Trust (as well as its sister fund, the Royce Micro-Cap Trust). We conclude with our strong opinion on investing.
Why Small Caps Now?
Here is a look at the 10-year performance (total returns: price appreciation plus dividends reinvested) of large cap stocks (generally $10 billion market caps and above) as measured by the S&P 500 (SPY) versus small cap stocks (generally market caps of $2-$3 billion or less) as measured by the Russell 2000 (IWM). And as you can see, small caps have been underperforming in recent years.
YCharts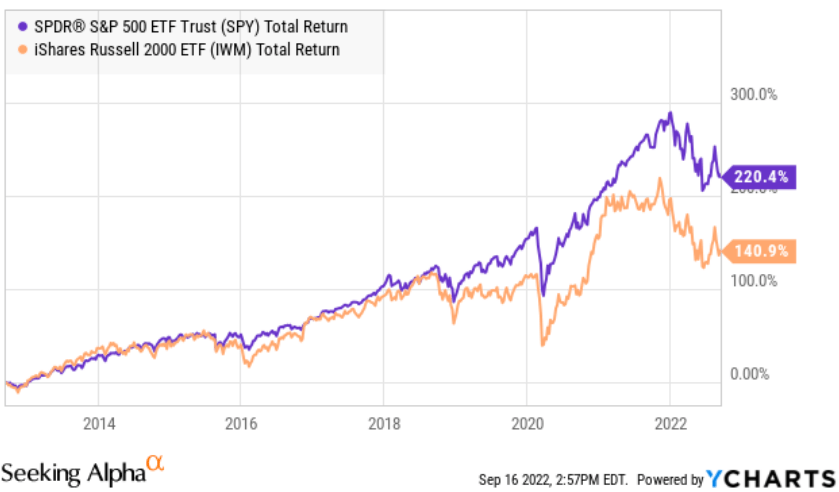
And not only is it often worthwhile to consider underperforming stocks as an attractive contrarian investment opportunity, but in this case, there is compelling data-driven evidence to suggest now is a really good time to consider investing in small caps.
For example, here is a look at the 25-year performance of various market cap and style strategies, and as you can see—only small-cap value and small-cap are cheaper than their historical average.
data as of 6/30/22 (Royce Funds)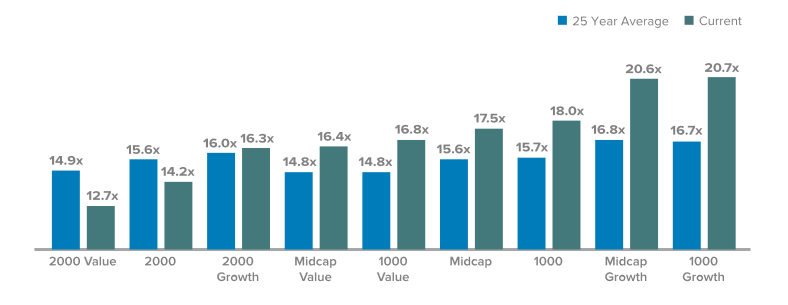
However, there is more. Here is a look at the “Subsequent Average Annual Three-Year Return for the Russell 2000 (Small Caps) Based on Average Stock Decline From 52-Week High Range.” Basically, when small caps are down a lot, they tend to rebound more than other market caps, and we are currently in a period where small caps are down a lot versus large caps (as measured by the Russell 1000 index in the graphic below).
Royce Funds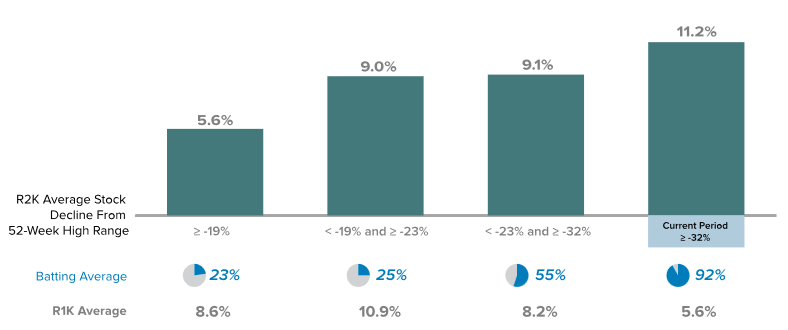
And as you can see with the “Batting Average” metric in the graphic above, this phenomenon tends to exist most of the time (i.e. 92%). Said differently, now is a very good time to consider investing in small cap stocks.
How to Invest in Small Caps Stocks
There are lots of ways to invest in small cap stocks (such as picking and choosing individual small cap stocks or investing in a passive small cap ETF such as ticker (IWM) (which basically owns all of the small cap stocks). However, one particularly attractive way to invest right now is via the high-income closed-end fund (“CEF”) Royce Value Trust (NYSE:RVT) (as well as its sister fund, the Royce Micro-Cap Trust (RMT)). We will provide more detail on RVT (and RMT) in subsequent sections of this report, but first it makes sense to review what a closed-end fund actually is.
What is a Closed-End Fund?
Closed-end funds, or CEFs, are basically a basket of stocks or bonds (often hundreds) that trade through a single vehicle—the CEF. However, there are a variety of unique characteristics about CEFs that investors should be aware of—before they invest (as we will review in the following paragraphs).
Discounts and Premiums to NAV
Perhaps the most important characteristic of a closed-end fund is that they are closed-end, which generally means they cannot easily create or eliminate new and existing shares. This is different than most mutual funds or ETFs, and it is important because it results in CEFs trading based largely on supply and demand instead of based solely on the underlying value of the things they hold (i.e. their NAV). This means, unlike most mutual funds and ETFs, CEFs often trade at wide premiums or discounts to their NAVs, and this creates unique risks and opportunities for investors.
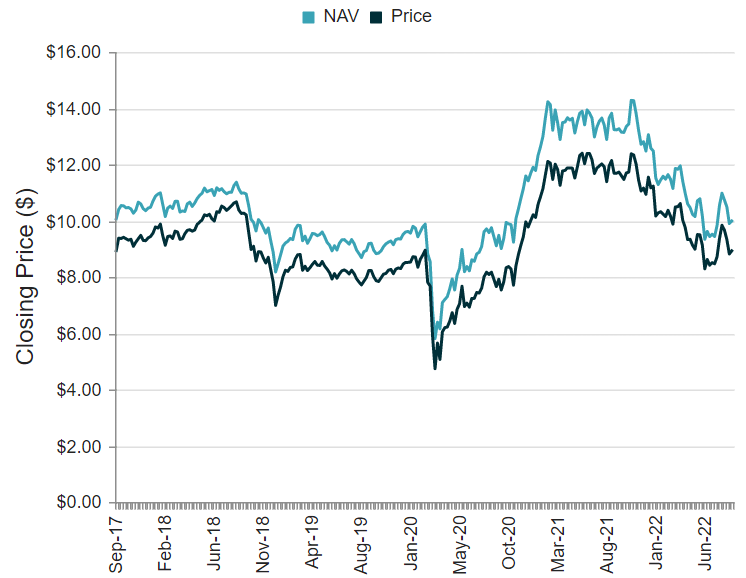
Generally speaking, we greatly prefer to buy CEFs at a discount to NAV because it means we are gaining access to the underlying holdings at a discounted price. It’s like buying something on sale—and as long as what you are buying is quality—that can be a very good thing. For example, RVT and RMT trade at attractive discounts to their current NAVs, as you can see in the following charts (an 11.2% discount for RMT and a 2.4% discount for RVT).
RVT (CEF Connect) RMT (CEF Connect)
High Distribution Yields
The next important thing to understand about CEFs is that they often offer very high yields, but these yields aren’t based totally on the dividends (or income payments) of the underlying holdings. Rather, CEFs often pay out some of their capital gains as distributions, and this allows them to keep their yields high.
Paying out capital gains (in additions to dividends) as part of a CEF distribution can be a very good thing (because it provides steady income for income-focused investors), but it needs to be monitored. For example, the distribution can consist of dividends, long-term capital gains, short-term capital gains and return of capital. All may have different tax consequences (which will be conveniently reported to you (at least annually) in form 19-a. The one thing to pay attention to is “return of capital” because this is when a CEF is returning your own initial investment dollars as part of the distribution, and this can act to reduce your cost basis so you will have a bigger (potentially unexpected) taxable capital gain when you do sell your shares. Also, it’s good to see a fund paying distributions from its excess gains instead of just returning your own capital. In the case of RMT and RMT—they both use a prudent mix of distribution sources and have done so successfully for the better part of 3 decades).
Leverage (Borrowed Money)
Leverage (or borrowed money) is another thing you have to watch for with CEFs. Prudent leverage can be acceptable, but just know it can increase returns in the good times but also increase losses in the bad times. In the case of the Royce CEFs (RVT and RMT) they both tend to use very little leverage (currently ~4.2% for RVT and 4.7% for RMT). For reference, equity CEFs generally don’t go much above 30% leverage for regulatory reasons and bond CEFs are generally limited to 50% leverage. Royce makes very prudent use of conservative leverage (to offset relatively small operating expenses while keeping the strategies invested prudently and consistently).
Expenses and Fees
It is important to note, unlike an individual stock or bond, CEFs charge management fees and other expenses. At Blue Harbinger, we avoid investments that charge high fees, and we believe the Royce Fund fees can be acceptable as long as the particular investment strategy (e.g. RVT or RMT) fits with your own personal investment portfolio goals.
The expense ratio for RVT was recently 0.63% which is acceptable for a small cap strategy.
Royce Investment Partners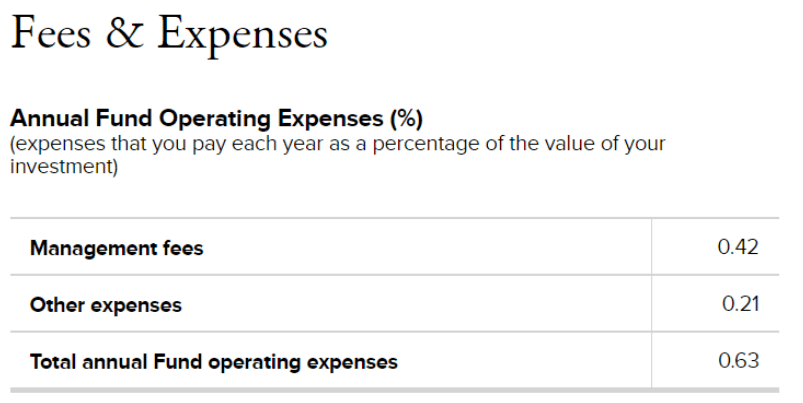
However, it’s also important and interesting to note that a portion of RVT’s management fee is performance based. Per the fund’s fact sheet, here is what Royce has to say about expenses:
-
Low Operating Expenses—Annualized operating expenses, including advisory fee, were 0.73% of average net assets applicable to common stockholders for the 12-months ended 6/30/22.
-
Performance Fee Structure—A portion of the adviser’s fee is “at risk” and is determined by the Fund’s performance relative to its benchmark, the S&P SmallCap 600 Index. In general, if the Fund outperforms the benchmark over the measurement period (a rolling 60 months), the fee is increased. If the Fund underperforms, the fee is decreased. This performance-based structure can increase or decrease the adviser’s base fee of 1.00% by up to 0.50%.
-
Negative Performance Penalty—No fee will be taken for any month in which the Fund’s performance (rounded to the nearest whole number) over the trailing 36-month period is negative. This total fee forfeiture for negative performance is unique among closed-end funds.
And the expense ratio for RMT was recently 1.06% (acceptable for a microcap strategy). And here is what RMT’s fact sheet has to say about performance fees:
-
Performance Fee Structure—A portion of the adviser’s fee is “at risk” and is determined by the Fund’s performance relative to its benchmark, the Russell 2000 Index. In general, if the Fund outperforms the benchmark over the measurement period (a rolling 36 months), the fee is increased. If the Fund underperforms, the fee is decreased. This performance-based structure can increase or decrease the adviser’s base fee of 1.00% by up to 0.50%.
Important to note, when considering expense ratios, the cost of leverage is often included in the total expense ratio, and this can increase the expense ratio significantly depending on how much leverage a strategy uses. For example, some highly-levered PIMCO bond fund strategies often have expense ratios in the 3% to 4% range (or more), but that also includes the cost of borrowing. Overall, we view the expense ratios on RVT (and RMT) to be reasonable and acceptable.
Next, let’s get into more specifics on the Royce Value Trust.
Royce Value Trust (RVT), Yield: 9.1%
This 9.1% yield CEF has been managed by the same portfolio manager (Chuck Royce) since its inception in 1986. Royce Investment Group is a recognized pioneer of small-cap investing. The fund uses a core approach that combines multiple investment themes and offers wide exposure to small-cap stocks by investing in companies with high returns on invested capital or those with strong fundamentals and/or prospects trading at what Royce believes are attractive valuations. The fund has outperformed its benchmark, the Russell 2000 Index, for the 1-, 3-, 5-, 10-, 20-, 25-, 30-, 35-years, and since inception (11/26/86) periods ended 6/30/22. The most recent quarterly dividend declared was $0.32.
Seeking Alpha
Royce Micro-Cap Trust (RMT), Yield: 10.8%
The Royce Micro-Cap Trust is also worth mentioning (because it is managed by the same team, and with a similar strategy, as RVT). This is one of the only closed-end funds dedicated to investing in micro-cap stocks (micro-cap stocks’ market caps are less than the largest stock in the Russell Microcap Index, currently around $500 million). The strategy uses a core approach that combines multiple investment themes and offers wide exposure to micro-cap stocks by investing in companies with strong fundamentals and/or prospects selling at prices that Royce believes do not fully reflect these attributes. The fund has outperformed its benchmark, the Russell 2000 Index, for the 3-, 5-, 10-, 15-, 20-, 25-year, and since inception (12/14/93) periods ended 6/30/22. The most recent quarterly dividend declared was $0.21.
Seeking Alpha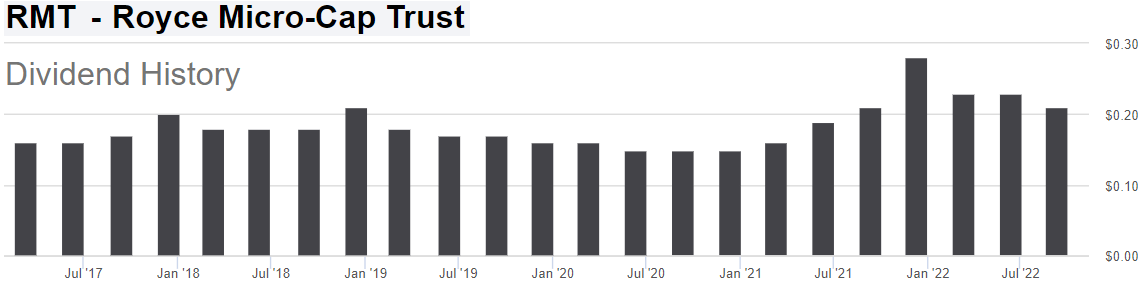
More About Royce Value Trust:
We are currently attracted to both RVT for a variety of reasons, including its large distribution yield, discounted price versus NAV, solid management team (here is an interesting video by founder Chuck Royce—who happens to be in his 80s, is supported by a strong team, and will eventually be carried out of the office in a pine box), relatively low fee, and prudent use of leverage. We also like the fund for its prudently diversified approach (it invest across sectors, has around 486 individual holdings each, and has a high “active shares” versus the index—meaning it is not a “closet index fund”).
RVT: Risk-Adjusted Performance, Delivered
Another highly-attractive quality about the Royce Value Trust is that it delivers strong risk-adjust returns. Not only does has it beaten its small cap benchmark (the Russell 2000 index), but it has done so with less volatility risk. For example, here is a look at RVT’s 10-year Sharpe Ratio and Standard Deviation.
Royce Investment Partners
Sharpe Ratio compares an investment’s return versus its volatility risk, and as you can see above, RVT provides higher return per unit of risk than does its Russell 2000 benchmark. And RVT also has simply had less volatility (as measured by its standard deviation) than its Russell 2000 benchmark. This is arguably an indication of skill by RVT’s management team. And that fact that Royce has delivered better returns (and better risk-adjusted returns) than its benchmark for such an extended period of time (e.g. 10+ years) strengthens the argument that the Royce management team has a lot of skill in picking good investments. For more perspective, here is a look at RVT’s excess return (versus its benchmark Russell 2000) and lower volatility (versus the same benchmark) since its inception.
Royce Investment Partners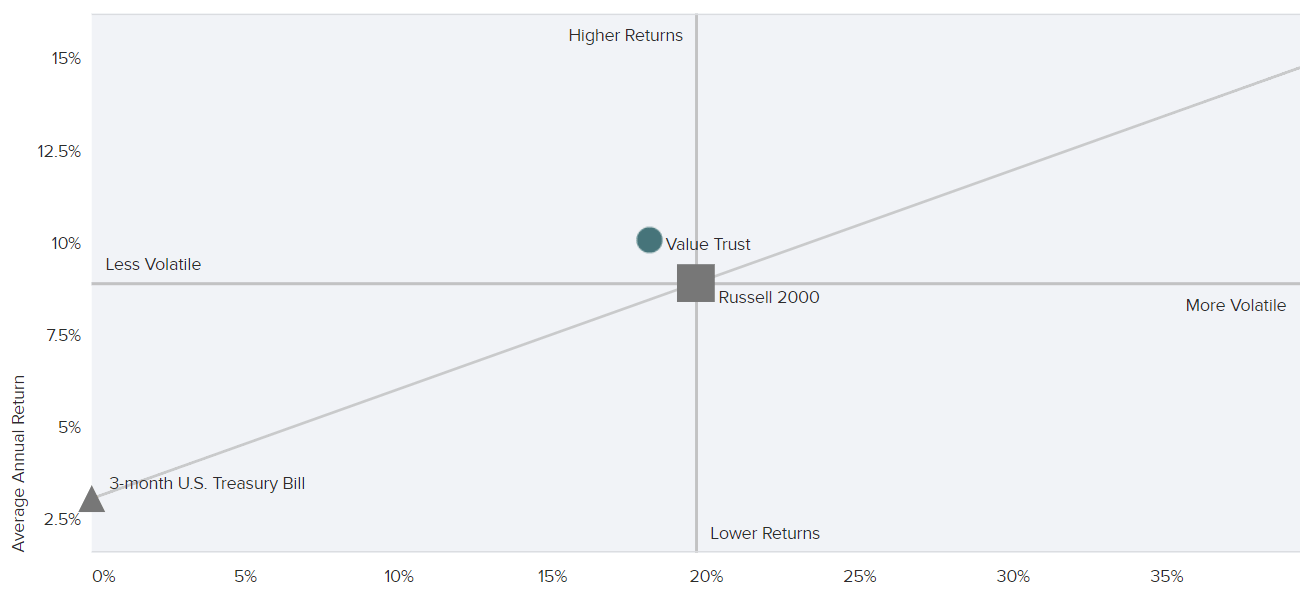
RVT: Attractive Low Turnover Ratio
Another highly-attractive quality of the Royce Value Trust is its low annual turnover ratio, most recently only 44%, as you can see in the table below.
Royce Value Trust Fact Sheet
Turnover ratio is a measure of how much buying and/or selling a portfolio management team does over the course of a year. For example, a turnover ratio of 100% equates to an average holding period of 1 year for each position in a portfolio. The lower RVT turnover ratio is an indication that it is truly more of a longer-term strategy (they are not day traders) and it also helps keep trading costs down (such as big-ask spreads, price slippage when filling large orders, frictional cash which can drag down long-term returns and others). We view the 44% turnover ratio as an attractive indication of a longer-term investment strategy, but still an active strategy (not a closet index fund).
RVT: Diversified Across Growth and Value
It’s also important to not be confused about RVT style by its name. Even though the name has “Value” in it, the fund is diversified across growth and value small-cap stocks as you can see in the following graphic.
Royce Investment Partners
This is an important distinction because it allows the management team to scour opportunities across growth and value to identify those that they believe are most attractive. And even though the strategy is fairly close to center between growth and value (the green dot above) the holdings (light green shaded area) are diversified across growth and value and mainly in the small cap space (with some micro caps and mid-caps as well). We view RVT’s approach as attractive.
Additional Attractive RVT Qualities:
A look under the hood also reveals the nature of this attractive small cap fund. For example, the top 10 holdings (see below) include stocks that are not household names, an indication of the uncommon opportunities that exist in the small cap space.
Royce Investment Partners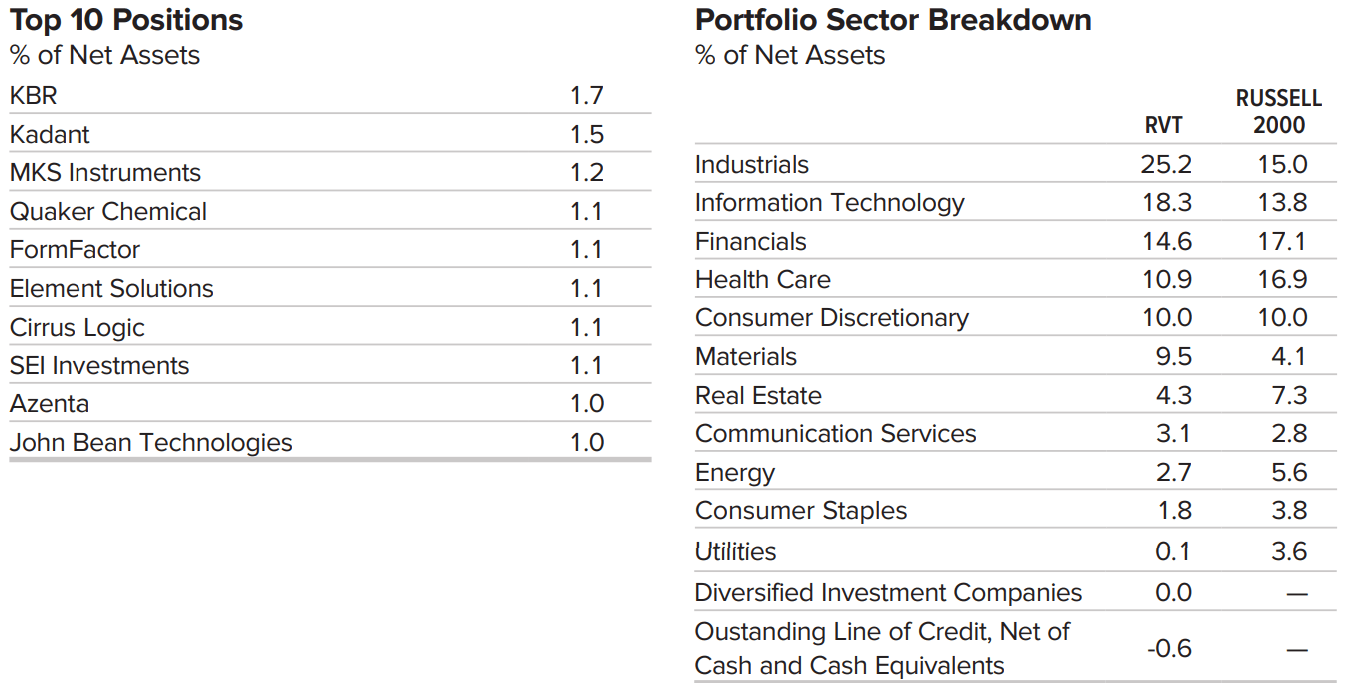
Additionally, the management team is careful to get exposure across market sectors (see above) without exactly matching the benchmark; this is a way to reduce risks (through diversification) but stay differentiated versus a benchmark to allow for potential continuing outperformance.
More About RMT
The Royce Micro-Cap Trust also exhibits many of the same attractive qualities as RVT, including a history of strong risk adjusted performance (e.g. healthy Sharpe Ratios versus its benchmark–also the Russell 2000), an attractive low turnover ratio (recently only 15% which is important because trading costs in the micro-cap space are consistently elevated), compelling diversification across growth and value (and primarily concentrated in micro-cap stocks), and a lot of unique holdings and prudent diversification versus its Russell 2000 benchmark.
Conclusion
We have owned both RVT and RMT in our Income Equity Portfolio in the past, but currently do not own either one. However, they are high on our watchlist for now considering the Income Equity Portfolio has no current exposure to small caps (which has been a good thing so far this year, but that may be about to change). In fact, we recently ranked both RVT and RMT highly among a handful of select ideas from our new report, 150 High-Income CEFs, for their price discounts combined with their strong management teams and the overall contrarian attractiveness of small caps in general.
However, at the end of the day, it is critically important for you to select investment opportunities that are right for you, based on your own personal goals and tolerance for risk. We believe disciplined, goal-focused, long-term investing will continue to be a winning strategy.
Be the first to comment