

Thinkhubstudio/iStock via Getty Images
Taking Stock
Inflation stokes fear, the ground rules are clear,
The Fed will not pivot until there’s a divot.
A dovish Oz move got the markets to groove,
‘Twas brief in the face of job data apace.
As worries return of recession concerns,
Investors take flight, enveloped in fright,
Of an overcorrection by Fed misdirection.
Recession or not? Let us take stock.
Author: Yours truly who should not quit her day job
Last quarter we argued that the Fed was late to act in the face of rising inflation. We are seeing the repercussions of inaction currently with global markets on pins and needles, reacting violently to a single data point, positive or negative. Case in point, a pivot-friendly rate hike from the Reserve Bank of Australia (RBA) set markets on fire in early October, only to be extinguished by a strong nonfarm payroll report two days later. Why the angst?
In a nutshell, fear of a prolonged and deep recession caused by a credibility-seeking, hindsight biased Fed, or worse, a systemic financial crisis. Regarding the latter, there seem to be cracks emerging: The Bank of England was forced to buy gilts in response to a liquidity crunch among pension funds induced by the market’s reaction to a new fiscal package that included a cap on energy prices and the biggest (unfunded) tax cuts since the 1970s. A surge in gilts yields caused what some predict so far to be ~$170 billion mark-to-market losses on derivative positions related to liability-driven investment (LDI) [1] pension funds. The obvious contradiction between the simultaneous purchase of government bonds (quantitative easing) and the raising of benchmark interest rates to tame inflation that sits close to a 40-year high is not dissimilar to the European Central Bank’s (ECB) new policy tool, the Transmission Protection Instrument (TPI). This tool allows the ECB to purchase unlimited amounts of sovereign debt to keep peripheral bond spreads in check as they remove liquidity from the eurozone system in the form of interest rates increases.
Does this sound familiar? It should. It is known as yield curve control (YCC) and the Bank of Japan has been doing it for more than six years. While the UK and the ECB are using it to avoid catastrophe, Japan is using it to bolster their moribund economy. Same policy, different motives.
In the UK and ECB’s case it is a form of “blinking,” i.e., intervention in their respective bond markets to prevent yield spikes. (To be clear, the ECB has yet to use TPI, relying first on geographically asymmetric purchases under the existing PEPP program.)
This begs an important question: Will the Fed be forced to blink? We know that since the Global Financial Crisis, and then Covid, the world has experienced a massive injection of liquidity that has pushed asset prices through the roof and spawned kooky financial products such as special purpose acquisition companies (SPACs)[2], otherwise known as blank check companies. (Would you write a stranger a blank check?) We also know the Fed has been forced to play catch-up with aggressive rate increases starting in March of this year, a function of staying in the “inflation is transitory” camp for far too long. When over a decade of free money meets sudden and aggressive monetary tightening, things could get ugly.
Does the Fed have what it takes to win? To induce what could be a deep and prolonged recession or even financial instability? No wonder markets are spooked. It is not just because it is Halloween.
Recession, Anyone?
The Fed, heavily criticized for being behind the eight ball, remains decisively hawkish, stressing the importance of staying the course even as the labor market slows. What is curious is that the negative carry (2-year yield > 10-year yield) embedded in the US Treasury yield curve is screaming recession, yet the Fed still has a positive sign in front of their GDP forecast for 2023. Building back credibility as a competent group of bankers perhaps starts with a negative sign.
So, recession it likely is, depth and duration unknown. The risk of overcorrection given the leverage in the system is not insignificant. We will see the effects of the Fed’s most aggressive rate hikes since the 1980’s approximately 12 to 18 months from the first March hike. Lael Brainard, Vice Chair of the Federal Reserve, said it well in a recent speech: “We are starting to see the effects [of Fed tightening] in some areas, but it will take some time for the cumulative tightening to transmit through the economy and bring inflation down.”[3] After 10+ years of unprecedented liquidity and leverage, we are in unchartered territory.
Is the global economy slowing? Unequivocally, yes. But not everywhere. The most evident is the US housing market where mortgage rates have more than doubled so far this year, housing price increases are dissipating rapidly in most markets and housing starts, despite a blip in August, are rolling over. Permits are falling as well. Still, there is a long way to go to remove even the covid induced excesses.
US Housing Starts (1959-2022)
US Housing Starts (1959-2022) – Global manufacturing and service PMIs are beginning to reflect a global slowdown.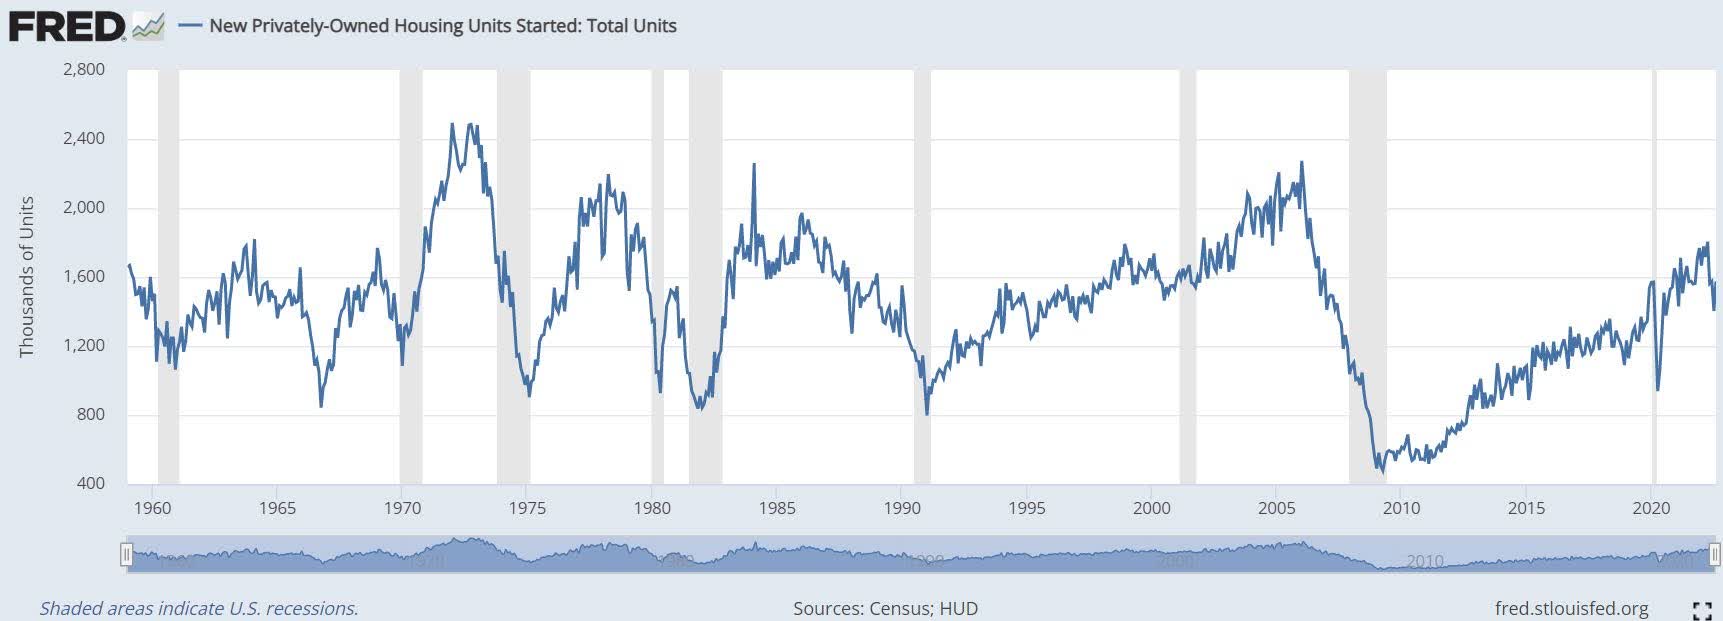
Manufacturing PMI (2019-2022)
Source: Bloomberg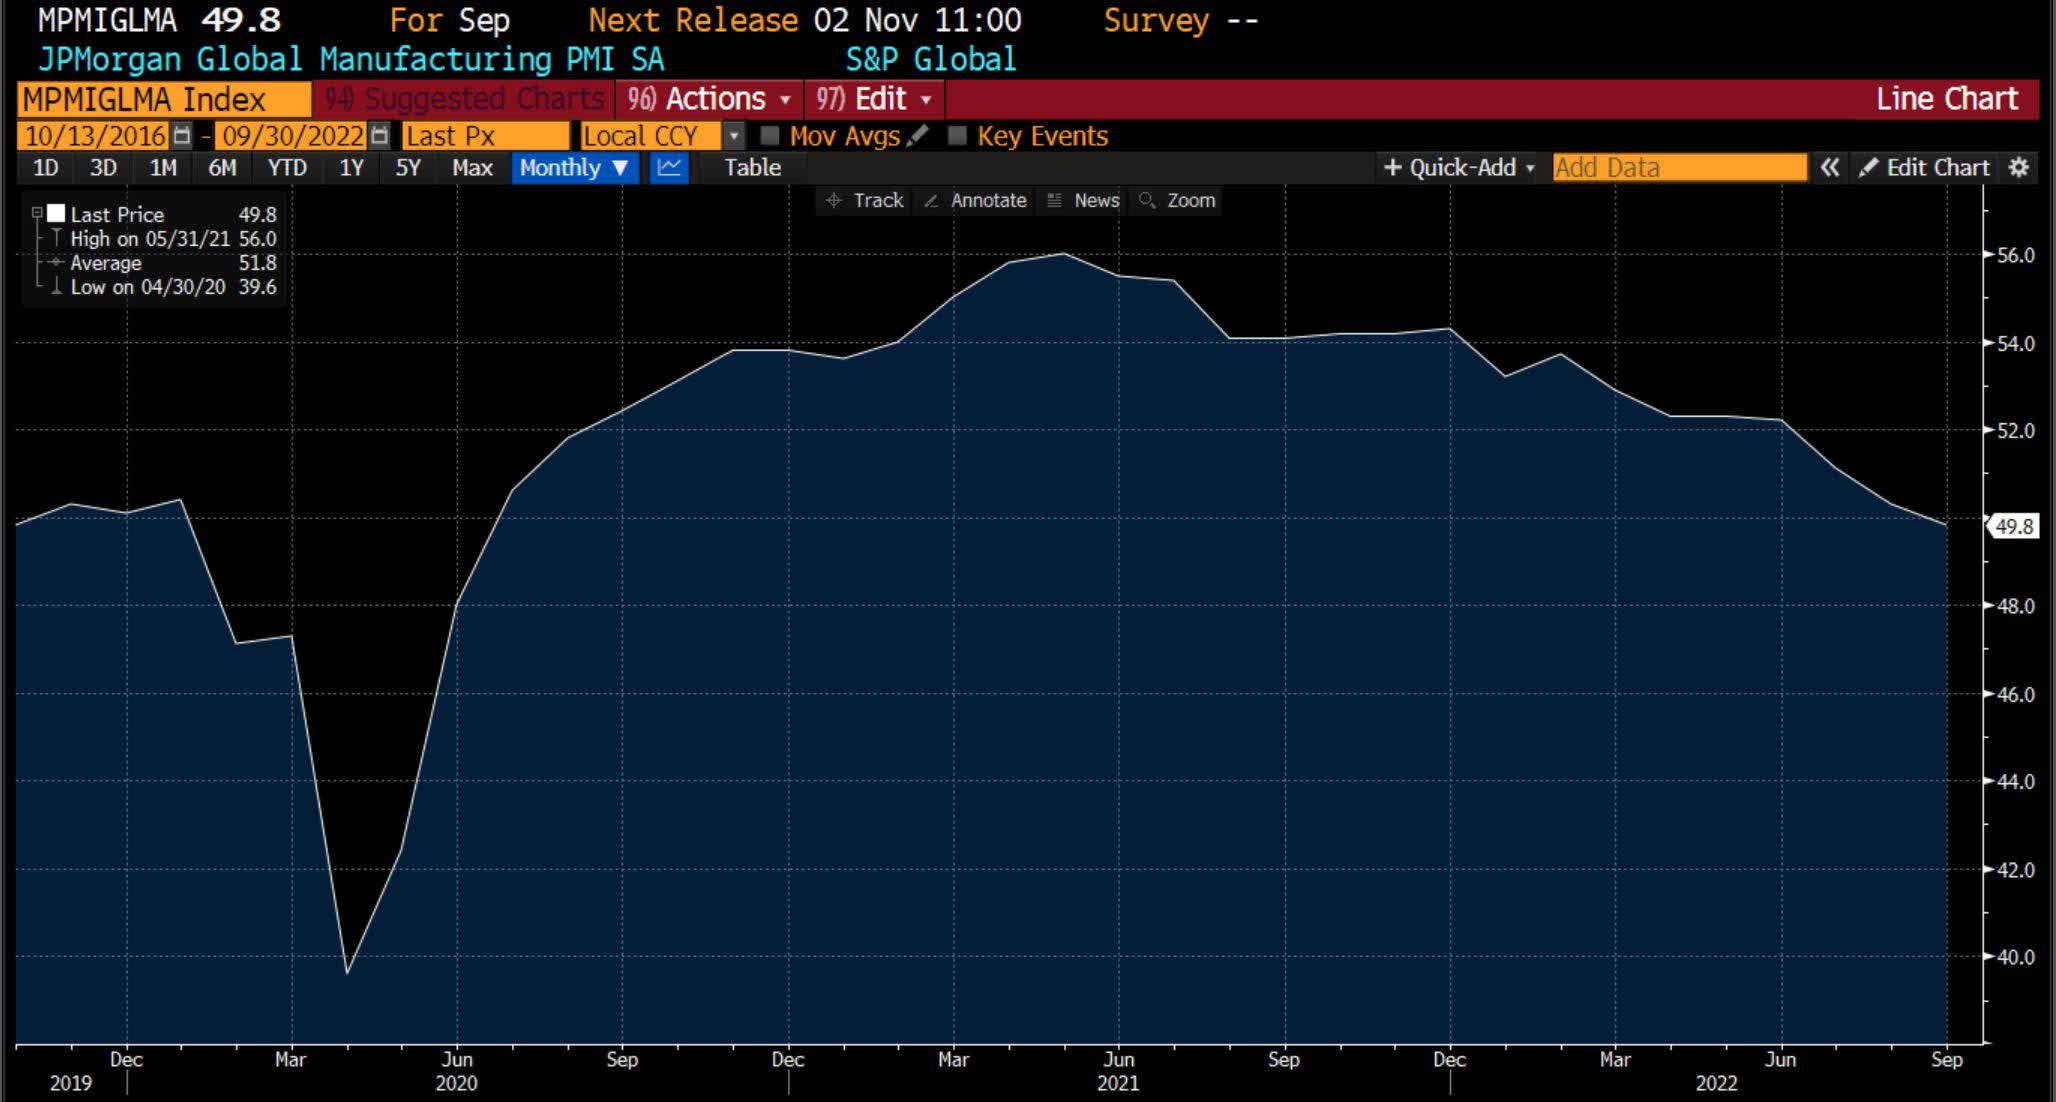
JPMorgan Global Services PMI (2019-2022)
Source: Bloomberg
Where are we not yet seeing any significant signs of weakness? US labor markets and consumption. Regarding the former, the supply of workers is still below pre-Covid levels, and the unemployment rate continues to fall, currently at 3.5%, the lowest rate in 70+ years. However, despite stronger wage growth, real wage growth is negative, more so than ever over the past 25 years according to the Federal Reserve Bank of Dallas. So why is consumption not showing signs of slowing? As one colleague put it, “no one is living poorly yet.” The answer lies in consumer credit data. US consumer credit outstanding has reached $4.7 trillion, a historic high. The latest Federal Reserve report shows an annual increase of 8.3% and 18.1% in total credit and revolving credit, respectively. Included in revolving credit are credit card debt and personal loans. The consumer is still on fire. Increasingly higher rates will most certainly dampen growth just as they have done in the mortgage market. At 70% of GDP, slower consumption moving into 2023 will likely be the divot the Fed is looking for.
International Markets and the Uber Strong US Dollar
Keeping it simple, there are two main reasons for current greenback strength: Safe haven status and interest rate differentials. Investor trepidation causes dollar strength. As long as the world is full of uncertainty (Ukraine War, energy crisis in Europe, fear of recession/financial distress etc.) the dollar will catch a bid. One extreme example of currency weakness induced by interest rate differentials is the Japanese yen that sits at a 32-year low against the dollar. The euro is not pretty either having broken parity for the first time in 20 years. And the British pound has never been weaker versus the dollar. Ironically, emerging market currencies such as Brazilian real and the Mexican peso have held up remarkably well against the greenback, a function of proactive disciplined monetary policy. This is more than can be said for developed country central banks.
Japanese Yen vs. US Dollar (1990-2022)
Source: Bloomberg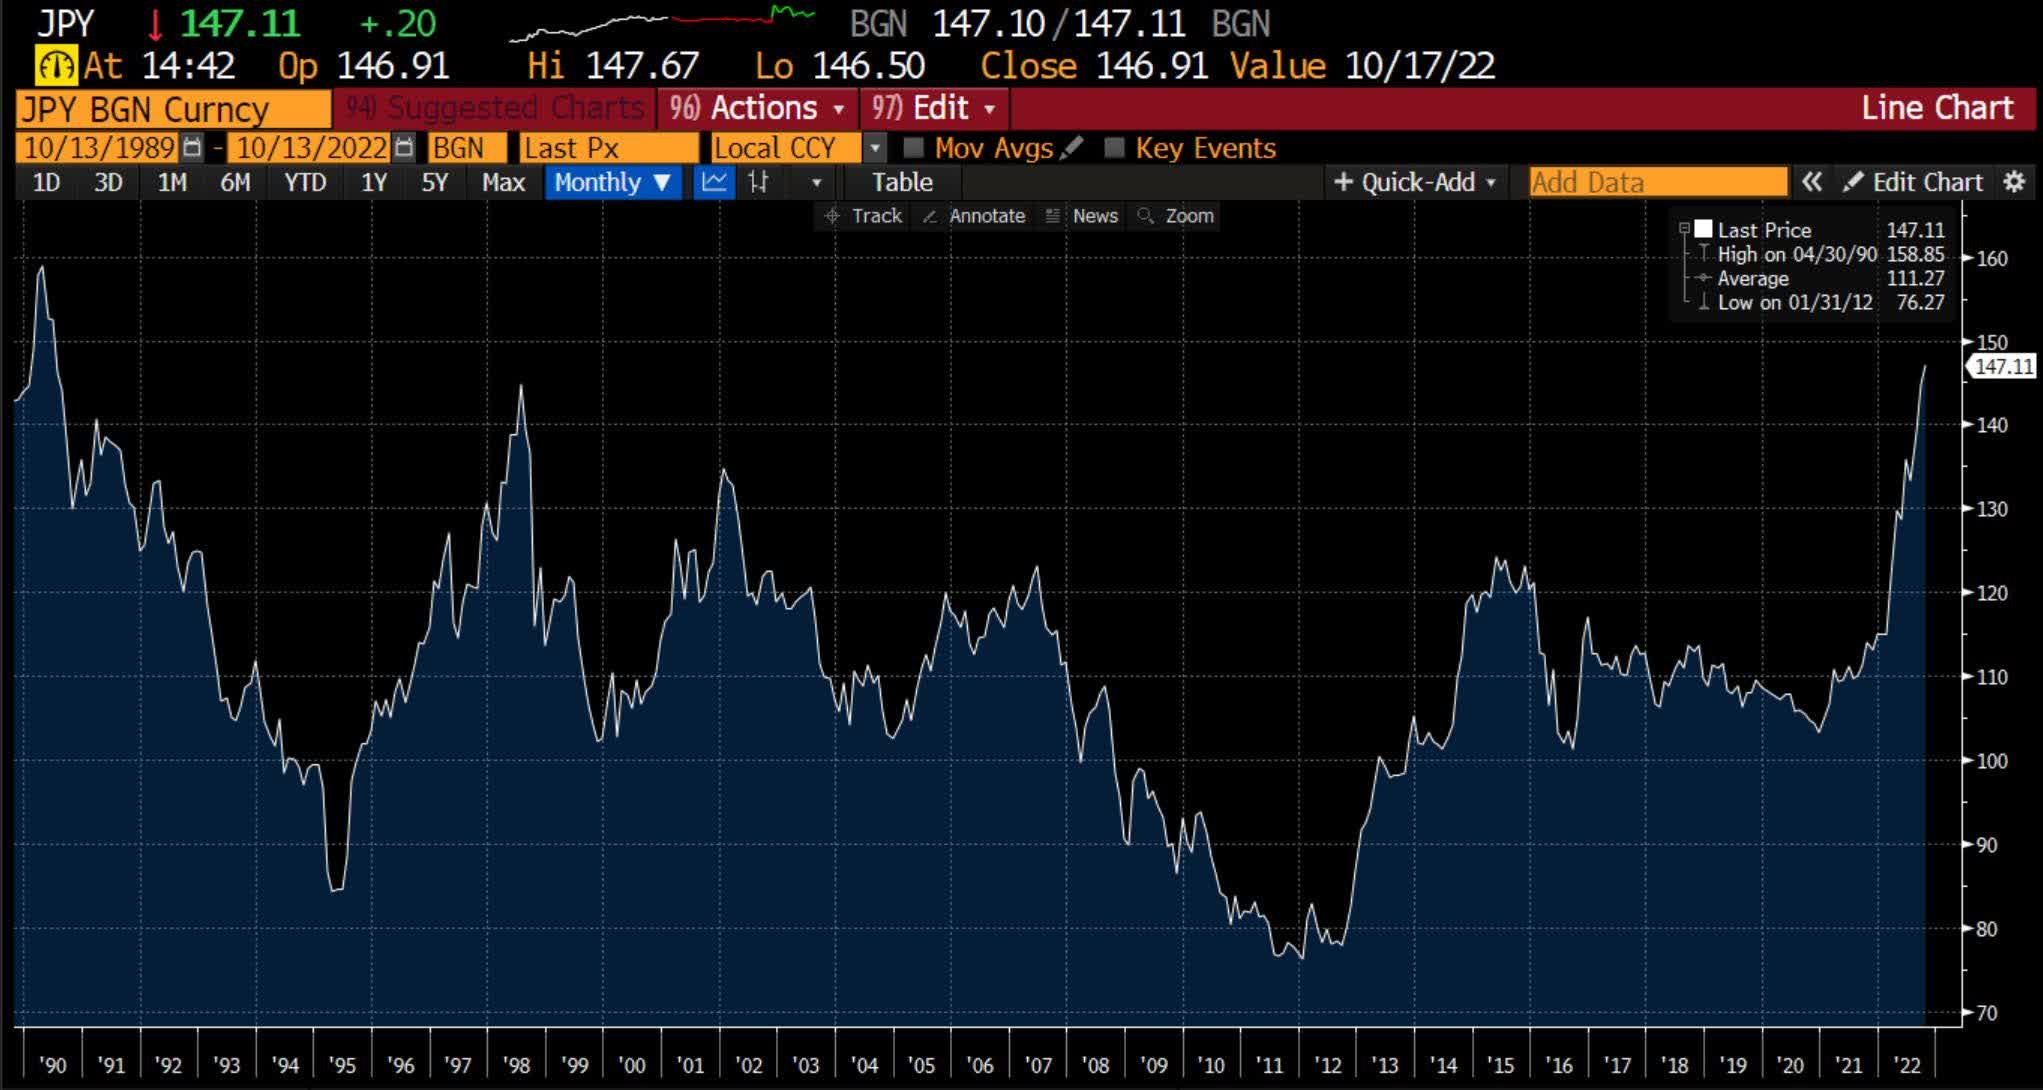
The Fed has a domestically focused mandate and appears less concerned with the wider global economy. Plus, a strong dollar dampens inflationary pressure and clearly the Fed needs all the help it can get. The Bank of England was able (so far) to handle the LDIs without external help, but we cannot rule out a larger hiccup during this tightening cycle that may require a coordinated global central bank effort. Otherwise, the dollar reign will end when Mr. Market begins to price in peak inflation. Emerging markets (EM) should benefit as investors see the merit in buying riskier assets. China remains a unique case give their zero-covid policy that has inflicted heavy economic and social damage with no end in sight given the renewed wave of lockdowns. Combined with government efforts to moderate the debt-laden property sector, China’s economic growth will be much lower than the official Beijing target of 5.5%. We cannot rule out a post Party Congress policy shift after Xi Jinping has solidified his power by securing a third term as President in October.
European economies are bearing the brunt of the war in Ukraine and the energy shortage that has ensued. Arguably the energy crisis is self-inflicted, a consequence of green energy polices and over-reliance on Russian natural gas. We discussed the details in last quarter’s letter. Eurozone inflation reached 10% in September, with price pressures strengthening and broadening across the economy. High energy prices are crippling businesses and consumers. The ECB moved from complacency in June to urgency in September. At least they admit to stagnating economic growth into 2023, more than can be said for the Fed.
Earnings and Stocks
It is interesting to consider the forward price-earnings (P/E) ratio as a voting machine. In the numerator one finds the aggregated opinion of all market participants, the price they will pay for a year of earnings. The denominator, on the other hand, is an opinion on corporate profitability from a select few analysts who are compensated (indirectly) from business garnered from the corporates they are analyzing. The inherent positive bias in the divisor is a well-known dynamic. Consider the MSCI EAFE Index. The forward PE has compressed almost 40%, from 17x to the current 11x. Looks reasonable, no?
Not so fast. Earnings estimates have been revised down by a mere 7% so far this year. This is patently absurd given the economic backdrop. In reality, the P/E is higher. Markets are still more expensive that might be assumed at first glance. It is our job to accurately forecast earnings and decide when valuation is suitable for entry. Looking at statutory P/Es will not get you there. Bottom-up work is extremely important. Understanding top line growth and margin resiliency is key to forecasting earnings. Our fundamental work is leading us to some interesting names that may reach our desired attachment point in the coming months. We are still cautious but must be ever vigilant and opportunity seeking.
MSCI EAFE Index Forward P/E Multiples (2006-2022)
Source: MSCI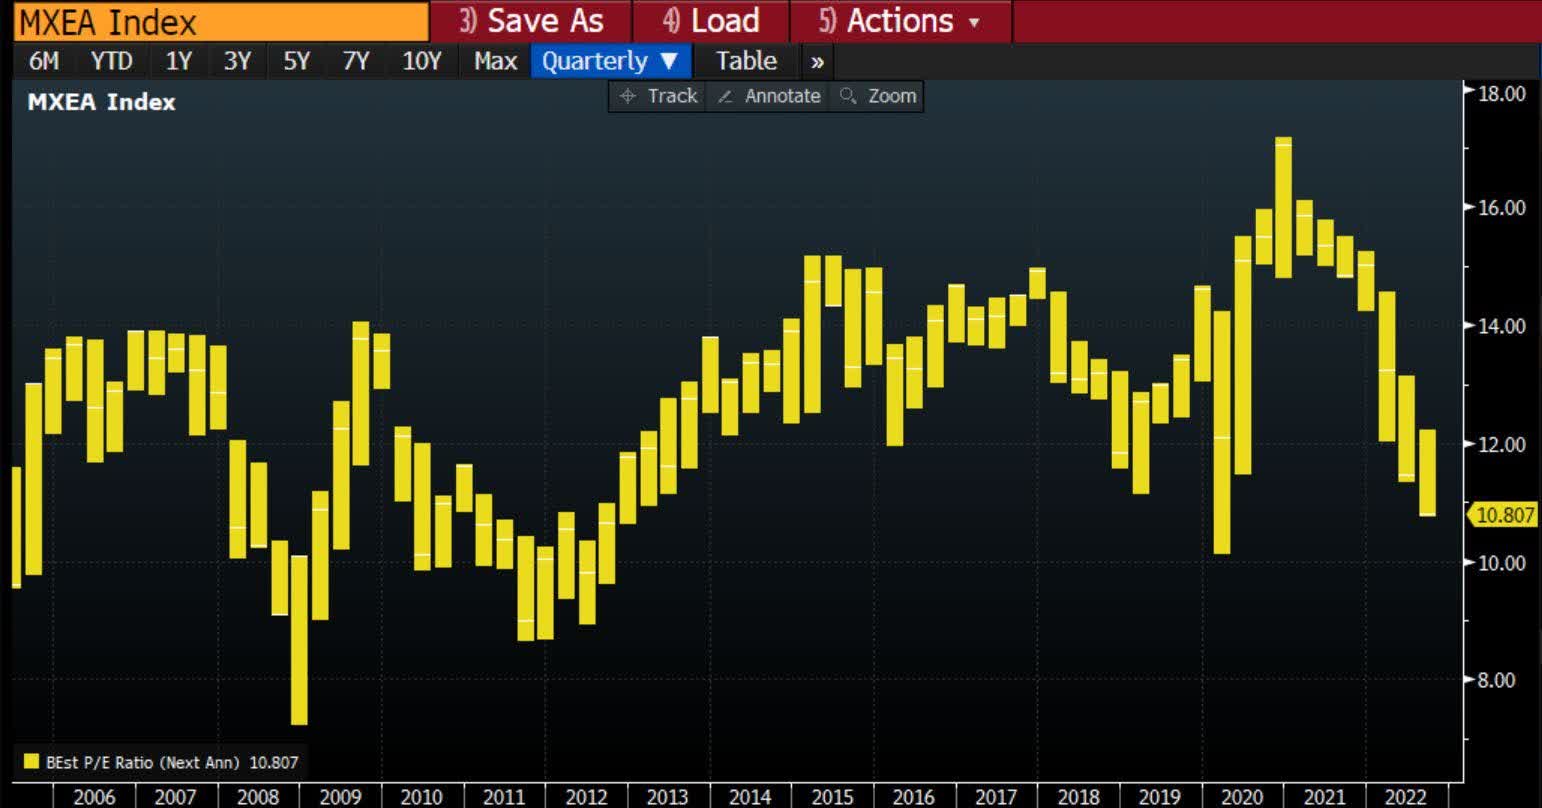
New World (Blurred Lines)
If you took China, South Korea, and Taiwan out of emerging markets, a number of countries in the developing world are behaving quite admirably during this inflationary period. China’s problems, like the UK’s, are largely self-inflicted, but many countries have handled inflation well.
We think the EM story is changing from China-only to a bigger, broader story. There are some great investments in the emerging world right now, but capturing those investments requires owning stocks in smaller countries, domestic demand stories, and smaller capitalization stocks, where there is lower correlation to the interest rate cycle in the United States. In other words, you need to be a stock picker right now. Hugging the index, will get you a lot of what isn’t handling the new inflation environment well—technology stocks, Taiwan, South Korea, and China are behemoths in the index because they reflect what has worked in the past, which was characterized by a perpetually falling interest rate environment. This playbook won’t work in a world of higher interest rates and hence lower global consumer demand.
New themes today in EM include multi-shoring, friend-shoring, on-shoring, and near-shoring (Mexico, Brazil, Southeast Asia, and India). There are great demographic stories in EM (India, Indonesia, Mexico, and the Philippines). Themes also include relatively good handling of inflation versus the developed world (Brazil, Mexico, Chile, and India), and there are also EM Covid opening stories (Thailand, Malaysia, Indonesia). We are overweight great companies in these places. This is not a buy-the-dip playbook or inflation transitory playbook. It is a new and different world of forward-looking growth.
Taiwan and South Korea are highly correlated to US technology spending cycles and interest rates. We are treading lightly. We don’t think that earnings have normalized yet with inflation still running high in the developed world and the developed market consumer cutting back on all things with a chip in it (semiconductor countries now have headwinds). As we have mentioned in the past, South Korea is a tough market for us from a governance perspective as well. Taiwan also has a big long-term problem: China wants to absorb it.
We are selectively adding to good companies around the world as valuations become more enticing, but we remain underweight China due to poor government policy, namely zero-Covid, and deteriorating relations with the West. Is there value in China or is it increasingly becoming a value trap? We fear the latter. Demographics are also a long-term headwind.
EM will have a double tailwind coming out of the US tightening cycle on relatively low valuations and a reversal in currency headwinds from the strong USD. We do not believe the market has bottomed yet (inflation in the West and the valuation of cyclical companies remain elevated but rapidly improving). We remain cautious, but we are slowly positioning for the turn. We remain focused on finding quality companies at a reasonable price. We believe patience is still critical.
Overseas (Blurred Lines Part 2)
Overseas invests in anything that isn’t the US. It also invests mainly in micro, small, and mid-capitalization stocks. We think the breadth of selection opportunities is going to be to our advantage as we eventually hit a bottom in this correction.
Stocks and themes we are parsing through include hard hit consumer and technology stocks that have market dominance in small countries (Australia, New Zealand, Scandinavian countries); fallen IPOs that were overpriced in the hot fiscal and interest rate induced Covid stock market mania (global); and stocks that have been hit by horrible governance from fiscal, monetary, and Covid policy (Japan, China, the UK, and Europe).
For now, we remain conservatively positioned. We think P/Es have compressed, but we believe the earnings downgrade cycle is just beginning, and it will likely get worse, because the US Federal Reserve will need to force a recession to control inflation and hence that will force earnings to fall. Part of it is already in stock prices, but as shown above from our EAFE example, we don’t think all of the contraction is factored in yet. We see this in our bottom-up work. If Covid stay-at-home spending, higher interest rates, and no fiscal stimulus work their way through consumer stocks (which in our opinion includes most technology stocks as well), then the reversion to the mean in earnings (stripping out all of the Covid booms) will be greater than the current expectations.
One thing we do know is that it is silly to bucket countries into meaningless categories at the moment: emerging, developed, or frontier. There are countries that are behaving like emerging markets—that thought inflation was transitory and let growth go too far too fast (the US, South Korea, and Taiwan). There are countries that were emerging or developed that are behaving like frontier nations (the UK and Japan). There are countries where the agenda fits no known or index defined standard (Russia and China), and there is the frontier (for example, Sri Lanka and Pakistan) where status quo is all too evident. Japan has at least finally opened, but it happens to coincide with a period of time when travel should be peaking (this should be happening, but it is another case of where the consumer is not acting poor enough).
In Overseas, we look at the country as it is not as it is defined by index providers, and we place the companies we invest in the world as it is not as it was in a long period of easy money. It is as good a time as we can remember for people to pick stocks not buy-the-dip in what has worked in a different world. The global world is evolving. Old lines, old worlds are blurring. Old playbooks require new thinking. We are sitting back patiently and looking for great long-term investments.
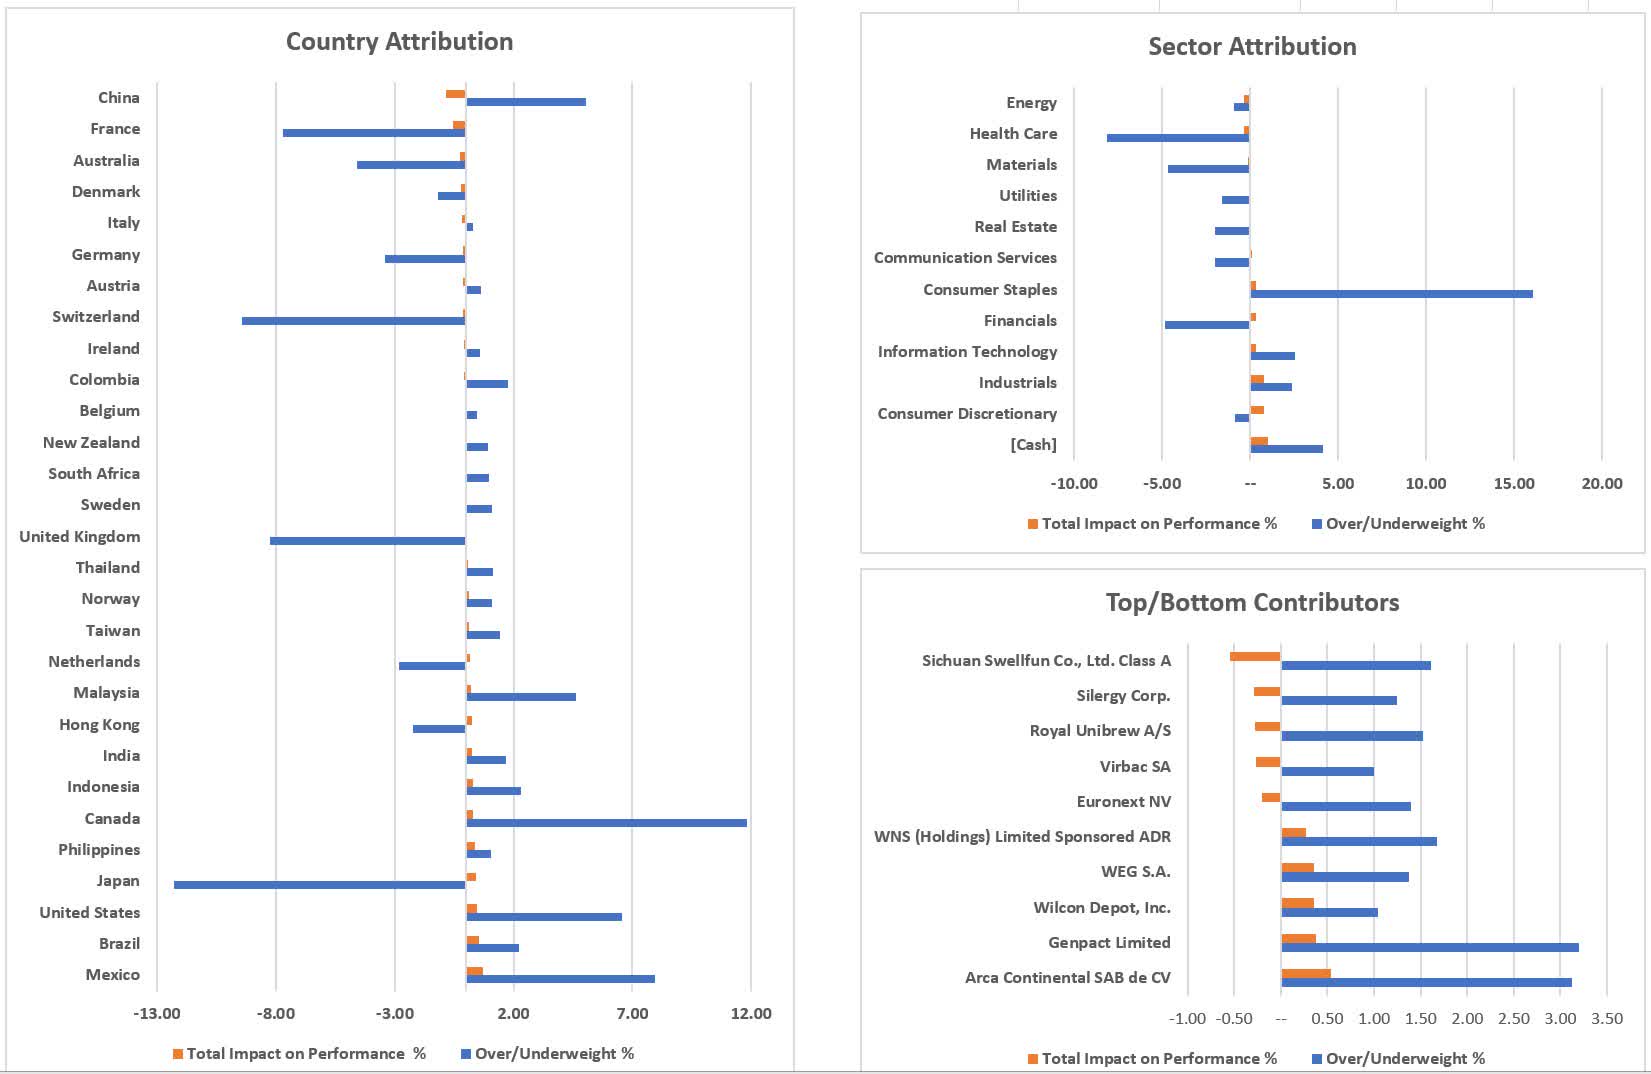
NEW WORLD ATTRIBUTION DASHBOARD 3Q 2022

OVERSEAS ATTRIBUTION DASHBOARD 3Q 2022
Rondure Funds Performance as of 09/30/22
|
Rondure New World Fund |
QTR |
YTD |
1 Year* |
3 Year* |
5 Year* |
Since Inception |
|
Institutional |
-5.30% |
-19.88% |
-19.98% |
0.95% |
1.66% |
20.39% |
|
Investor |
-5.33% |
-19.97% |
-20.21% |
0.70% |
1.41% |
18.82% |
|
MSCI Emerging Markets TR USD4 |
-11.42% |
-26.89% |
-27.80% |
-1.71% |
-1.44% |
17.83% |
|
Rondure Overseas Fund |
QTR |
YTD |
1 Year* |
3 Year* |
5 Year* |
Since Inception |
|
Institution |
-7.66% |
-31.67% |
-28.42% |
-2.56% |
-0.44% |
8.17% |
|
Investor |
-7.68% |
-31.78% |
-28.60% |
-2.80% |
-0.68% |
6.81% |
|
MSCI EAFE TR USD5 |
-9.29% |
-26.76% |
-24.75% |
-1.38% |
-0.36% |
7.08% |
|
MSCI ACWI ex US Mid Cap – NR |
-9.85% |
-29.22% |
-28.78% |
-2.60% |
-1.79% |
0% |
|
Data shows past performance, which is not indicative of future performance. Current performance may be lower or higher than the data quoted. To obtain the most recent performance data available, please visit www.rondureglobal.com. The Advisor may absorb certain Fund expenses, without which total return would have been lower. Investment returns and principal value will fluctuate and shares, when redeemed, may be worth more or less than their original cost. Rondure New World Fund (RNWOX / RNWIX) – Inception date of 05/01/2017. Expense ratios as of prospectus dated 08/31/2023 are: RNWOX: 1.58% Gross / 1.35% Net, RNWIX: 1.27% Gross / 1.10% Net The Advisor has contractually agreed to waive and/or reimburse fees or expenses to 1.35% and 1.10% of the Fund’s average daily net assets for the Fund’s Investor Class Shares and Institutional Class Shares, respectively through at least August 31, 2023. Rondure Overseas Fund (ROSOX/ROSIX) – Inception date of 05/01/201 Expense ratios as of prospectus dated 08/31/2023 are: ROSOX: 1.88% Gross / 1.10% Net, ROSIX: 1.56% Gross / 0.85% Net The Advisor has contractually agreed to waive and/or reimburse fees or expenses to 1.10% and 0.85%% of the Fund’s average daily net assets for the Fund’s Investor Class Shares and Institutional Class Shares, respectively through at least August 31, 2023. An investor should consider investment objectives, risks, charges, and expenses carefully before investing. Visit www.rondureglobal.com to obtain a Rondure Funds Prospectus, which contain this and other information, or call 1.855.775.3337. Read the prospectus carefully before investing. See the prospectus for additional information regarding Fund expenses. Rondure Funds will deduct a 2.00% redemption proceeds fee on Fund shares held 60 days or less. Performance data does not reflect the deduction of this redemption fee or taxes, which if reflected, would reduce the performance quoted. For more complete information including charges, risks and expenses, read the prospectus carefully. The objective of all Rondure Funds is long-term growth of capital. RISKS: Investing in foreign securities entails special risks, such as currency fluctuations and political uncertainties, which are described in more detail in the prospectus. Investments in emerging and frontier markets are subject to the same risks as other foreign securities and may be subject to greater risks than investments in foreign countries with more established economies and securities markets. Diversification does not eliminate the risk of experiencing investment loses. RON000451 Exp. 1/31/2023 |
Footnotes1Liability -driven investment, otherwise known as liability-driven investing, is primarily slated toward gaining enough assets to cover all current and future liabilities. This type of investing is common when dealing with defined-benefit pension plans because the liabilities involved quite frequently climb into billions of dollars with the largest of the pension plans. Source: Investopedia 2A special purpose acquisition company (SPAC) is a company without commercial operations and is formed strictly to raise capital through an initial public offering (IPO) or the purpose of acquiring or merging with an existing company. Source: Investopedia 3Federal Reserve System Board of Governors Vice Chair Lael Brainard Remarks at National Association for Business Economics Annual Meeting, Chicago, Illinois, as Released by the Federal Reserve, October 10, 2022 4The MSCI Emerging Markets Total Return USD Index is an unmanaged total return index, reported in U.S. Dollars, based on share prices and reinvested dividends of approximately 1,383 companies from 26 emerging market countries. You cannot invest directly in an index. 5The MSCI EAFE Total Return USD Index is an unmanaged total return index, reported in U.S. dollars, based on share prices and reinvested net dividends of approximately 900 companies from 21 developed market countries excluding the US and Canada. You cannot invest directly in an index. |
Editor’s Note: The summary bullets for this article were chosen by Seeking Alpha editors.
Be the first to comment