

Christopher Furlong
I started investing in Rolls-Royce (OTCPK:RYCEY) pre-pandemic, and it has been a painful experience. From mechanical problems on a flagship engine to the COVID-19-induced downturn that caused a dilutive rights offering, RR hasn’t caught a break in the last 5 years – and shareholders have paid a hefty price. However, as the saying goes “what doesn’t kill you makes you stronger,” Rolls-Royce has emerged from the pandemic in a stronger position to finally generate shareholder returns.
Business Overview
RR is based in the UK and organized around 4 businesses: 1) Civil Aerospace, 2) Defence, 3) Power Systems, and 4) New Markets. Table 1 provides a summary of each of the businesses.
|
Business Segment |
Description |
2019 Revenue (£B) |
2021 Revenue (£B) |
% Change |
|
Civil Aerospace |
|
8.1 |
4.5 |
-44% |
|
Defence |
|
3.3 |
3.4 |
3% |
|
Power Systems |
|
3.5 |
2.7 |
-23% |
|
New Markets |
|
* |
0.0 |
N/A |
Table 1: Summary of RR Business Segments from Annual Report
Civil Aerospace (Civil)
Civil is by far the RR’s largest business segment. Within Civil, the majority of revenue comes from large engines (71% of 2019 Civil revenue). Hence, Civil Large Engines will be the focus of this article, but Civil also includes business aviation and regional jets.
As background, the large civil engine market is one in which aircraft engine makers such as RR work with airframers such as Boeing and Airbus to design and build engines that fit on airframe models. Figure 1 shows RR’s current market share by airframe model for the current Trent engine program.
Figure 1: RR Market Share by Airframe Model (Rolls-Royce 1H 2022 Results Appendices)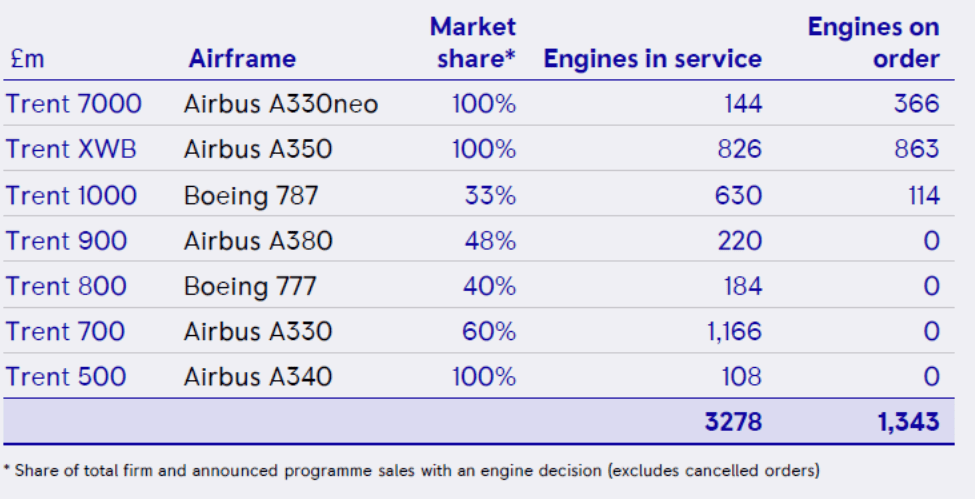
Some airframe models, such as the Airbus A330neo, sole-source a RR engine for the airframe, hence RR’s 100% market share. Other airframe models, such as the Boeing 787, source engines from multiple suppliers (usually not more than two), hence RR’s 33% market share. The ultimate customers are the airlines. Airlines decide which airframes they want to purchase when they want to expand or replenish their fleets as older airplanes retire. If the airline chooses an airframe with multiple options for engines, the airlines then evaluate the engine options based on multiple factors, including price, fuel efficiency, reliability, maintenance costs, etc.
The airframe market is bifurcated between narrow-body (single-aisle) and wide-body (double-aisle). Narrow-body (NB) are smaller airplanes primarily used for shorter-distance (short-haul) domestic flights. Wide-body (WB) are typically larger airplanes primarily used for longer distance international flights (long-haul). RR currently only makes WB engines after deciding to exit the NB market a decade ago. The WB engine market is an oligopoly dominated by GE (GE), RR, and Pratt & Whitney (PW). RR reports that it has 58% market share on current large engine programs, while GE reports that RR has 1/3 of the WB engine market compared to ½ for GE (Figure 2). While GE and Pratt are formidable competitors, the threat of a new entrant is low given the tremendous capital and capability requirements for entering the aircraft engine market.
Figure 2: Wide-Body Engine Market Share (GE Presentation March 2022)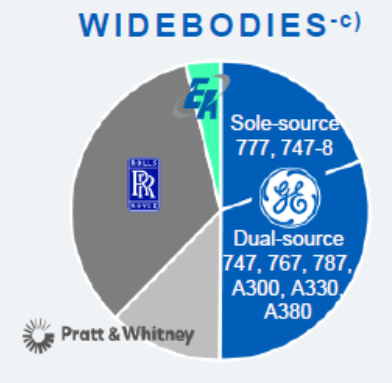
The development of a large engine program is a decade-long investment cycle to build up a fleet (see Figure 3 for the Trent engine program investment cycle). The payoff then comes in the next decade or two as engine makers earn high-margin profits on aftermarket services.
Figure 3: Trent Engine Program Investment Cycle (Civil Investor Day May 2022)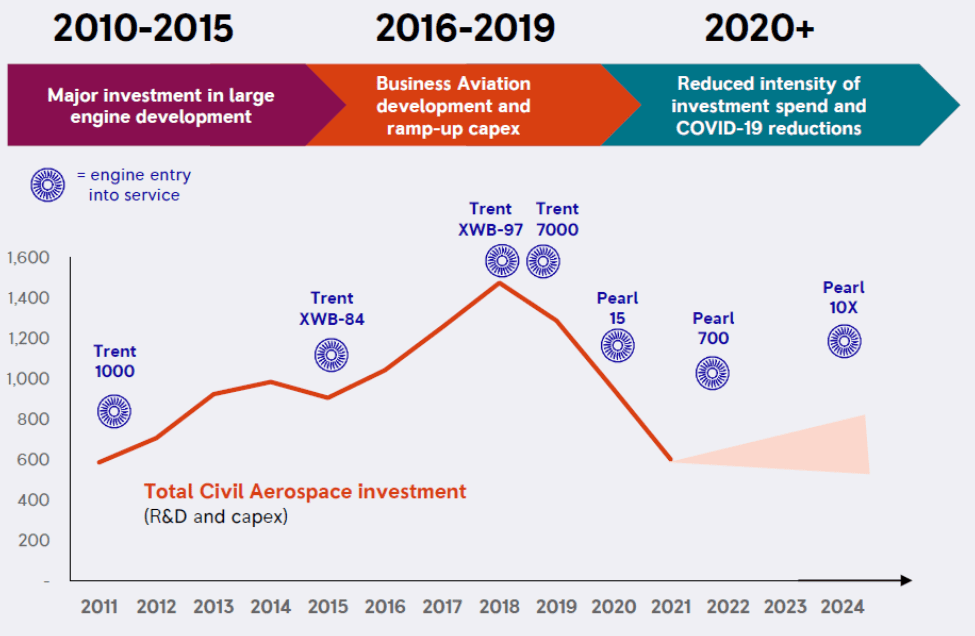
Historically, the large original equipment (OE) engine sold would lose money – £1.2M on average per engine in 2019. Hence, the OE is the razor (for those familiar with Gillette’s razor-razor blade business model). However, RR often sells highly profitable Long-Term Service Agreements (LTSAs) with its engines – hence the razor blade. The services contracts often are structured as power-by-the-hour (PBTH) contracts, wherein RR bills airlines based on the engine run-time, i.e., engine flight hours (EFHs), multiplied by a pre-determined rate. For example, if a RR Trent engine runs for 200 EFHs in a given month and the pre-determined rate in the service contract is $200 per EFH, then that engine generates $40k of cash receipts per month. Since each large commercial airplane typically has 2 engines, an airplane generates $80k cash receipts per month, or ~$1M per year. With an installed base of total 5,700 large engines, Civil services is a multi-billion cash generator.
The service contract requires RR to perform annual routine maintenance and major overhauls. Major overhauls are big expenses that happen every 15,000 hours typically, but engines can often last much longer. In 2019, a Rolls-Royce Trent 700 engine completed more than 50,000 flying hours without an overhaul.
A key advantage of the PBTH model is that it creates negative working capital (or float), wherein RR gets paid by the customer before delivering services. The airline first pays RR for each EFH. As the EFHs build up, RR builds a balance of cash receipts. RR then services the engine eventually, and the cash receipts convert to revenue as RR performs required services.
On the other hand, the PBTH model can become a liability when the engines do not perform as expected. In 2016, the Trent 1000 flagship engine began to show signs of premature cracking. RR ended up spending $1.4B over 5 years to address the issue in addition to lost EFH revenue from grounded aircraft. Fortunately, the current flagship Trent XWB has not had any major issues since production began in 2019.
Just as RR was resolving the Trent 1000 issues going into 2020, the pandemic induced a drastic downturn in international travel, which in turn caused a sharp drop in EFHs. As a result, management decided to raise cash through a massively dilutive rights offering.
Civil is still in the middle of recovering from the pandemic. Large engine passenger EFHs dropped by over 50% amid the pandemic in 2020 (see Figure 4). As of the Q3 2022 Trading Update, Civil EFHs have only recovered to 65% of 2019 levels for the four months ending in October 2022, dragged by lower travel in China and Asia due to Covid measures. RR stands to benefit significantly from continued recovery in international long-haul travel and as China loosens its Zero-Covid policies. Management forecasts large engine passenger EFHs should return to 2019 levels by 2024 (see Figure 4).
Figure 4: RR EFHs Indexed to 2019 (Civil Investor Day May 2022)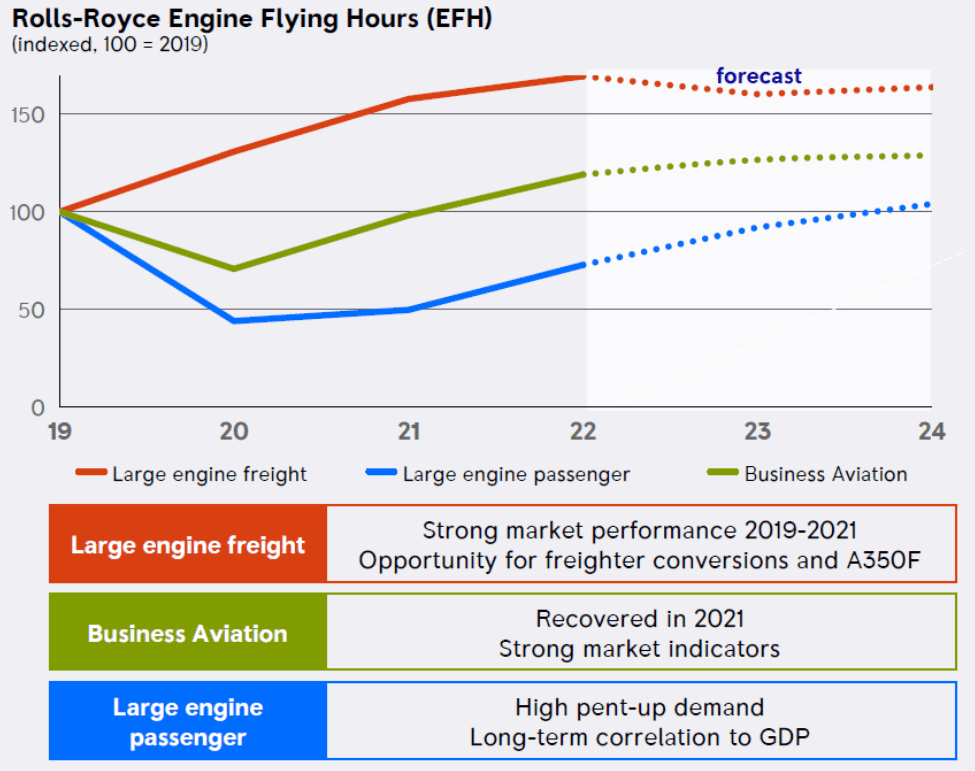
A silver lining of the pandemic is forcing RR to deliver the biggest cost restructuring in its history in 2021, wherein Civil delivered a £1.2B cost reduction (see Figure 5).
Figure 5: Civil Cost Reduction (Civil Investor Day May 2022)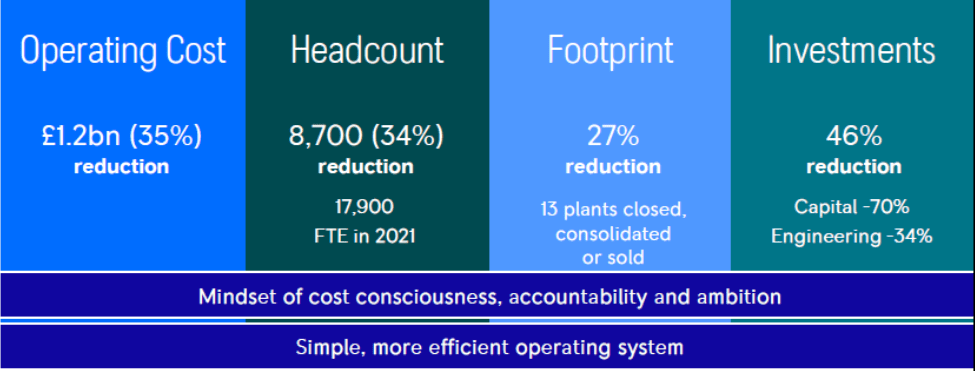
RR management stated that the restructuring permanently lowered Civil’s cost base such that when Civil returns to 2019-levels of activity (e.g., EFHs, OE deliveries), the cost base will be lower than in 2019. Expert interview transcripts that I’ve reviewed have said most of the staff reductions involved management layers and support staff while keeping engineering talent mostly intact.
Defence
For the Defence business, RR bids on government contracts to provide aero and naval engines to various governments for military use. The home market governments of the US, UK, and Germany generated the bulk of Defence revenue, while RR also exports to customers in the Middle East, Korea, Japan, Canada, India, and elsewhere. The key driver of Defence revenue is Defence budgets of the governments RR serves, which tend to grow in line with GDP. Given currently elevated global tensions, Defence budgets could grow slightly faster than GDP, which could provide a tailwind to RR Defence. Defence is generally a stable business that reliably generates profits and cash flow, even through economically tumultuous periods such as the COVID pandemic.
Power Systems (PS)
For the PS business, RR makes and services gas engines for ships and generators and battery storage systems. Key customers include governments for land defence and marine end markets, data centers for power generation solutions and industrial end markets. Power Systems was more resilient than Civil during the pandemic downturn, but not as resilient as Defence. Industrial markets such as construction, agriculture, oil & gas and mining suffered the largest pandemic-related decline in 2020 and have not yet recovered.
New Markets
New Markets is a nascent business focused on emerging technologies in small modular reactors (SMR) and electrical aircraft. While revenue in this segment is negligible currently, the opportunities are tremendous and provide shareholders with long-term option value. SMR has the potential to revolutionize the energy industry with clean, reliable, and safer nuclear energy. Electrical aircraft could potentially transform urban and regional mobility.
Balance Sheet
As of 1H 2022, RR has net debt of £5.1B, including £1.9B leases. RR expects to use £2B proceeds from pending disposals to pay down debt, bringing down net debt to £3.1B including leases, or £1.2B ex leases. The first step to understanding RR’s true debt load is understanding leases, cash, and contract liabilities.
Lease Liabilities
RR reported net debt using the formula of Borrowings + Lease Liabilities – Cash = Net Debt. Borrowings consist of £4B of issued bonds. For the £1.9B Lease Liabilities, £1.3B is for aircraft and engines, while the remaining amount is for land, buildings, plant and equipment. In a hypothetical liquidation scenario, the lease liabilities wouldn’t necessarily become financial liabilities that must be repaid in cash (unlike notes). Planes and engines would be returned to lessors, while land, buildings, plants and equipment could be sub-leased/re-leased to repay amounts owed. The amount owed (if any) in the future after the lease-related assets are monetized is unclear, so counting all the lease liabilities as net debt seems to overstate true net debt.
Under International Financial Reporting Standards (IFRS), all leases are treated as finance leases, which is a form of financial debt. But a right-of-use asset (£1.1B) and property, plant & equipment (PP&E, £3.9B) are also recorded for RR on the asset side of the ledger. The result is higher net debt as lease liabilities are included, but also higher EBITDA as lease expenses flow through the income statement as depreciation/amortization (D&A) of the right-of-use assets and finance charges. So in my view, when analyzing RR based on EBIT, the lease expense is baked into EBIT via D&A on the right-of-use asset. If adjust EBIT by subtracting the lease finance charges, then lease expenses have been fully baked into EBIT and lease liabilities should not be included in net debt. The same logic applies to EPS valuation as well since it falls below the EBIT line. When analyzing RR based on EBITDA, then D&A is not included, and hence lease liabilities should be included in net debt. And when valuing RR based on EBITA, then EBITA should be calculated as EBITDA – CapEx – Additions to Intangibles – Cash Lease Payments. Since EBITA is adjusting for cash lease payments, then lease liabilities should not be included in EV.
Cash and Current Working Capital Needs
Calculating RR’s net debt requires an understanding of true excess cash on the balance sheet. RR often receives cash upfront as deposits for OE deliveries or payments for EFHs. However, this cash doesn’t truly belong to RR as RR uses some or all this cash to pay for contracted deliveries or services. While customers finance some working capital needs with OE deposits and EFH payments, RR also finances working capital needs at times. For example, for an OE delivery requiring 20% deposit, the deposit may finance initial working capital needs, but RR then must finance working capital needs to complete and deliver the OE. RR is then paid upon delivery. So when evaluating the current cash needs to fund working capital, I look at current assets of Inventories, Trade Receivables and Contract Assets against Trade Payables and Contract Liabilities (Table 2).
|
Current Inventories |
4,446 |
|
Current Trade Receivables |
5,993 |
|
Current Contract Assets |
1,498 |
|
Total Current Assets for WC |
11,937 |
|
Current Trade Payables |
6,681 |
|
Current Contract Liabilities |
4,214 |
|
Total Current Liabilities for WC |
10,895 |
|
Net WC Liabilities |
(1,042) |
Table 2: RR Net Working Capital Liabilities
RR’s current non-cash assets for working capital well exceed current liabilities. So current cash on the balance sheet does not need to be used to fund working capital needs for the next year.
RR also has £1.9B of Non-Current Trade Payables and £6.9B of Non-Current Contract Liabilities. This may look like a significant financial burden, but digging in reveals that the financial burden is much less than what appears. Much of the Non-Current Contract Liabilities is LTSAs. As RR receives contractual payments for EFHs over time, the LTSA balance builds up as Contract Liabilities. As RR fulfills maintenance obligations, the LTSA balance declines and Aftermarket Services revenue is recognized. Estimates show 40% gross margin for Large Engine LTSAs, so 40% of the Large Engine LTSA balance should convert to gross profit once maintenance services are performed (assuming no Trent 1000-like issues)-so that greatly reduces the financial burden of Non-Current Contract Liabilities. The cash that RR receives for EFHs has to fund parts (Inventory) and labor (Payables) to complete near-term shop visits and pay for longer-term assets such as facilities, equipment and tools (PP&E and Right-of-Use Assets). As discussed in the Lease Liabilities section, RR has £1.1B of Right-of-Use Assets and £3.9B of PP&E, for £5B of hard fixed assets against £1.9B of Lease Liabilities, leaving £3B of fixed assets funded through Borrowing and/or EFH receipts. Table 4 also shows that current working capital assets ex-cash exceeds working capital liabilities by £1B.
Bottom line: I do not know exactly what the true financial burden of £8.8B in Non-Current Trade Payables and Non-Current Contract Liabilities is, but it’s substantially lower than it appears. Is there a risk that RR squandered the cash received from EFHs and cannot meet contractual commitments? Yes. Is it likely? No. To my knowledge, RR has not had any issues meeting contractual commitments historically. Even with the Trent 1000 problems, RR responded with urgency and laid out £1.4B to fix the issues. So in calculating excess cash, I’ll focus on current working capital needs and ignore Non-Current Trade Payables and Contract Liabilities. The current working capital needs do not appear to require RR to use cash, so we’ll count the current cash as entirely excess cash.
Provisions
RR has £2.2B in Provisions under Liabilities. The largest Provision item is £1.5B for Contract Losses and £300M for Warranty and Guarantee. Contract Losses occur when engines do not perform as RR expected when delivered (Trent 1000 engines for example), so the expected maintenance costs exceed expected EFH receipts. Warranty and Guarantee are for the estimated remediation costs for products sold with warranties and/or guarantees. Provisions are more “soft” debt, as they are based on estimates and forecasts that often change versus Borrowings where cash payments are due on a schedule. Nevertheless, Provisions should be accounted for in calculating RR’s EV. But given the “soft” debt nature, I excluded Provisions from my evaluation of RR’s current debt load below.
Current Debt Load
The vast majority of gross debt is £4.0B in notes with weighted average fixed rate of 3.7%. That’s ~£150M of annual cash interest expense on the notes. Table 3 breaks down RR’s various debt ratios. Overall, the “hard” debt load (excluding Provisions) is moderate, and I would like to see management continue paying it down.
|
Net Debt |
3,100 |
|
Net Debt ex Leases |
1,200 |
|
Interest Expense on Notes |
150 |
|
2023E EBITDA |
1,800 |
|
2023E EBITA ex New Markets |
660 |
|
Net Debt/2023E EBITDA |
1.7 |
|
Net Debt ex Leases/2023E EBITA ex New Markets |
1.8 |
|
2023E Interest Coverage (EBITA/Interest) |
4.5 |
Table 3: RR Debt Ratios
Valuation
There are different ways to value RR. The first step is to understand RR’s enterprise value (EV).
Enterprise Value (EV)
RR shares currently trade at £0.87 (as of 12/1/2022). With 8.3B shares outstanding, RR current market cap is £7.2B. After completing £2B of disposals, net debt will be £3.1B including leases, or £1.2B ex leases. There are then non-operating assets/liabilities to further adjust EV, including Provisions, investments, deferred tax assets (DTA) and pension. Table 4 details the calculation for RR’s £8.2B EV.
|
Share Price (12/1/2022) |
0.87 |
|
Market Cap |
7,272 |
|
Net Debt ex Leases |
1,200 |
|
Provisions |
2,248 |
|
JV & Associates |
502 |
|
Post Retirement Surplus |
48 |
|
Net DTA |
1,969 |
|
EV |
8,201 |
Table 4: RR EV
Consensus EV/2024E EBITA and Value per Share
I calculate 2024E EBITA ex New Markets of ~£1B based on consensus estimates. I exclude the losses from New Markets as they’re essentially venture-like R&D investments and not a permanent cost center. So RR is trading at 8.2x EV/2024E EBITA. RR’s peer comps are currently trading at 11x EV / 2024E operating income. So valuing RR at 10x EBITA should be fair/slightly conservative. RR should generate at least £1.2B in FCF from now through 2024, so the current net debt of £1.2B ex-leases should become 0. To simplify, I assume the value of Provisions, investments in JV and Associates, Post Retirement Surplus, and Net DTA stay the same. I get £1.35 per share valuation (see Table 5 for calculations) in 2024E, or a 24% internal rate of return (IRR).
|
2024E EBITA |
1,000 |
|
EBITA Multiple |
11x |
|
Value of Business |
11,000 |
|
Net Debt |
– |
|
Provisions |
2,248 |
|
JV & Associates |
502 |
|
Post Retirement Surplus |
48 |
|
Net DTA |
1,969 |
|
Value of Equity |
11,271 |
|
Value of Equity per Share |
1.35 |
Table 5: RR 2024E Value per Share Based on Consensus EBITA
Management Guidance
In March 2021, management guided to >£750M FCF as early as 2022 (see Figure 6).
Figure 6: RR FCF Guidance (RR May 2021 Presentation)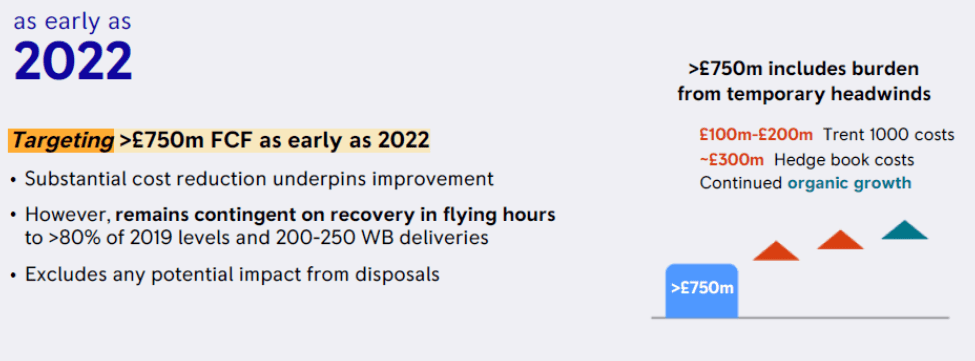
As management stated, the FCF guidance is contingent on EFHs at >80% of 2019 levels and 200-250 WB OE deliveries. However, management has stopped reiterating this FCF guidance in 2022. The most recent Trading Update stated that 2022 YTD EFHs are only at 62% of 2019 levels, and only 65% for the four months through October 2022. So RR will not hit £750M FCF this year.
However, management does state that the £750M FCF includes £300M hedge book costs and £100M-£200M Trent 1000 costs. If I tax effect £300M of hedge book costs and £200M of Trent 1000 costs at the consensus effective tax rate of 28%, that’s an additional £360M of normalized FCF power. So the true FCF power excluding one-time costs is £750M + £360M = ~£1.1B. With peers trading at 20x 2023E FCF and 16x 2024E FCF on average, a 15x FCF multiple seems reasonable/conservative. RR should generate at least £500M in FCF now through 2023E, so net debt ex leases should be down to £700M. So if RR meets all the conditions required for £750M FCF in 2023 and one-time costs with the hedge book and Trent 1000 pass, then RR shares should be worth £1.92 per share in 2023 as shown in Table 6 – that’s a 121% return. Again, to simplify I assume the value of Provisions, investments in JVs and Associates, Post Retirement Surplus and Net DTA stay the same.
|
2023E FCF |
1,100 |
|
FCF Multiple |
15x |
|
Value of Business |
16,500 |
|
Net Debt |
700 |
|
Provisions |
2,248 |
|
JV & Associates |
502 |
|
Post Retirement Surplus |
48 |
|
Net DTA |
1,969 |
|
Value of Equity |
16,071 |
|
Value of Equity per Share |
1.92 |
Table 6: Valuation Based on Management FCF Guidance
While 80% of 2019 EFHs is 12.2M, returning to 100% 2019 EFHs would be an additional 3.1M EFHs. The expected gross profit per EFH is ~£75. 3.1M EFHs * £75 Gross Profit per EFH = £233M incremental gross profit. If assuming the incremental gross profit requires no additional overhead, then the entire incremental gross profit should convert to FCF after taking out taxes, which is incremental FCF of ~£170M. So RR should have FCF power of £1.3B in 2024E if EFHs fully recover to 2019 levels based on management guidance. If assuming RR has no net debt by 2024E and keep Provisions, investments in JV & Associates, Post Retirement Surplus and Net DTA the same, then RR shares should be worth £2.37 (shown in Table 7) in 2024E for an IRR of 65%.
|
2024E FCF |
1,300 |
|
FCF Multiple |
15x |
|
Value of Business |
19,500 |
|
Net Debt |
– |
|
Provisions |
2,248 |
|
JV & Associates |
502 |
|
Post Retirement Surplus |
48 |
|
Net DTA |
1,969 |
|
Value of Equity |
19,771 |
|
Value of Equity per Share |
2.37 |
Table 7: RR FCF Valuation at 100% 2019 EFHs Based on Management Guidance
Sum-of-the-Parts (SOTP)
In 2024E, Defence is expected (by consensus estimates) to generate £3.7B revenue and £435M EBIT (12% EBIT margin). Power Systems is expected to generate £3.4B revenue and £358M EBIT (11% EBIT margin). Combined Defence and Power Systems should generate £800M in EBIT. I’ve discussed above that Defence and Power Systems are stable businesses, and therefore should be worth at least 11x EBIT, or £8.8B. Corporate costs are -£50M and lease interest costs are -£60M, for -£110M per year. Assuming that RR wants these expenses to grow at a slower pace than revenue, a 10x multiple seems reasonable and puts the EV of the costs at -£1.1B. So Defence, Power Systems, Corporate and lease interest combine for £7.7B EV compared to the £8.2B EV that RR is currently trading at. Investors are paying effectively only £500M for the Civil business that should generate £6.3B revenue in 2024E.
Management has guided that Civil will grow OE revenue low teens and Services revenue high single-digit CAGR in the medium term (see Figure 7) while achieving high single-digit profitability (see Figure 8). For reference, competitor GE Aviation expects to grow revenue >20% and generate high-teens operating margin in 2023F, so RR management’s guidance seems reasonable/conservative. Given that GE’s revenue mix has significant NB exposure that’s already close to fully recovered, RR could exceed management’s guidance given the higher exposure to WB recovery. Long-term, GE Aviation expects mid-single-digit revenue growth and high-teen to 20% operating margin. So RR should be able to achieve at least 10%+, maybe even 15%+, profitability longer-term as well.
Figure 7: Management Revenue Guidance (Civil Investor Day May 2022) Figure 8: RR Profit Outlook Civil (Investor Day May 2022)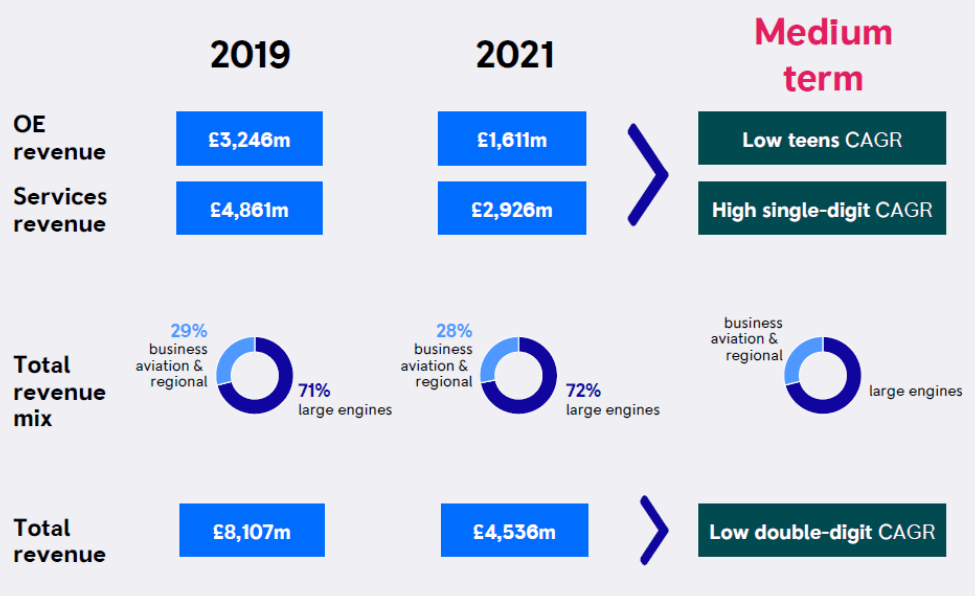
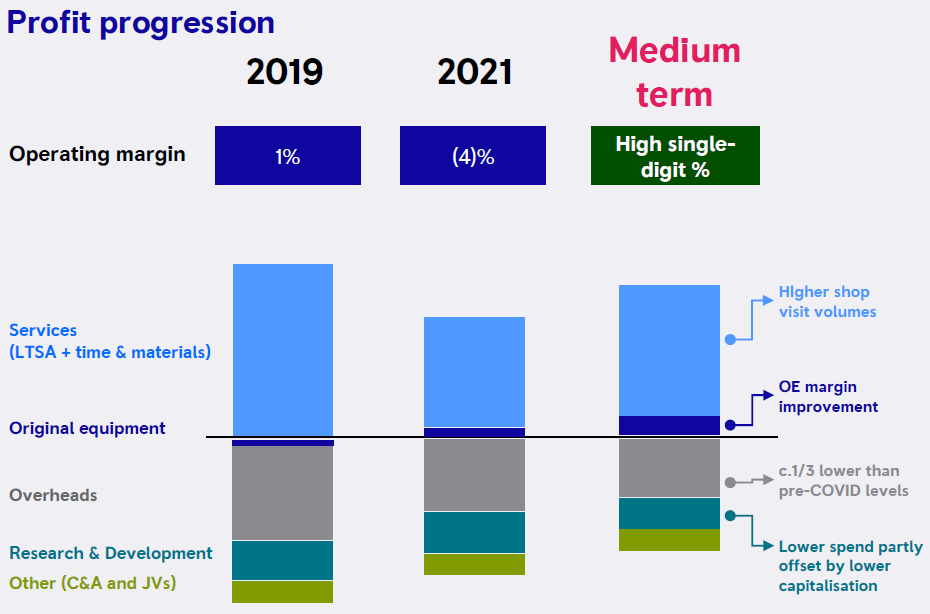
Overall, Civil has the growth and profit profile of a business that should trade above 1x revenue. If value at just 1x revenue, then Civil is worth £6.3B in 2024E. I excluded New Markets from my valuation as discussed previously. Putting everything together, RR should be worth at least £1.71 per share (shown in Table 8) in 2024E using the SOTP method assuming RR has no net debt by 2024E and keeping Provisions, investments in JV & Associates, Post Retirement Surplus and Net DTA the same. That’s a 40% IRR.
|
Value of Defence and Power Systems |
8800 |
|
Value of Civil |
6300 |
|
Value Corporate and Lease Interest Expense |
-1100 |
|
Value of RR’s Businesses |
14000 |
|
Net Debt |
– |
|
Provisions |
2,248 |
|
JV & Associates |
502 |
|
Post Retirement Surplus |
48 |
|
Net DTA |
1,969 |
|
Value of Equity |
14,271 |
|
Value of Equity per Share |
1.71 |
Table 8: RR SOTP Valuation
Management
Rolls-Royce is currently led by CEO Warren East. East has been CEO since 2015 and will step down at end of year. While the stock is down substantially under his leadership, he has dealt with challenging circumstances with the Trent 1000 problems and impact of COVID. In my view, he’s made tough decisions during tough times but generally made the right long-term decisions. When the Trent 1000 issues surfaced, East acted with urgency and spent £1.4B to address the problems. He understood that RR’s reputation and relationship with customers was paramount. During the COVID downturn, East implemented drastic cost reductions that should lower RR’s cost base so that RR will run leaner and more profitably going forward. The most painful decision for me as a shareholder was the dilutive rights offering, but again I understand the challenging circumstances at the time and why RR needed more cash without borrowing more.
East’s successor will be Tufan Erginbilgic. Erginbilgic has never been CEO of a public company, but he is a seasoned executive who spent 20 years at BP. The change in RR CEO presents some risk since Erginbilgic is unproven as a public company CEO.
RR’s current executive incentive compensation focuses on generating cash, reducing debt, and delivering total shareholder returns (TSR). Figure 9 shows the 2022 and 2023 targets.
Figure 9: RR Management Incentive Compensation Targets (2021 Annual Report)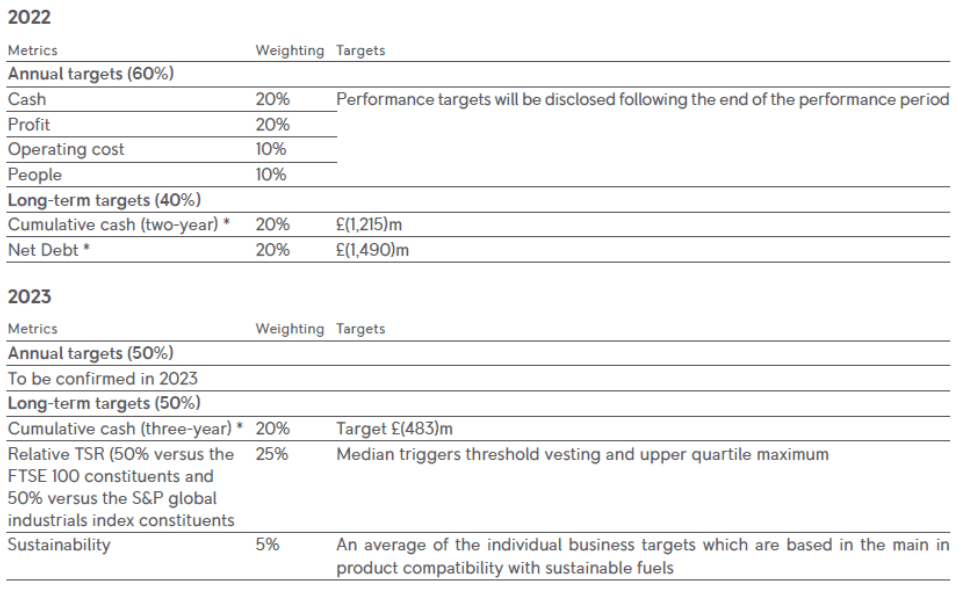
Long-term incentive awards are delivered in shares in 3-4 years to better align with shareholder interests. Overall, I support the incentive compensation plan as the targets align with what I believe are the right priorities for management.
Risks
Inflation
Inflation in RR’s costs presents a risk, especially with Civil PBTH contracts. The costs of labor and parts to service engines may increase in an inflationary environment, causing margin compression. RR contracts typically have collar pass-through clauses, wherein small price increases can be passed through, then there are 2-3% of cost increases RR can’t pass through, followed by hyperinflationary clauses that allow for cost pass-throughs above a certain amount. While RR has tried to manage inflation with long-term contracts with suppliers, the reality is that RR might have to take 2-3% cost hit at elevated levels of inflation.
China’s Zero-Covid
China’s restrictive Zero-Covid policies have been a huge drag on the recovery of long-haul air travel. RR management stated that Chinese airlines represented 19% of global EFHs in 2019, but only 11% currently. The full recovery to 2019-level EFHs is predicated on China loosening Zero-Covid so that people can more easily come in and out. With recent news of mass protests in China, Zero-Covid does not seem sustainable for another 2 years – but unfortunately, we don’t really know.
Competition
As shown in Figure 2, the WB engine market is dominated by GE (~50% market share), RR (~30% market share) and PW (~15% market share). GE tends to have more market share on Boeing aircraft, while RR has more market share on Airbus aircraft. Given the criticality of the industry to air transportation, I don’t think customers or governments want any further consolidation – so 3 major players are where the industry will probably stay.
In terms of product differentiation, the Trent XWB is “the most efficient aero engine in the world with unequaled on-wing reliability.” The Trent XWB is also the 3rd most powerful engine behind GE90 and PW4000, with four models of Trent engines ranked in the top 10 most powerful. GE seems more focused on power with its WB engines like the GE90. PW touts its Geared Turbo Fan (GTF) technology that increases engine efficiency as the key differentiator. Overall, RR competes well on the technology, efficiency, and reliability of its engines.
NB Displacing WB
There’s concern that the increasing range of NB aircraft could displace WB on long-haul flights, especially transatlantic flights. However, NB has never made up more than 10% of transatlantic flights going back to 2011. Running NB over WB may make sense during periods of low demand, such as winter for transatlantic routes. However, during high demand, the economics for WB are far better than NB since WB carries ~50% more passengers. Also, WB is generally more spacious and comfortable for long-haul flights. Overall, I don’t view NB displacing WB as a big risk to RR.
Ultrafan
RR’s next-generation engine program after the Trent is the Ultrafan. RR has begun construction of the Ultrafan, but does not yet have any customer orders. The Ultrafan potentially could be used on WB and NB aircraft, enabling RR to re-enter the NB market. While the Ultrafan looks promising, the new engine design is unproven. Developing the Ultrafan program will probably require another decade-long investment cycle that has risks.
Investments in Electrical and SMR
Investments in electrical and SMR could enable RR to capitalize on opportunities in decarbonization technologies for transport and power. However, these new transformational technologies also invite new competitors, including potentially more nimble start-ups. For example, Archer Aviation, founded in 2018, recently signed a deal with United Airlines for 100 electric vertical take-off and landing aircraft (eVTOL). Several other companies are also making progress on eVTOL. For SMR, there are already a few major players. Determining the winners in these markets will take many years, so we do not know when or if RR’s investments will pay off. Overall, I understand why management chose electrical and SMR as the focus of New Markets given the adjacencies to current capabilities in aircraft engines, nuclear power and power systems. I also think management will continue to be restrained with investment spending, which will contain the losses in New Markets.
Conclusion
While RR has disappointed shareholders over the last 5 years, the stock is poised to generate nice returns as international long-haul travel recovers over the next 2 years. RR’s stock is trading far below its intrinsic value with 50-150+% upside. The core businesses have fairly wide-moats/high barriers to entry and oligopoly characteristics. The balance sheet should drastically improve over the next 2 years. The change in CEO, inflation, China’s Zero-Covid policy, competition, longer range NB, and investments in Ultrafan, electrical, and SMR all present risks. But the 50-150% upside more than compensates investors for the risks, providing a highly favorable risk/reward in RR stock.
Be the first to comment