

Eoneren/E+ via Getty Images
The Gordon Growth Model, developed in the 1950s, says that the total return should be the sum of the earnings growth plus the dividend yield. Part of the perspective there is that dividends will grow with earnings.
I’ve taken to calling this the economic return, as it is the return to the investor resulting from the economic behavior of the company. This is understood to be what you might also call a mid-cycle return.
The earnings multiple (often P/E but see below) fluctuates with the mood of the markets. My count of the number of short cycles for the P/E of the S&P 500 from 1950 to 2000 is 14.
In other words, these short cycles have roughly a 4-year period. They are not at root economic. They occur about twice per recession.
But the economic return and the short cycles are not the full story. There are also long-term trends in earnings multiples. The most available data are for broad indices. Here is the S&P 500:
RP Drake from Macrotrend data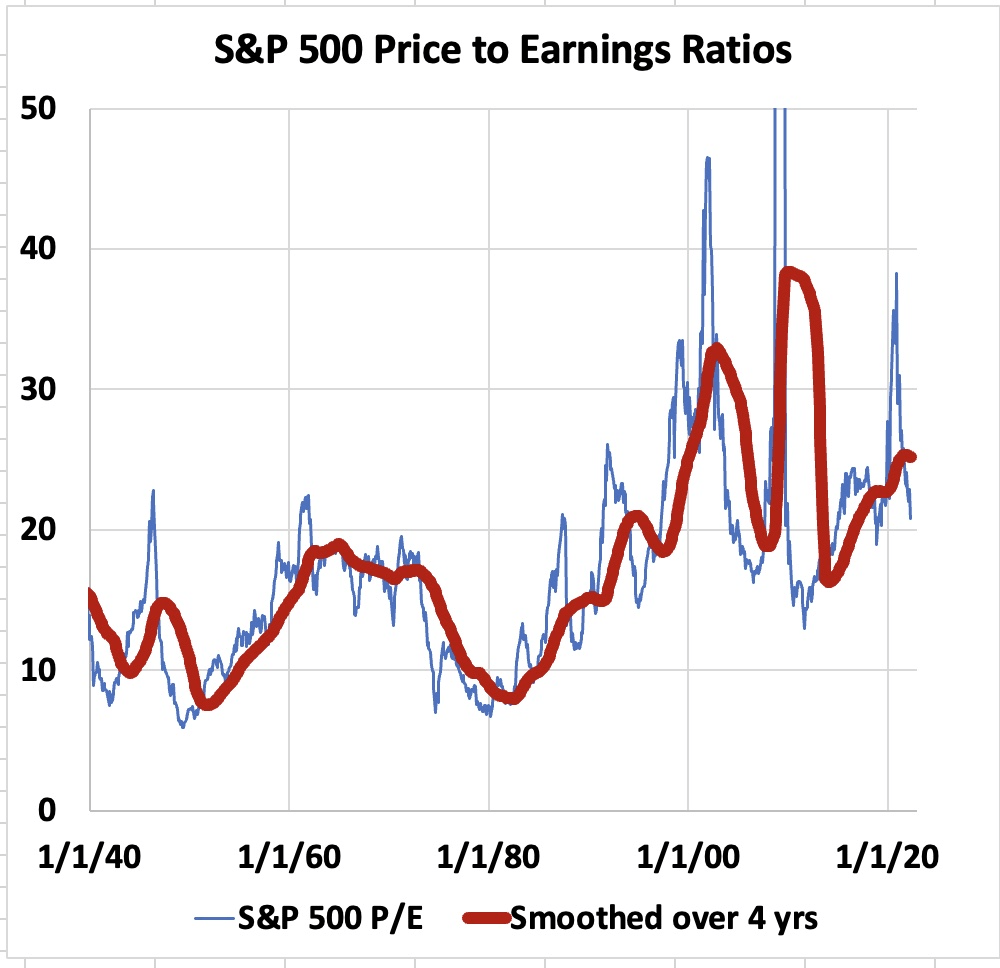
You can see that there are long-term, secular trends. The highest multiples, associated with recent price spikes and/or earnings collapses, are about 4 times the lowest ones from roughly 1950 and 1980.
It is worth noting that the period from 1940 through 1980 was the last long-term down cycle of federal debt to GDP. It was also the last secular bear market in bonds.
The connection of earnings multiples with the bond markets is that interest rates impact the discount rates that determine the value of future earnings. I discussed this topic further here, specifically for REITs.
What’s the future? You tell me.
What seems important is not any prediction, which could not be reliable for reasons expounded in detail by Howard Marks. Rather, here is what seems to matter:
- The historical lows of earnings multiples have been below half of where they are today.
- The down cycles were up to two decades long.
- The lows were during the last, long secular bear market for bonds, and we could be in the early phases of one of those now.
- Any such downtrend in earnings multiples would pose big challenges for many retirees including me.
Much of my research and writing for the past several months has focused on this issue. The previous articles have ignored the short cycles, which are the main focus below.
Looking at longer-term, midcycle trends, my conclusion was that there is more security to be had in seeking the highest dividend yields you consider secure. Earnings and dividends tend overall to keep going up as earnings multiples decline. But while you get the dividends no matter what, when you sell stock you can only extract the earnings times the multiple.
Before moving on, note that here “earnings” does not mean GAAP EPS. What it does mean depends on the sector and even the individual firm. You should figure that out for your own investments.
In REITs, my main emphasis, Adjusted Funds From Operations is often a good approximation to the earnings an investor cares about. But not always, as I’ve covered in several articles.
The present article is written in terms of general earnings and earnings multiples; you can fill in details for whatever sector you invest in.
The Base Model Here
Most of what is shown below is in the context of a base model of a possible future of midcycle behavior. It reflects my own circumstances, but you could adjust it to reflect your own. The main issue today, though, is the short cycles.
Any base model requires several assumptions:
Earnings Multiple Trajectory: My choice was a 4% per year decline for up to 25 years. The 1970s in isolation were more like 7% but viewing the 1960s and 1970s as one down period gets you to a lower number.
Perspective on Inflation: The assumption here is that both spending needs and earnings increase with price inflation, but not necessarily at the same rate. To include a potential rate difference, I grew the withdrawals at a 3% rate.
That 3% is not a projection of inflation, but rather represents the difference between increases in personal expenses and increases in business earnings. This is intended to be a pessimistic, conservative assumption, but you could replace it with your own view.
Initial Withdrawal Rate: There is some rate at which withdrawals are needed to support spending. If the dividend yield is larger than this rate, then there is not a worry about portfolio survival (barring too many dividend cuts). The opposite case, with dividends below needed withdrawals, is the one at issue here.
Earnings Growth Rate: This plus the change in earnings multiple gets you the midcycle price behavior. It varies in the cases shown below.
Dividend Yield: This determines how much growth is needed to sustain the value of the position (or portfolio). If one has a dividend yield of 7% and is withdrawing at an initial 8% rate, increasing 3% per year, then one expects to need about 4% earnings growth to sustain the position value.
The plots below are labeled for changes in “Position Value”. The results can be applied to one position or to an entire portfolio.
The trajectory of the base model is shown in the next graphic. The prior article discussed variations of several of its parameters.
RP Drake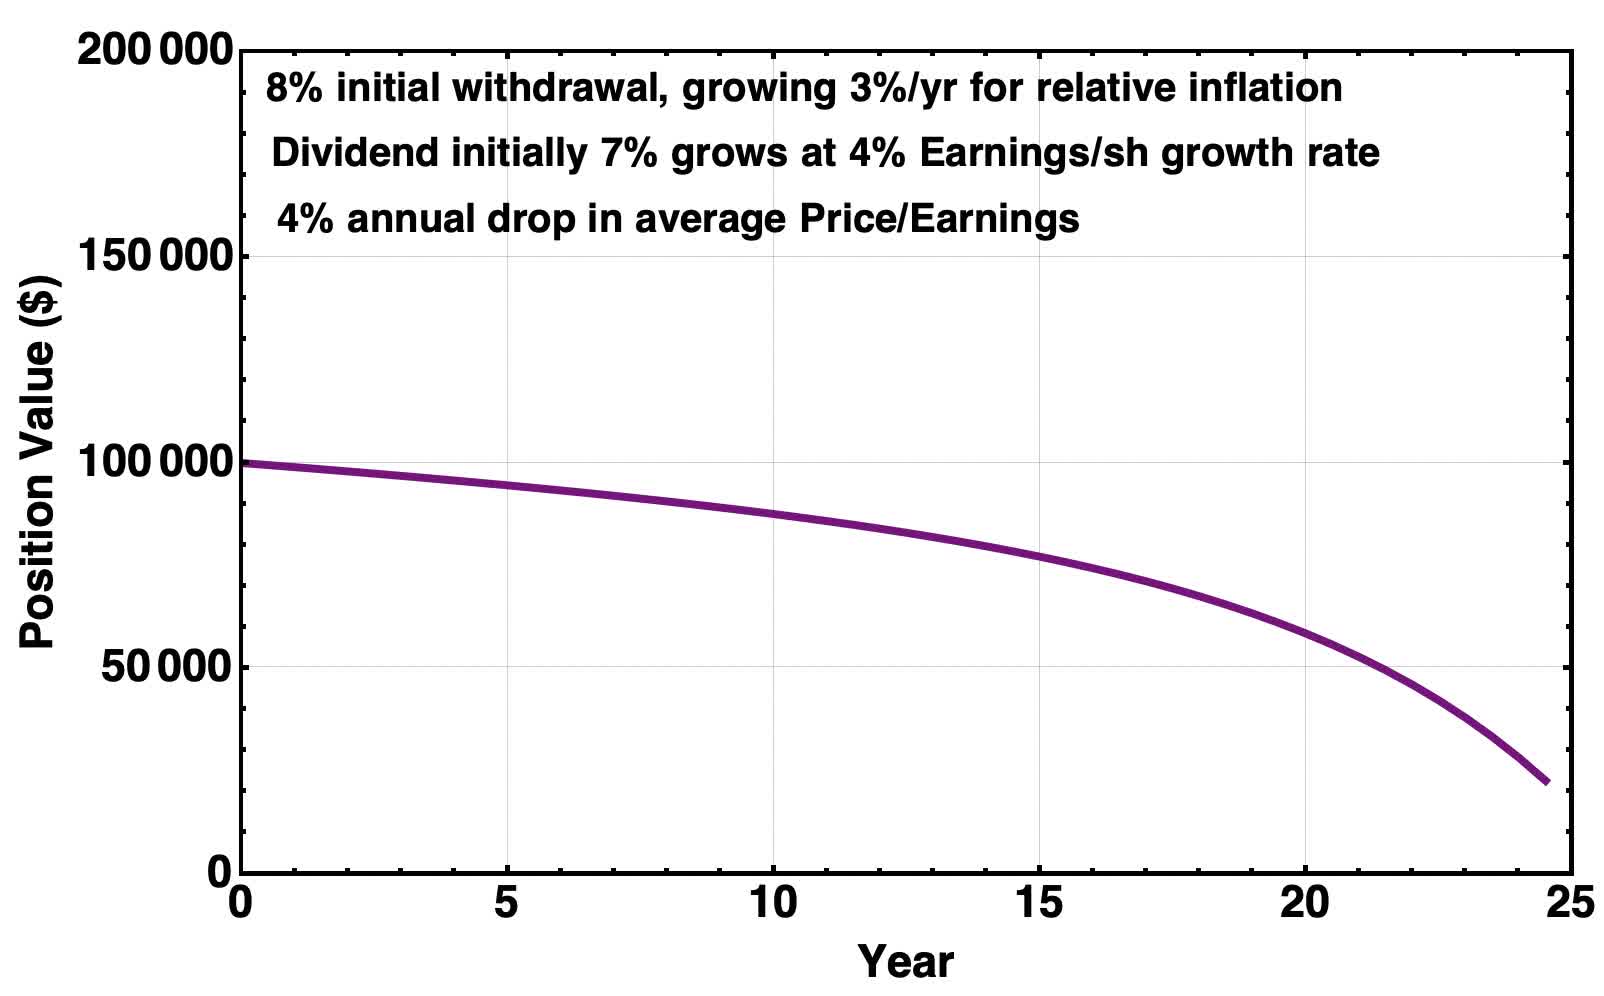
For these parameters, the position value drops gradually at first. After about year 15 the decrease accelerates. This occurs as the dividends from the depleted portfolio provide an ever smaller fraction of the required withdrawal.
Adding Short Cycles
I modeled the short cycles as sinusoids with four-year periods. This is most convenient mathematically and is also pessimistic financially.
The bear markets are harder on the position size, because withdrawals are taken with a lower stock price. But observationally, the bearish periods are shorter than the bullish ones.
The models set the cycle amplitude from peak to valley at 30% of the midcycle value. Of course, all bear markets are not identical. But this value seems a good one to capture the primary effects.
Let’s look first at how the value of the position varies with short cycles. First we let the initial phase of the market price be halfway up or down from the midcycle value to the next peak or valley.
RP Drake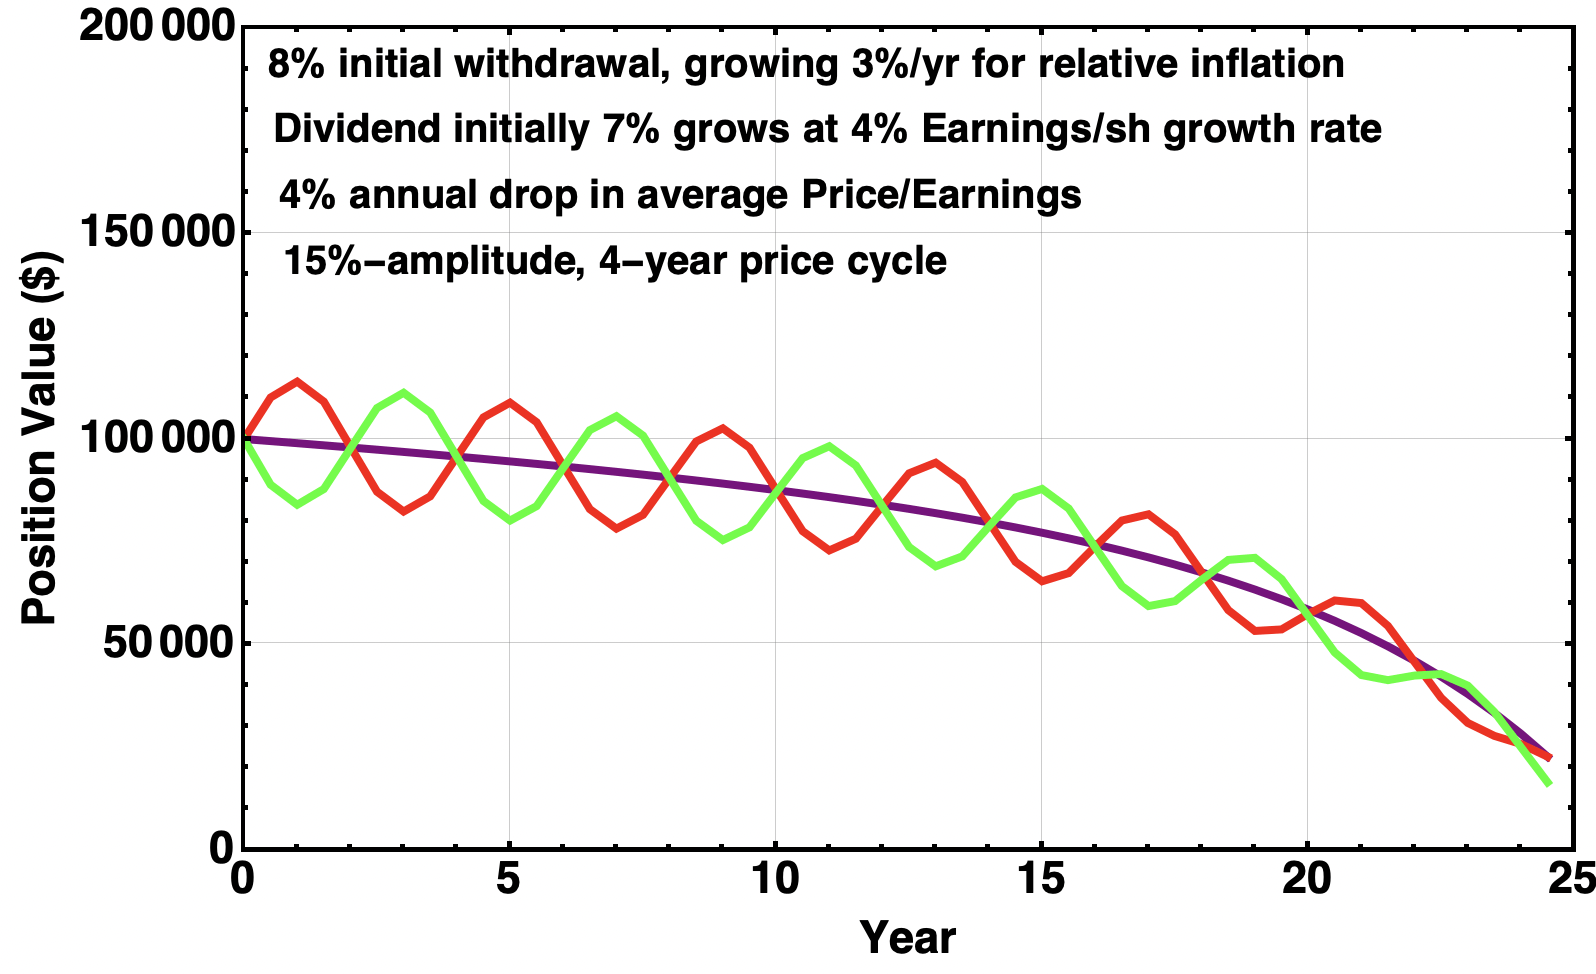
About half of all possible initial phases will produce similar results. We see that impact of the cycles is modest. It only begins to pull the midpoint of the oscillations below the midcycle curve as the position is becoming depleted, in the later years.
Now we can drop the midcycle curve and add the cases where the initial moment (i.e., now) is at the maximum or minimum of the short cycle. Those produce more extreme results:
RP Drake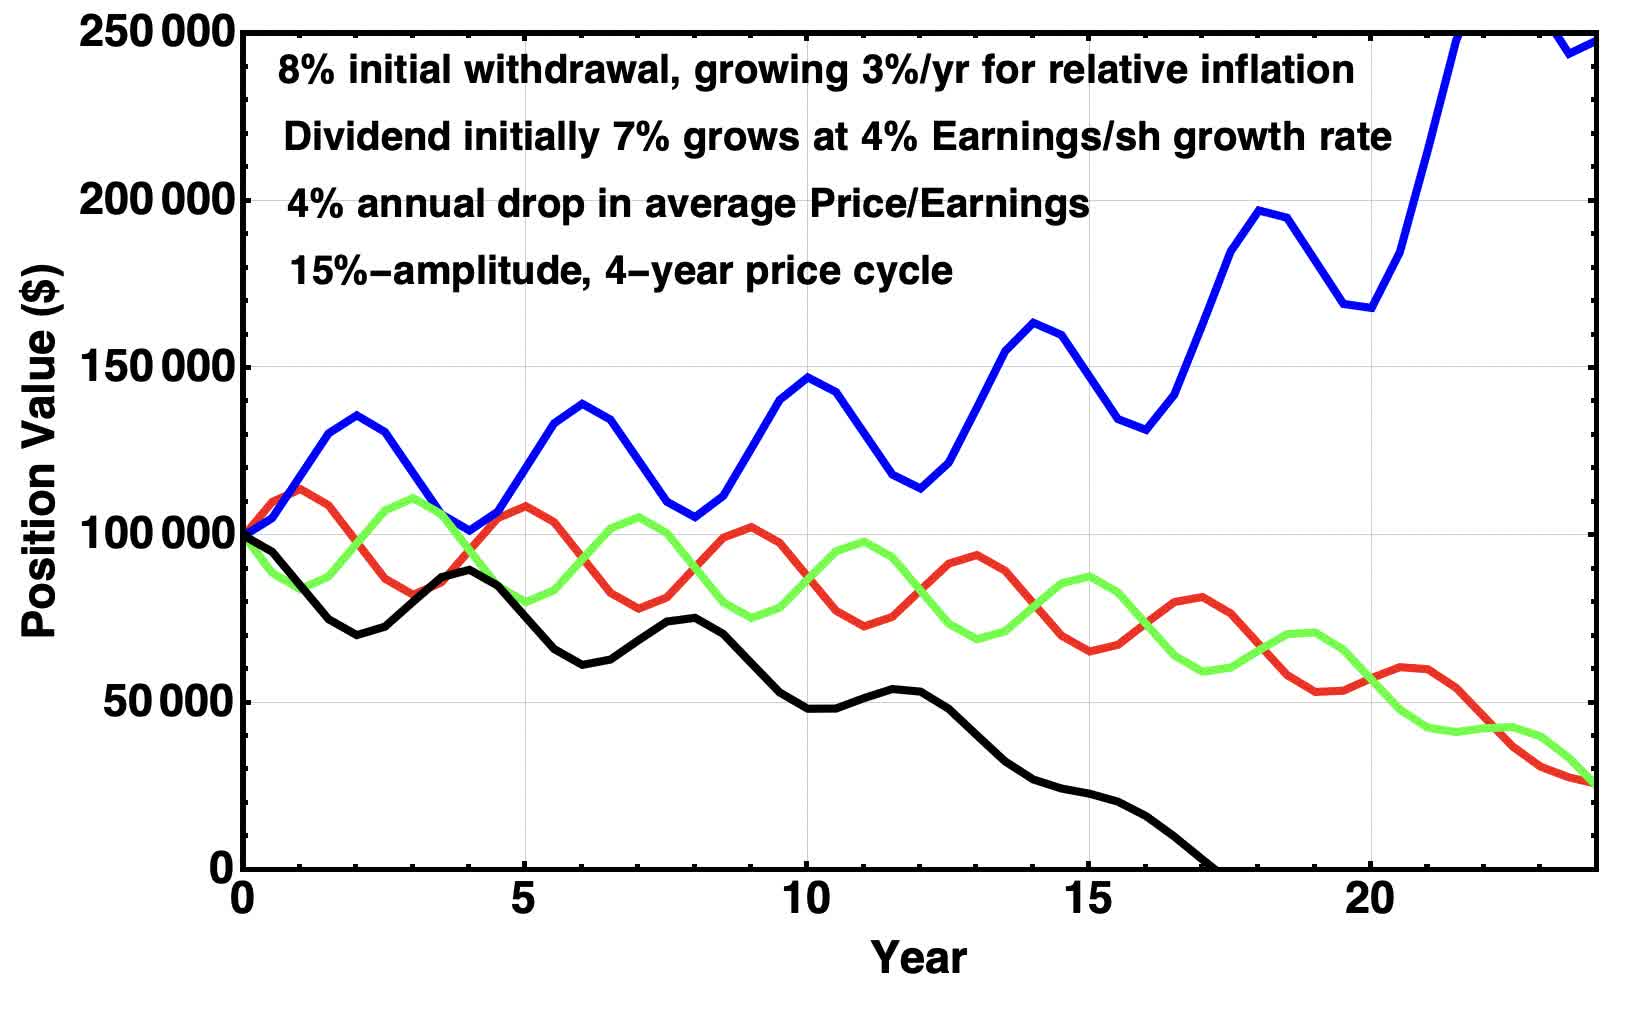
Right now we imagine that we are near the bottom of a bear phase in the short cycle. This would produce the upper, blue curve and would be a very positive result for these model assumptions.
But we cannot be certain. The phase might change across this moment — earnings multiples could drop a lot more and not come back up above where they are now.
The lower, black curve represents that case. Now the depletion needed to support the withdrawals becomes significant almost from the start. The position would become depleted in less than 20 years.
If one considers the phase of the present moment to be random, this model succeeds for 20 years in more than 75% of the cases. The odds are better than that if one thinks earnings multiples will at least partially recover from here before they next oscillate downward.
Suppose, for example, that the position appreciates 15% soon. Then its value goes to 115%, the dividend yield drops to 6%, and the needed withdrawals have an initial rate of 7%. The range of future possibilities now looks better all around:
RP Drake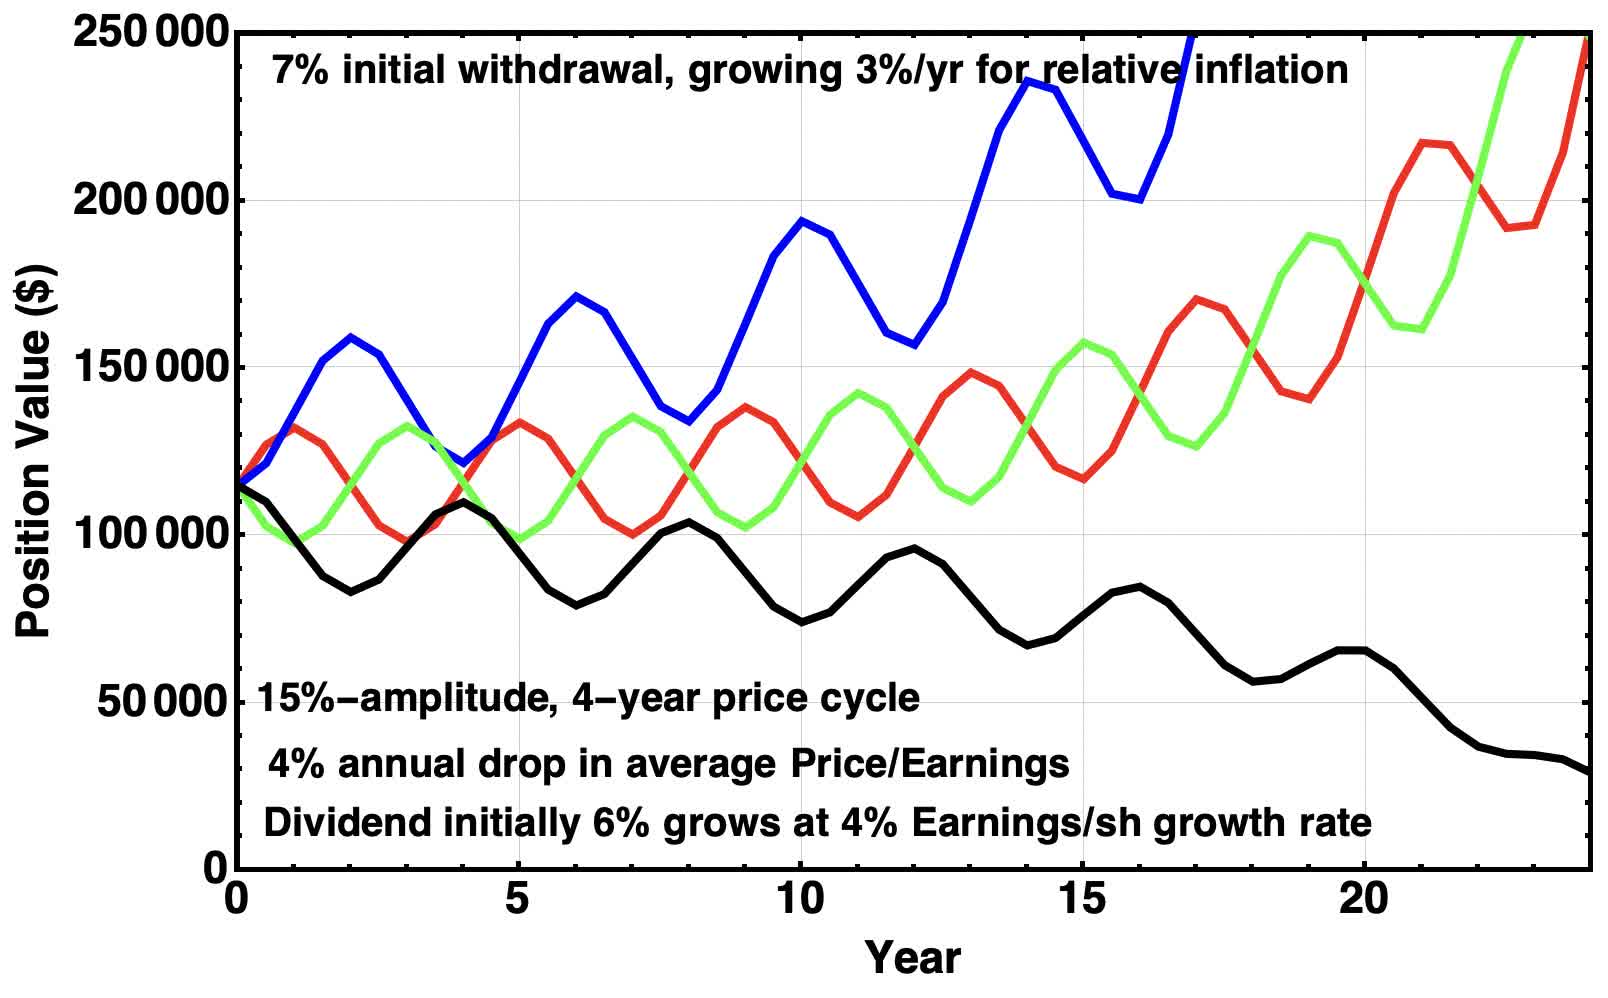
More than half of my own portfolio is in positions with attributes not far from the assumptions underlying the above. Examples include my positions in Simon Property Group (SPG) and Enterprise Products Partners (EPD). So these results are comforting to me.
Variations in Growth Rate and Dividend Yield
However, a major uncertainty in the models shown above is whether the earnings growth rate will match the assumptions. In difficult economic times, it may fall short.
Another major challenge in filling out a portfolio is that companies paying secure dividends above 5% are few and far between, even during bear markets. So looking at smaller dividend yields is also relevant.
Let’s proceed to look at both of those. For these cases the plots will show only the extreme phases of the short cycles. We know now that the less extreme ones fall in between.
The base model above assumed a 7% dividend yield and a 4% growth rate. The growth rate achieved might instead turn out to be higher or lower.
That motivates the following plot.
RP Drake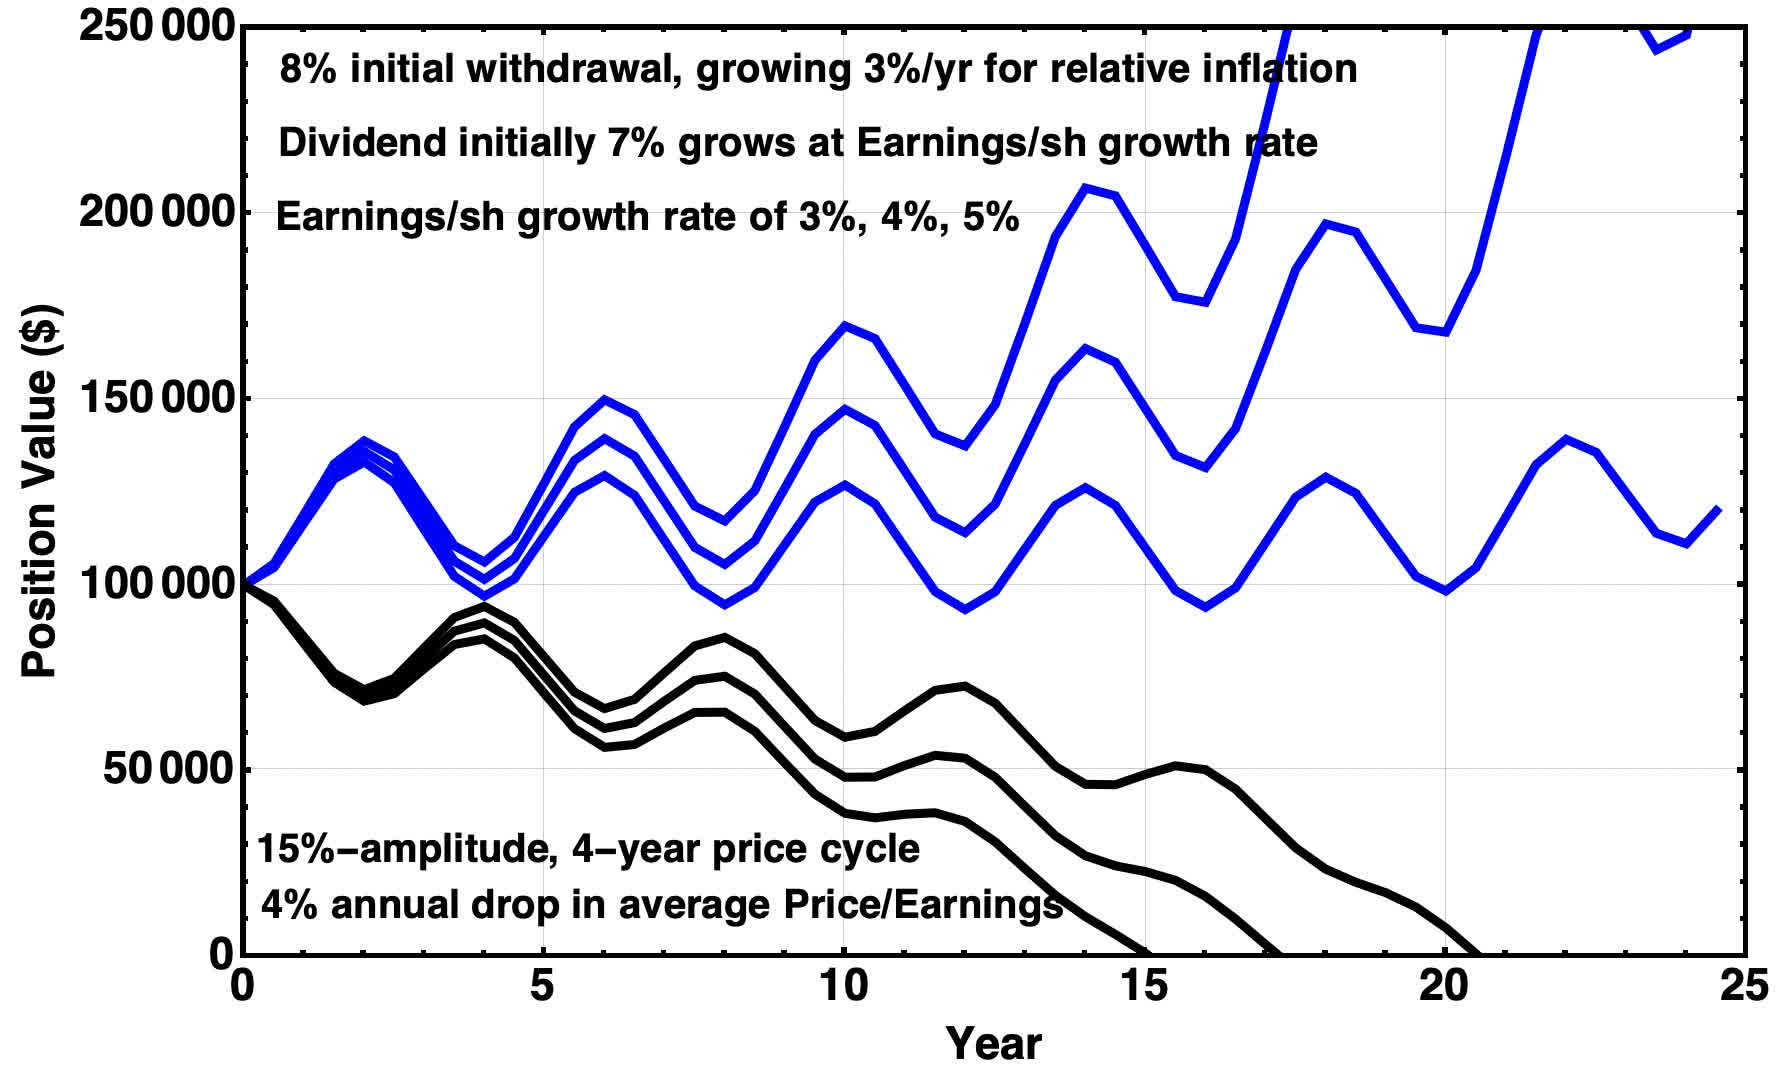
We see that the sensitivity to the starting phase in the cycle is far larger than that to the growth rate. And even for fairly large fractional growth rate changes of± 25%, the outcomes over the first ten to 15 years do not vary enough to really change any stories.
Turning to firms with lower dividend yields, there is a lot to be said for finding firms with solid growth that pay a 3% dividend. Their dividend will generally be more secure. And example from my portfolio, with a bit higher yield, is AvalonBay (AVB).
But if one needs double-digit returns to cover withdrawals, then the higher required growth rates become problematic. Here is an example, for a 3% dividend yield and growth rates of 8% or 10%:
RP Drake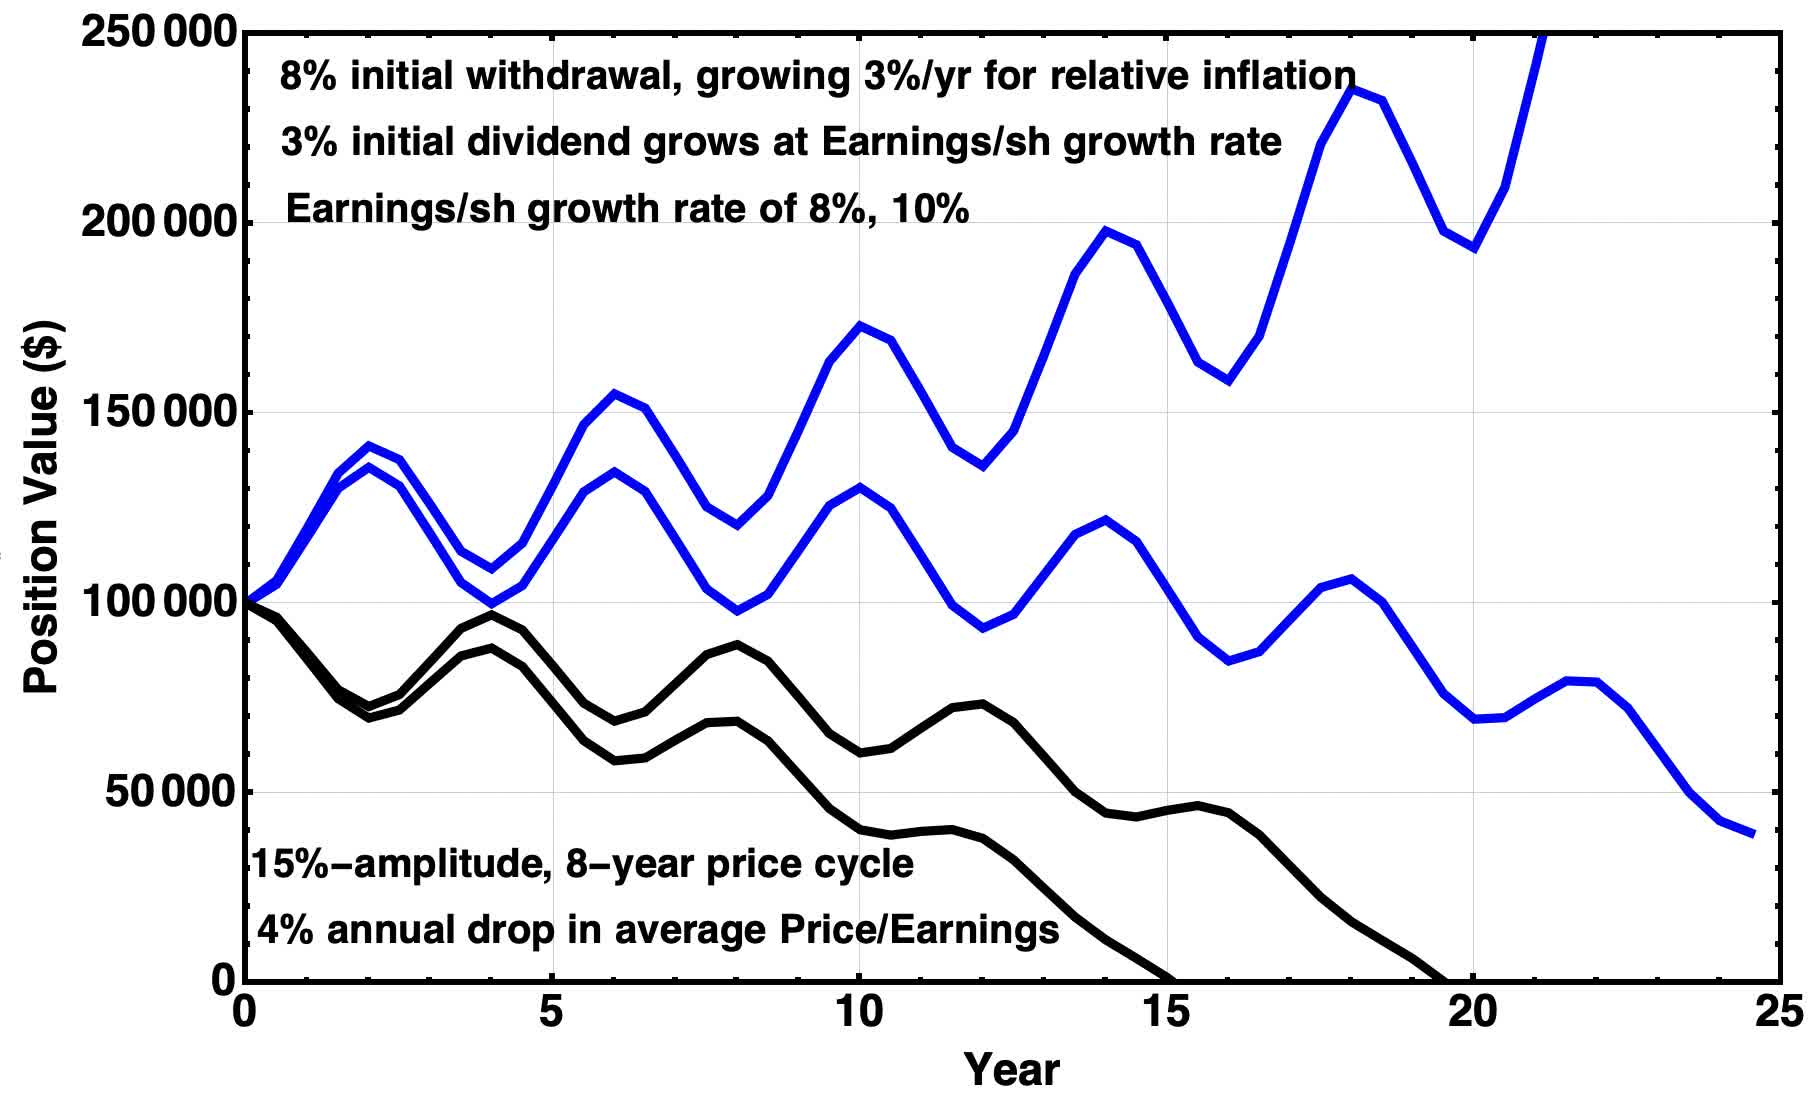
Now the range of growth rates that leads to adverse outcomes is narrower. A 10% drop in growth rate, from say 9% to 8%, significantly decreases the security of the survival of the position.
That said, if one needed something like a 7% total return to sustain the position, then going for a 3% dividend yield with a 4% minimum growth rate has a lot better odds of doing so. There is an implication here I think for investors.
As you succeed and your portfolio grows, you can hope for an opportunity to improve the security of your income. You can move down in dividend yield and risk in a way that increases the probability you will sustain portfolio value.
Countercyclical Actions
Most readers here will be trying to be proactive in bear markets, as am I. We understand the disproportionate impacts of selling stock near lows and seek to avoid it one way or another.
That said, one is likely talking about incremental gains that may not add up to a lot. The third graphic in this article, above, suggests as much.
Just to check, I did a model in which the withdrawal was doubled when the price was above the midcycle price and zero otherwise.
This approach is a bit artificial — knowing the midcycle price in real time is problematic. Even so, it ought to show us any potential for big wins. Here is the result:
RP Drake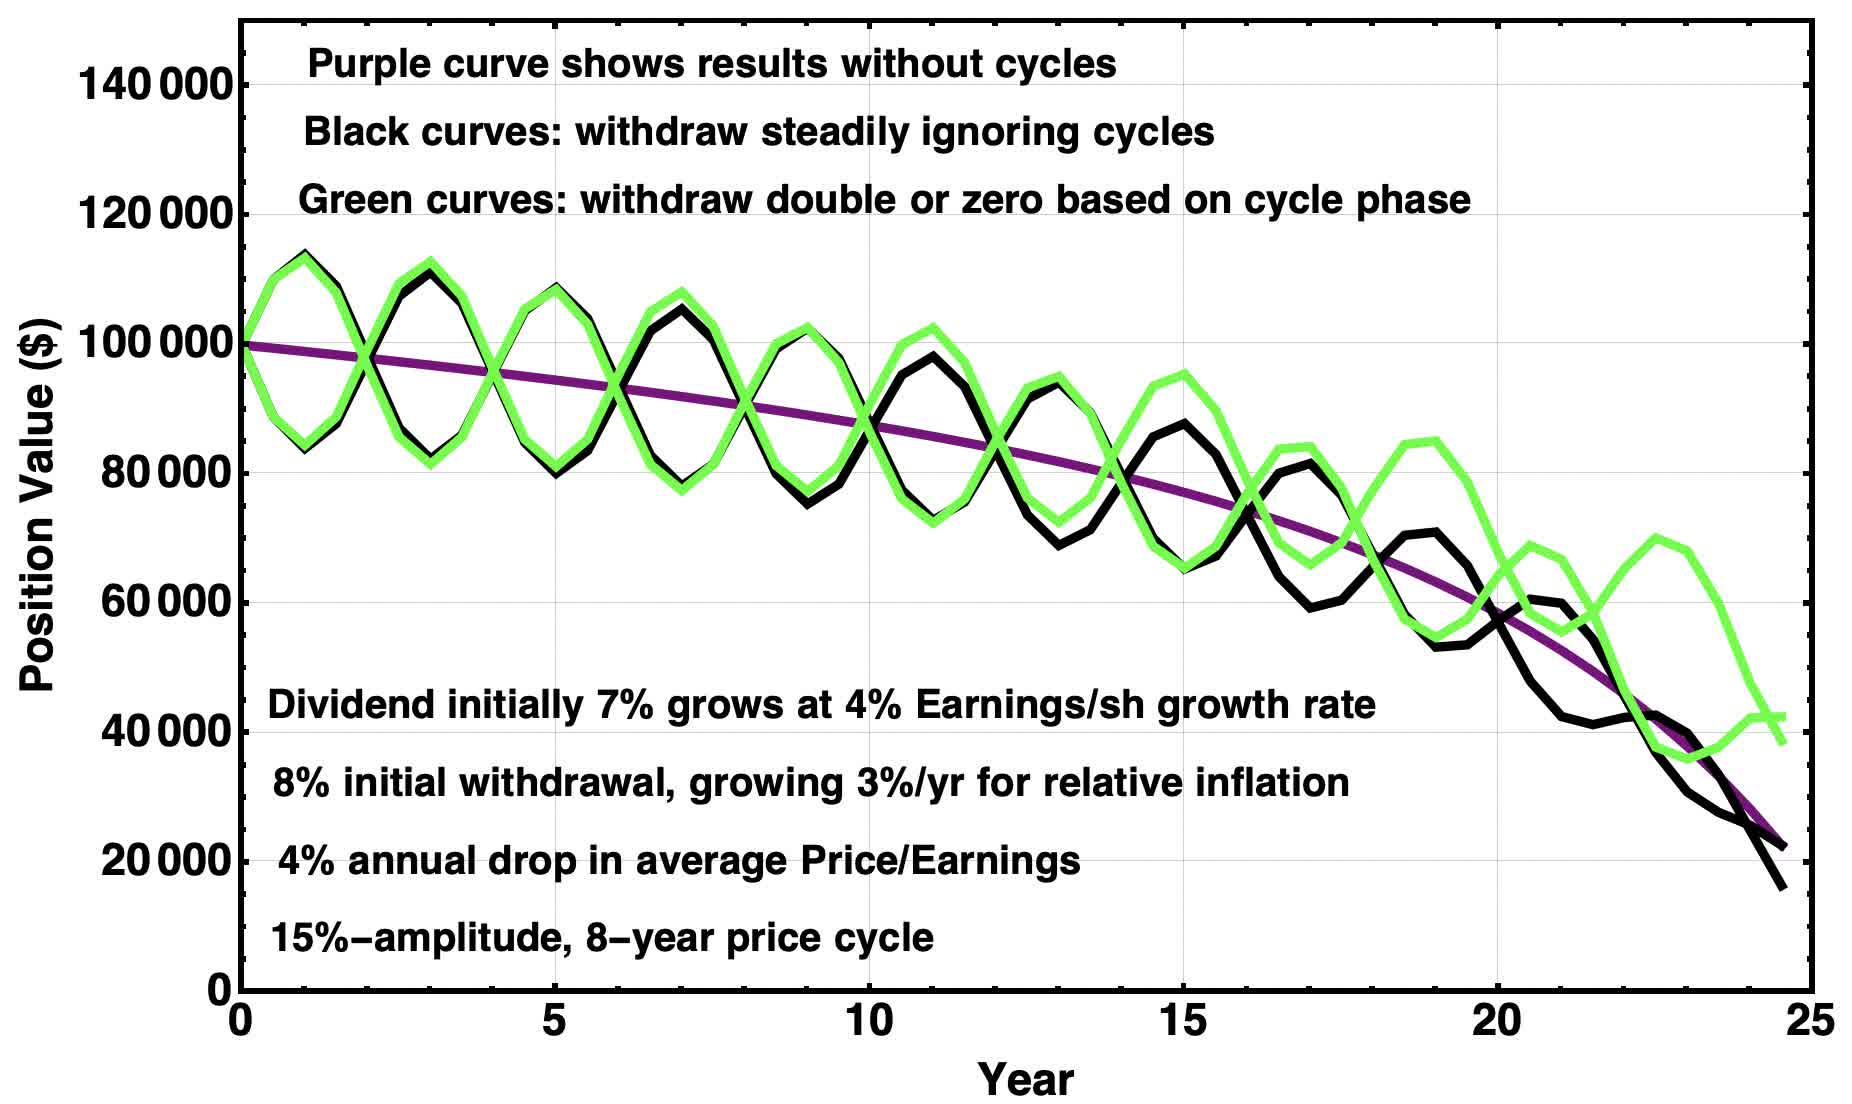
Here the black curves and purple midcycle curve were shown above. The green curves show the results with countercyclical withdrawals.
What one sees is that as the position value gets near the edge of rapid collapse, the countercyclical actions make a notable difference. But at the end of the day, they only delay the collapse by a few years.
What this tells us is that countercyclical actions are modestly beneficial. On the one hand, I can’t see myself or anyone ignoring the present phases of the market. On the other hand, this result says your time overall is better spent on monitoring and improving your investments, rather than on this kind of manipulation.
Suggestions for Investors
Here are some suggestions from me in light of the above.
If you are over 55, you should have a retirement income plan and adjust it at intervals going forward. You should understand how sensitive that plan is to earnings multiples.
To frame this point historically, the 1970s and the 2000s were both flat decades for the S&P 500. Earnings went up but earnings multiples dropped. In those decades, a recent retiree suffered disproportionately if they needed to sell stock or fund positions in large-cap domestic companies.
Pay attention to the short cycles of the markets in which you invest. Do this at least until you know that your plan can survive any phase for them. In a sense, once you are there you have won the game of retirement. (The game of life has many more aspects.)
If you want to be an active investor, you may perhaps add value by active management across cycles. So far I’ve done well at that, as discussed in other articles.
Assuming you succeed over time at increasing value, you will be able to improve the security of your income plan. It may be a better choice to move into firms with more-secure, lower dividend yields than to insist on covering all your withdrawals with higher dividends.
Be the first to comment