


Chalffy/E+ via Getty Images
80% of Regency Centers (NASDAQ:REG) portfolio is anchored by grocery stores and community centers that serve essential needs of their operating community. Their total portfolio includes over 400 properties and more than 8K tenants. At year end, the portfolio had reported leased rates of approximately 95%.
Among their top tenants are well-capitalized private and publicly traded companies. Combined with their remaining top-30 tenants, their largest tenants represent just over 30% of annualized base rents (“ABR”). And of their total population of tenants, just three accounted for more than 3% of total ABR.
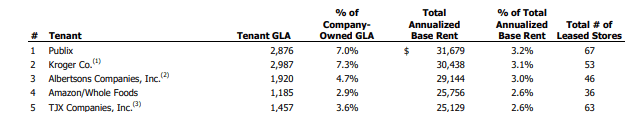
Q4FY22 Investor Supplement – Listing of Top-5 Tenants
A balance sheet with a total debt load that is the lowest in the peer set complements their strong portfolio metrics. In addition, the company generates significant free cash flows and has significant available liquidity.
YTD, shares are up about 6% and are even up 2.5% over the past year. The one year gains are notable, considering most others suffered significant losses through 2022.
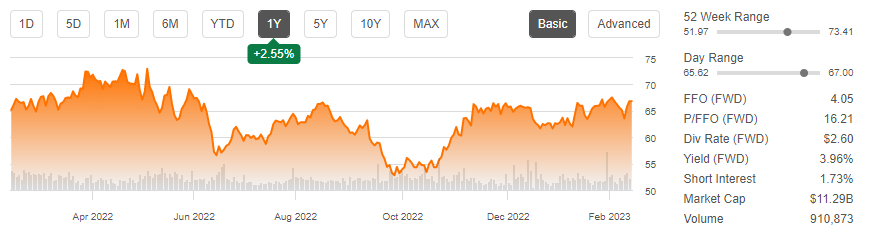
Seeking Alpha – Basic Trading Data of REG
The company is also rated favorably among Wall Street analysts and Seeking Alpha’s (“SA”) authors, as well as their quant system. These ratings are backed up by strong fiscal 2022 performance and an overall positive outlook for 2023. Shares, however, are currently priced at a premium to others within the sector. While the stock can trend higher, the upside potential is limited.
Recent Performance and Current Portfolio Metrics
In the final quarter of the year, REG signed 1.7M SF of space at blended cash spreads of 7.2%. 279K SF of the total activity was attributable to new signings at cash spreads of 5.9%, while the renewals represented the remainder at cash spreads of 7.5%.
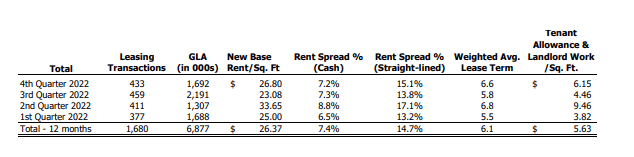
Q4FY22 Investor Supplement – Quarterly Summary of 2022 Leasing Activity
Compared to prior quarters, the total new signings were consistent in terms of square footage signed. But rent growth did take a step back. In Q2 and Q3, for example, rents on new signings were marked up 18.3% and 14.1%, respectively.
Similarly, rent growth also slowed on renewals, as did the total square footage signed. Offsetting this was greater weighted average lease terms of 6.2 years versus in the mid-5s in prior quarters.
Overall, at period end, occupancy within their wholly-owned portfolio stood at a leased rate of 94.8%. For their same-property portfolio, it was 95.1%. This is up 40 basis points (“bps”) on a sequential basis and 80bps YOY.
Among same-property shops and anchors, occupancy stood at 92% and 96.9%, respectively. This is up 60bps and 20bps, respectively from last quarter.
Though the same-property leased rate was 95.1%, physical occupancy stood at 92.8%. The 230bps signed but not commenced pipeline (“SNO”) represents approximately +$34M in ABR. This is about 3.5% of their total ABR.
In addition to inherent opportunities in pending commencements, REG also has double-digit expirations beginning in 2024 at ABRs per SF that are currently below the rates commanded on their current signings. This should provide REG with a favorable runway for base rental growth in future periods.
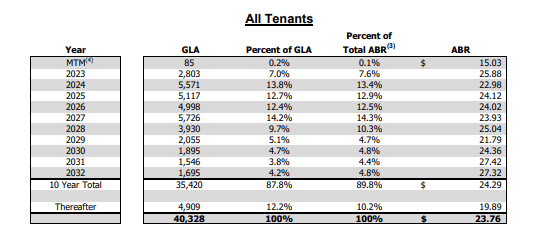
Q4FY22 Investor Supplement – Lease Expiration Schedule
Liquidity and Debt Profile
REG’s current targeted leverage range is between 5.0-5.5x earnings. Presently, the multiple continues to remain on the lower end of that range, at just 5.0x. And as a percentage of their total market capitalization, net debt was less than 30% at year end.
Their current debt position is also well within their required covenants, and the company clearly has ample capacity to handle a greater load. Interest coverage, for example, stands at 5.1x. This is on a total composition that is essentially 100% fixed rate.
In addition, fixed charge coverage is currently 4.7x. This is consistent with prior quarters and in-line with expectations.
The strong coverage ratios are offset in part by a debt stack that could benefit from a greater weighting of maturities to later years. Though REG has no near-term maturities, the company will need to address larger maturities beginning in 2024. All considered, about 80% of their total debt will mature in less than 10 years.
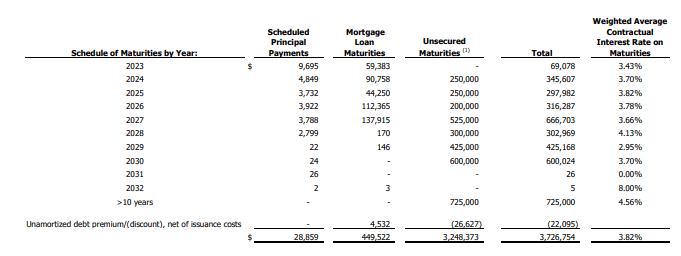
Q4FY22 Investor Supplement – Debt Maturity Schedule
While there are no concerns regarding their ability to meet their upcoming obligations, the greater weighting of debt to the nearer term exposes the company to greater interest rate risks relating to refinancing.
Nevertheless, REG remains in a prime liquidity position, with immediate availability of +$1.2B on their revolver. In addition, they expect to generate over +$140M in free cash flow in 2023. This is more than enough to self-fund their development and redevelopment commitments.
Dividend Safety
REG’s current quarterly payout is $0.65/share. Annualized, this represents a yield just shy of 4%. Compared to peers within the sector, the yield is on the lower end, though others don’t offer anything all that more enticing.
The lower yield is offset in part by a strong track record of continuous growth. Since 2014, the company has consistently grown their payout at a compound rate of about 4%. And compared to Q4FY19, REG’s current dividend is currently 11% higher now than at that time. This compares favorably to the peer average, whose pay-outs on average are over 20% lower now than in 2019.
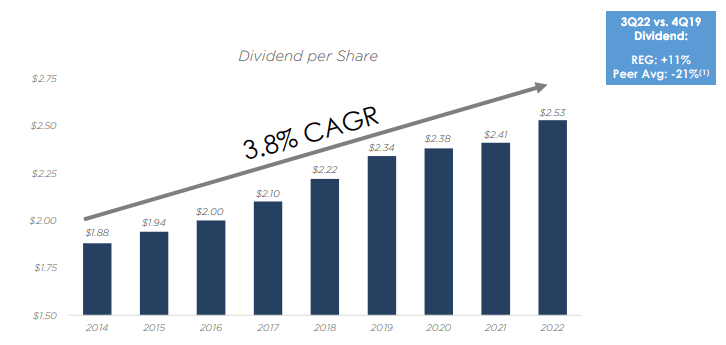
November 2022 Investor Presentation – Dividend Growth History Since 2014
Most recently, the dividend was increased 4% to its current level.
The continuity of the dividend is also at little risk of disruption. In 2023, for example, management is expecting core operating earnings of between $3.83-$3.89/share. At the low end of the range, the annual payout would still be below 70% of earnings, a payout level that remains below sector averages.
Final Thoughts
Similar to other shopping-center-focused REITs, REG turned in solid full year results in 2022 on the back of strong leasing activity and robust occupancy gains, particularly among their shop tenants.
In fact, 2022 was a record year for shop signings. This resulted in a leased rate that was up 200bps YOY and 70bps over 2019 levels. In addition, their tenant retention rate remained above historical averages at year end.
The strong portfolio metrics translated to 6.3% growth in same-property net operating income during the year.
Management, however, isn’t blind to the current macroeconomic backdrop. As such, an increase in tenant bankruptcies and early store closures is expected. While REG’s exposure to weaker tenants is limited, there will be some impacts from more publicized closures, such as Party City and Bed Bath & Beyond (BBBY). This, however, could result in a net-benefit to the company, as the mark-to-market is estimated to be in the range of 15%-20% on these properties. Nevertheless, the time lag of when new tenants ultimately physically occupy the space could create an earnings headwind in the near to medium term.
In addition, the company also has heightened exposure to Kroger (KR) and Albertsons (ACI). The two represent their second and third largest tenants by ABR, respectively. Together, they accounted for 5.1% of total ABR at year end. While the tenants are certainly top quality, the pending merger between the two will result in store closures. Though it is not known what stores will be closed, the element of uncertainty does warrant an additional risk premium.
At 16x forward FFO, shares are priced comparatively to Federal Realty (FRT) but trade at a sizeable premium to others within the sector. Kimco (KIM), Brixmor (BRX), and SITE Centers (SITC), for example, all trade at multiples below 14x.
And while there are organic opportunities for growth, such as in their pending commencements, their pipeline, which is approximately 3.5% of their ABR, is smaller than SITC’s pipeline, which measures in at 5% of total ABR.
For investors, a stock such as SITC offers better value, yet those shares are also best left on hold, given current market dynamics. Thus, a neutral position is likewise best for REG.
Be the first to comment