


NicolasMcComber
While it’s been a rough year for nearly all small-cap stocks, Red Robin (NASDAQ:RRGB) is one of the most significant underperformers, down 54% year-to-date and nearly 60% as of its September lows. This continued underperformance can be attributed to a difficult backdrop for the industry (pullback in demand, inflationary pressures) coupled with an outlook of continued net losses per share for the stock in FY2022 and FY2023 due to margin pressure. Based on this outlook of continued net losses per share, relatively low net unit growth, and weaker staffing levels than some peers, I would view rallies above $10.25 as profit-taking opportunities.
Red Robin Gourmet Burgers (Company Presentation)
Q2 Results
Red Robin released its Q2 results in mid-August, reporting quarterly revenue of $294.1 million, a 6% increase from the year-ago period. This was driven by comparable sales of 6.7% vs. last year’s levels (roughly in line with pricing) and a 4.1% increase from 2019 levels. The comp sales growth resulted from price increases and a favorable mix from well-received limited-time offers, offset by a 2.9% decline in guest counts in the period. While the latter certainly wasn’t ideal, Red Robin’s high-low approach to value allowed it to beat its peers on comp sales/traffic in Q2 as measured by Black Box Intelligence.
Red Robin’s high-low strategy involves higher-priced, innovative limited-time offers mixed with compelling promotions, allowing it to boost margins with LTOs and still appeal to less affluent consumers with promotions (less margin accretive). An example of the latter was the $10.00 Gourmet Meal Deal.

Red Robin – Quarterly Revenue (Company Filings, Author’s Chart)
While this short-term outperformance was positive, the company’s comp sales performance (4.1% vs. 2019) leaves much to be desired, with this being one of the weakest figures industry-wide, especially when we consider double-digit price increases in the three-year period. The one caveat is that this was a very difficult period for the industry, with consumers pulling back and several brands witnessing traffic declines. This should not be surprising given the challenging macro backdrop and sharply declining discretionary budgets related to higher gas, utility, mortgage, rent, and grocery prices. Fortunately, industry-wide traffic did improve in August (negative 1.9% vs. negative 5.1% in July) and may come in better than investors hoped in September due to the relief provided by the pullback in gas prices.

August Restaurant Traffic (Black Box Intelligence)
The issue is that although we might see a short-term boost in traffic (August, September) as gas prices have slid below $4.00/gallon from their peak above $5.00, the outlook for Q4 doesn’t appear as great. This is because the wealth effect has reversed sharply, and consumers have had some time to get used to this, with many coming to the realization that they’re a lot less rich than they thought, with housing prices teetering and investment/crypto accounts continuing to show massively red ink. So, while lower gas prices might have provided a much-needed win and added an extra visit, this was more of a psychological win than a needle-mover for most, with this offset by elevated grocery, utility prices, and higher mortgage/rent payments.
To summarize, it’s hard to be bullish on the restaurant industry as a whole when traffic is going in the wrong direction, and there doesn’t seem to be any immediate relief on the horizon. In fact, as personal savings rates are dwindling, most menu prices are increasing, with brands having to do something to offset double-digit commodity inflation and high single-digit wage inflation in FY2022. In Red Robin’s case, it pulled forward its planned menu price increase into Q3 (+2.0%). This is not a great setup, as higher menu prices clash with lower consumer confidence and weaker discretionary budgets. So, even if Red Robin’s high-low strategy might position it better, it could still be a tough Q4 for the company.
Costs & Earnings Trend
Digging into margins, the results were less than satisfactory, with restaurant-level operating profit coming in at 13.6%, down 460 basis points from Q2 2019 and 210 basis points year-over-year. This resulted from significant commodity inflation, with Red Robin’s cost of goods sold up 240 basis points, and its labor costs up 120 basis points. The silver lining is that industry commentary in Q2 suggests that we’ve seen peak inflation potentially, possibly helping some brands to claw back some lost margins. The problem for Red Robin is that it’s still not fully staffed, even if it is moving in the right direction (91% vs. 82% and a goal of 95%), and wage inflation could persist.
On the positive front, the company noted that it will add another 50 Donatos Pizzas to its restaurants this year, with the remaining 150 added in 2023. The company’s restaurant base with Donatos Pizza outperformed the system significantly by 8.4% vs. 2019, and guest checks are much higher at Red Robin locations that offer Donatos. So, as this full roll-out continues, we could see some margin improvement. That said, even with Donatos, Red Robin is a less iconic, low-unit growth, and relatively low-margin story that continues to report net losses per share, as we can see from the earnings trend below:
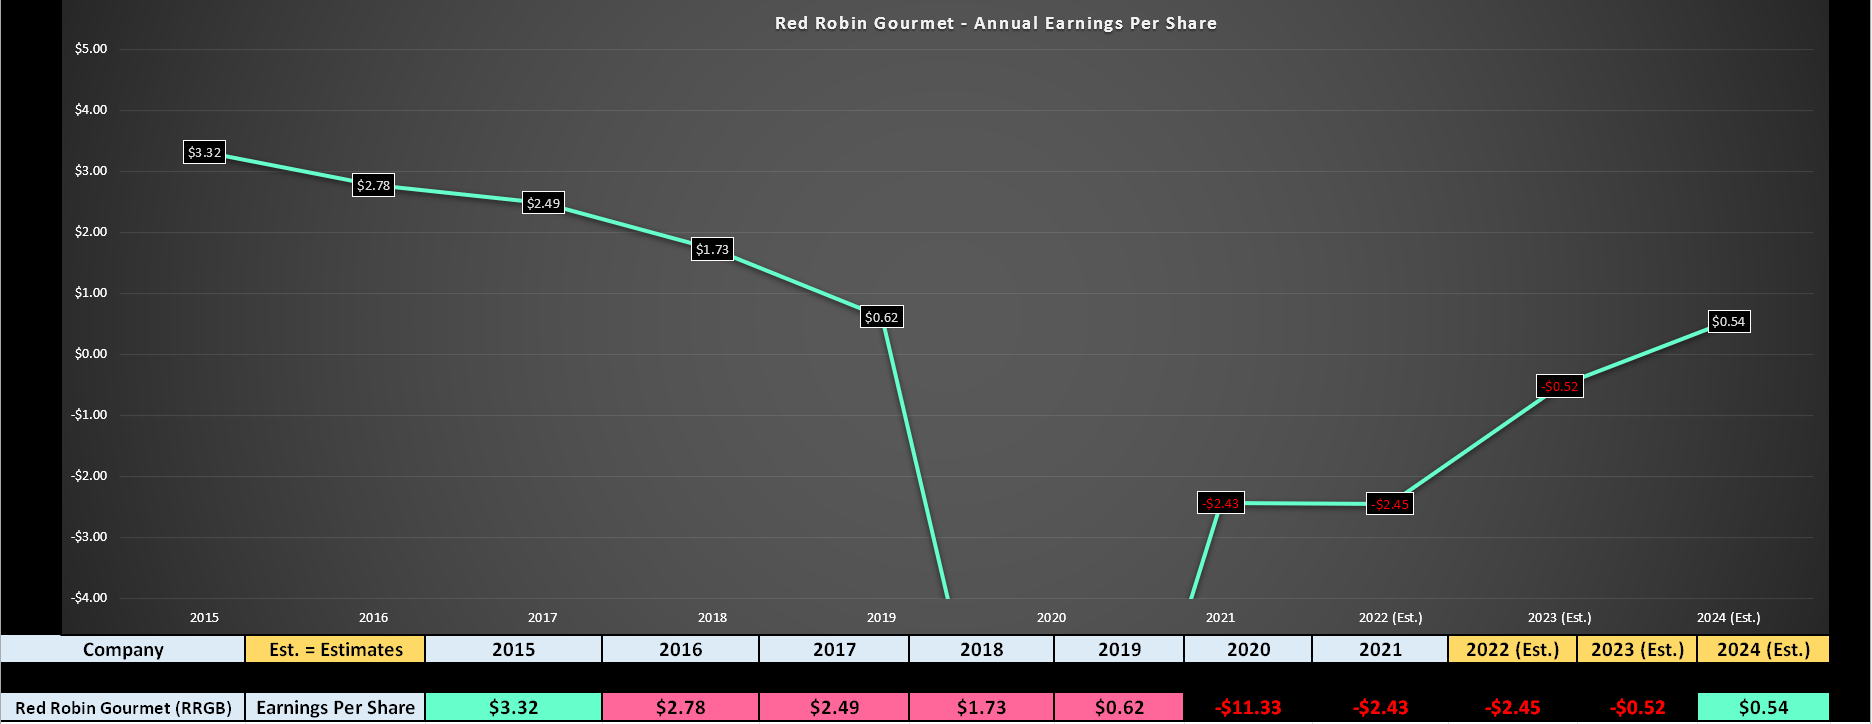
Red Robin Earnings Trend (Company Filings, Author’s Chart, FactSet)
As shown above, Red Robin’s earnings trend was already in decline pre-COVID-19, has worsened considerably since, and its earnings go less distance on a per share basis due to a higher share count than pre-COVID-19 levels resulting from its ATM offering. Based on current estimates, we should see continued net losses per share in FY2022 and FY2023 of $2.45 and $0.52, respectively, before the company returns to positive annual EPS in FY2024. While this trend change in earnings is positive if one uses a very low bar, the stock is hardly priced attractively as an industry laggard and turnaround story at ~14.3x FY2024 earnings estimates. Let’s take a look below:
Valuation
After a more than 80% decline from its 2017 highs, some might assume that Red Robin is cheap. While it’s certainly no longer heavily overvalued at 8.0x EV/EBITDA and ~14x FY2024 earnings estimates ($0.54), it’s hard to argue that the stock is cheap. This is because while it historically traded at ~21.9x earnings, this is a completely different environment for the restaurant industry and the stock market. For the industry itself, most brands will have a very challenging time returning to pre-COVID-19 margins, and for the market, we’ve seen considerable multiple compression due to the rapidly changing interest-rate environment.
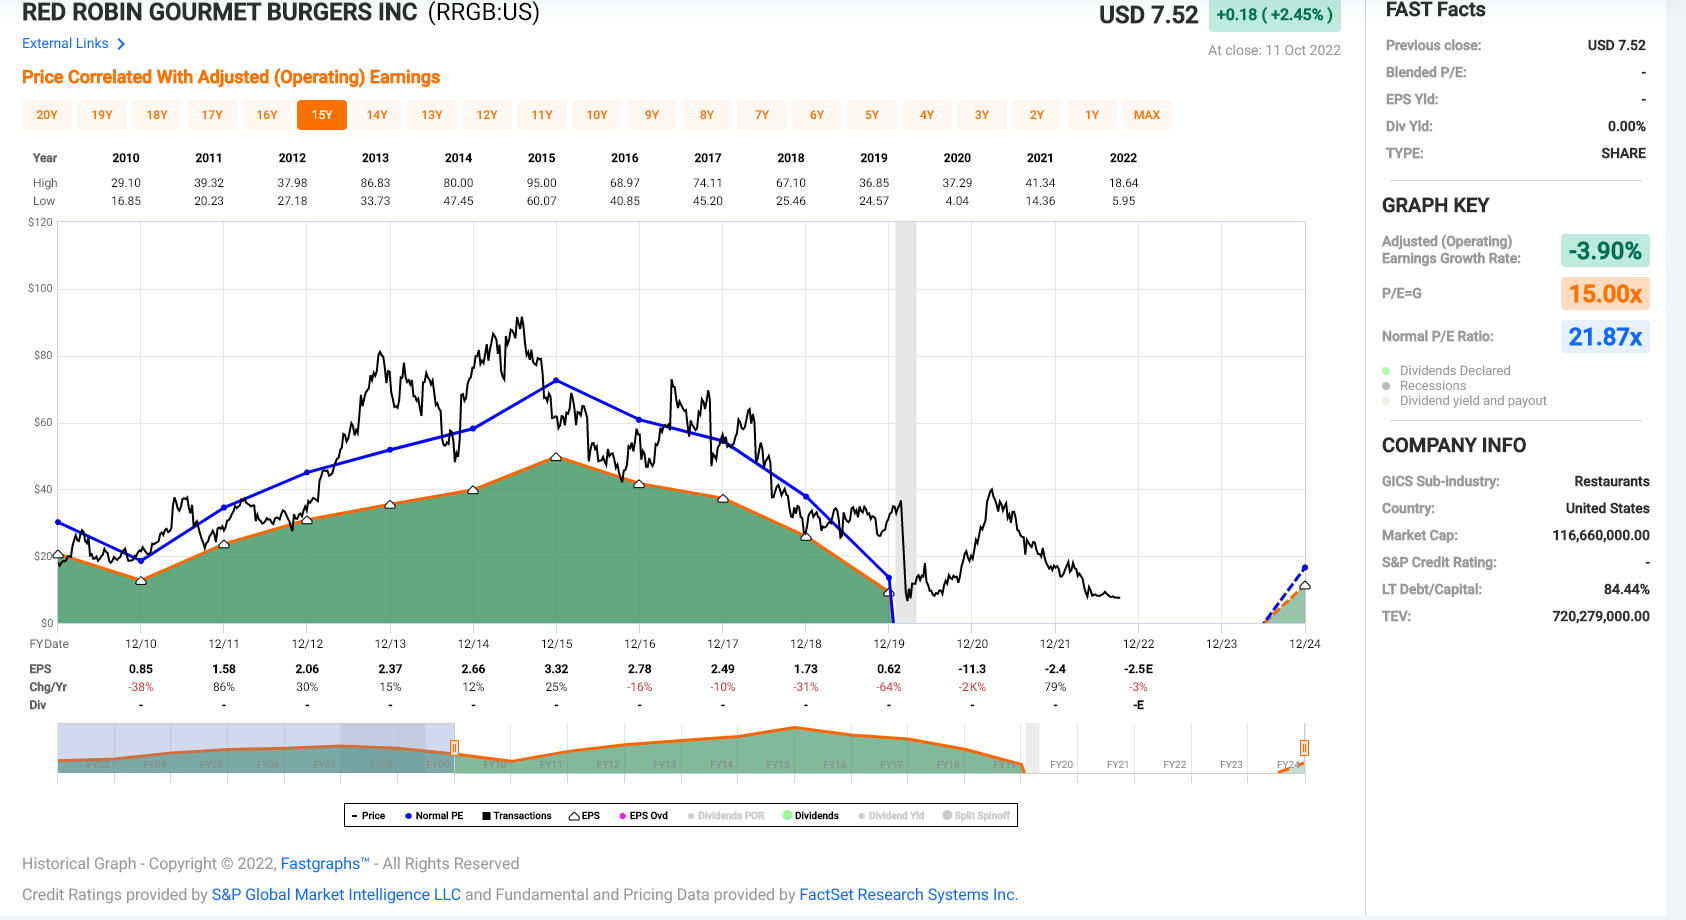
Red Robin – Historical Earnings Multiple (FASTGraphs.com)
Based on what I believe to be a more appropriate forward earnings multiple of 13.0 for Red Robin, given its weak balance sheet, low unit growth, and significant margin compression it has experienced, I see a fair value for the stock of $7.00 based on FY2024 earnings estimates. This more conservative price target doesn’t offer any upside from current levels, suggesting that even after this massive decline, the stock still isn’t undervalued. Obviously, if the company can turn things around significantly or sentiment improves for the overall market, more speculative names like Red Robin could see oversold rallies. That said, I don’t see the allure from a valuation standpoint.
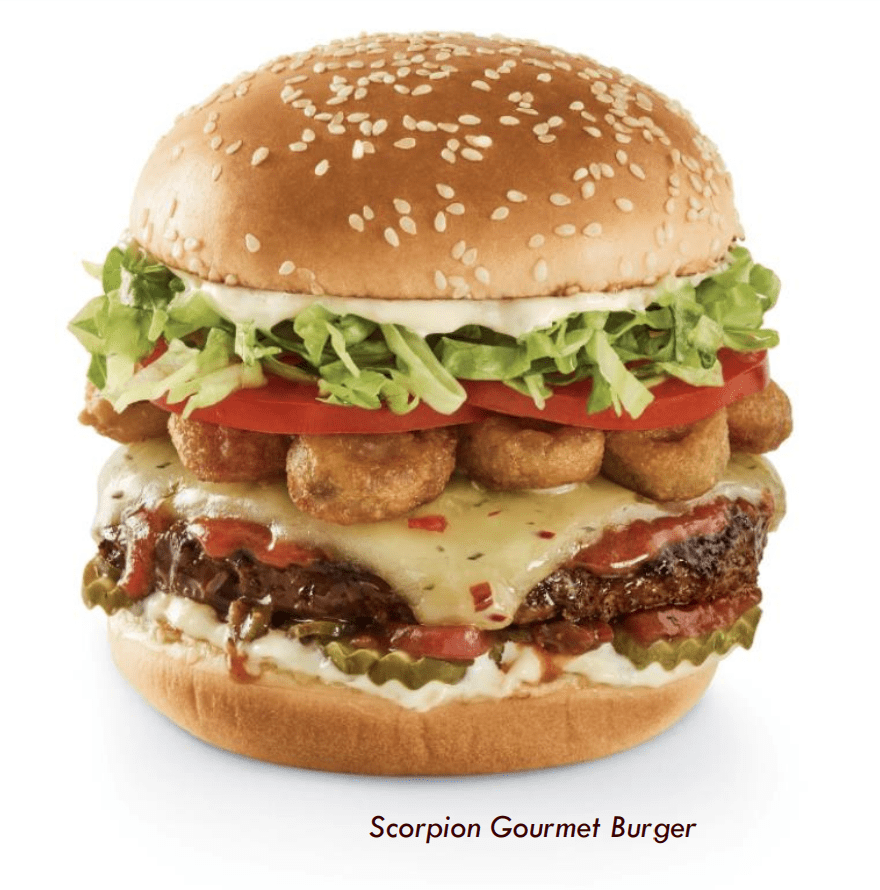
Red Robin – Scorpion Burger LTO (Company Presentation)
Technical Picture
Moving to the technical picture, Red Robin recently found strong support at $6.25, and this happens to be near a multi-year support level and its COVID-19 lows in March 2020. The underperformance vs. other brands is justified, given the inferior comp sales and margin performance vs. pre-COVID-19 levels and continued net losses per share (impacted by share dilution from At-The-Market Equity Program). However, with Red Robin now long-term oversold, the risk appears to be on the upside, especially if the S&P-500 can put together a relief rally in a period of strong seasonality (mid-October to Christmas). That said, if this does push RRGB higher, I would view rallies above $10.30 as an opportunity to take profits into strength.

RRGB 4-Month Chart (TC2000.com)
Summary
To summarize, with RRGB in the middle of its support/resistance range ($6.25 – $10.20), I don’t see the stock near a buy zone yet at $7.70. Instead, I think there are better buying opportunities elsewhere in the sector, such as Restaurant Brands International (QSR) below $52.00, where it trades at ~15.0x earnings with a 4.1% dividend yield, or First Watch (FWRG) below $13.70, a company that has done an incredible job bucking the industry-wide traffic trends. So, if RRGB does find a way to rally on the back of market strength to relieve some of its long-term oversold condition, I would expect sharp rallies to be an opportune time to exit the stock.
Be the first to comment