

Gold Price Talking Points
The price of gold extends the series of higher highs and lows from the monthly low ($1890) as the US Personal Consumption Expenditure (PCE) Price Index increases for the sixth consecutive month, and the precious metal may stage a larger recovery over the coming days as it appears to be reversing course after testing the 50-Day SMA ($1896).
Gold Price Forecast: Rebound Takes Shape Following Test of 50-Day SMA
The price of gold is on track to test last week’s high ($1966) as the recovery in risk appetite unravels, and waning hopes for a Russia-Ukraine peace deal may keep bullion afloat as global equity prices come under pressure.
As a result, a further shift in investor confidence is likely to spark increased volatility in the price of gold as the Federal Reserve plans to deliver a series of rate hikes over the coming months, and it remains to be seen if the update to the US Non-Farm Payrolls (NFP) report will influence the precious metal as evidence of heightening price pressures pushes market participants to hedge against inflation.
Nevertheless, a 490K rise in US employment may force the Federal Reserve to normalize monetary policy at a faster pace as the core PCE, the central bank’s preferred gauge for inflation, increases for the sixth consecutive month, and the Fed may adjust the exit strategy at its next interest rate decision on May 4 as the “Committee expects to begin reducing its holdings of Treasury securities and agency debt and agency mortgage-backed securities at a coming meeting.”
Until then, headlines surrounding the Russia-Ukraine war may largely influence the price of gold as the ongoing conflict raises the scope for a flight to safety, and bullion may continue to reflect a bullish trend as it appears to be reversing course after testing the 50-Day SMA ($1896).
With that said, a move above last week’s high ($1966) may push the price of gold back towards the yearly high ($2070), and the precious metal stage further attempts to test the record high ($2075) if the recovery in risk appetite continues to unravel.
Gold Price Daily Chart
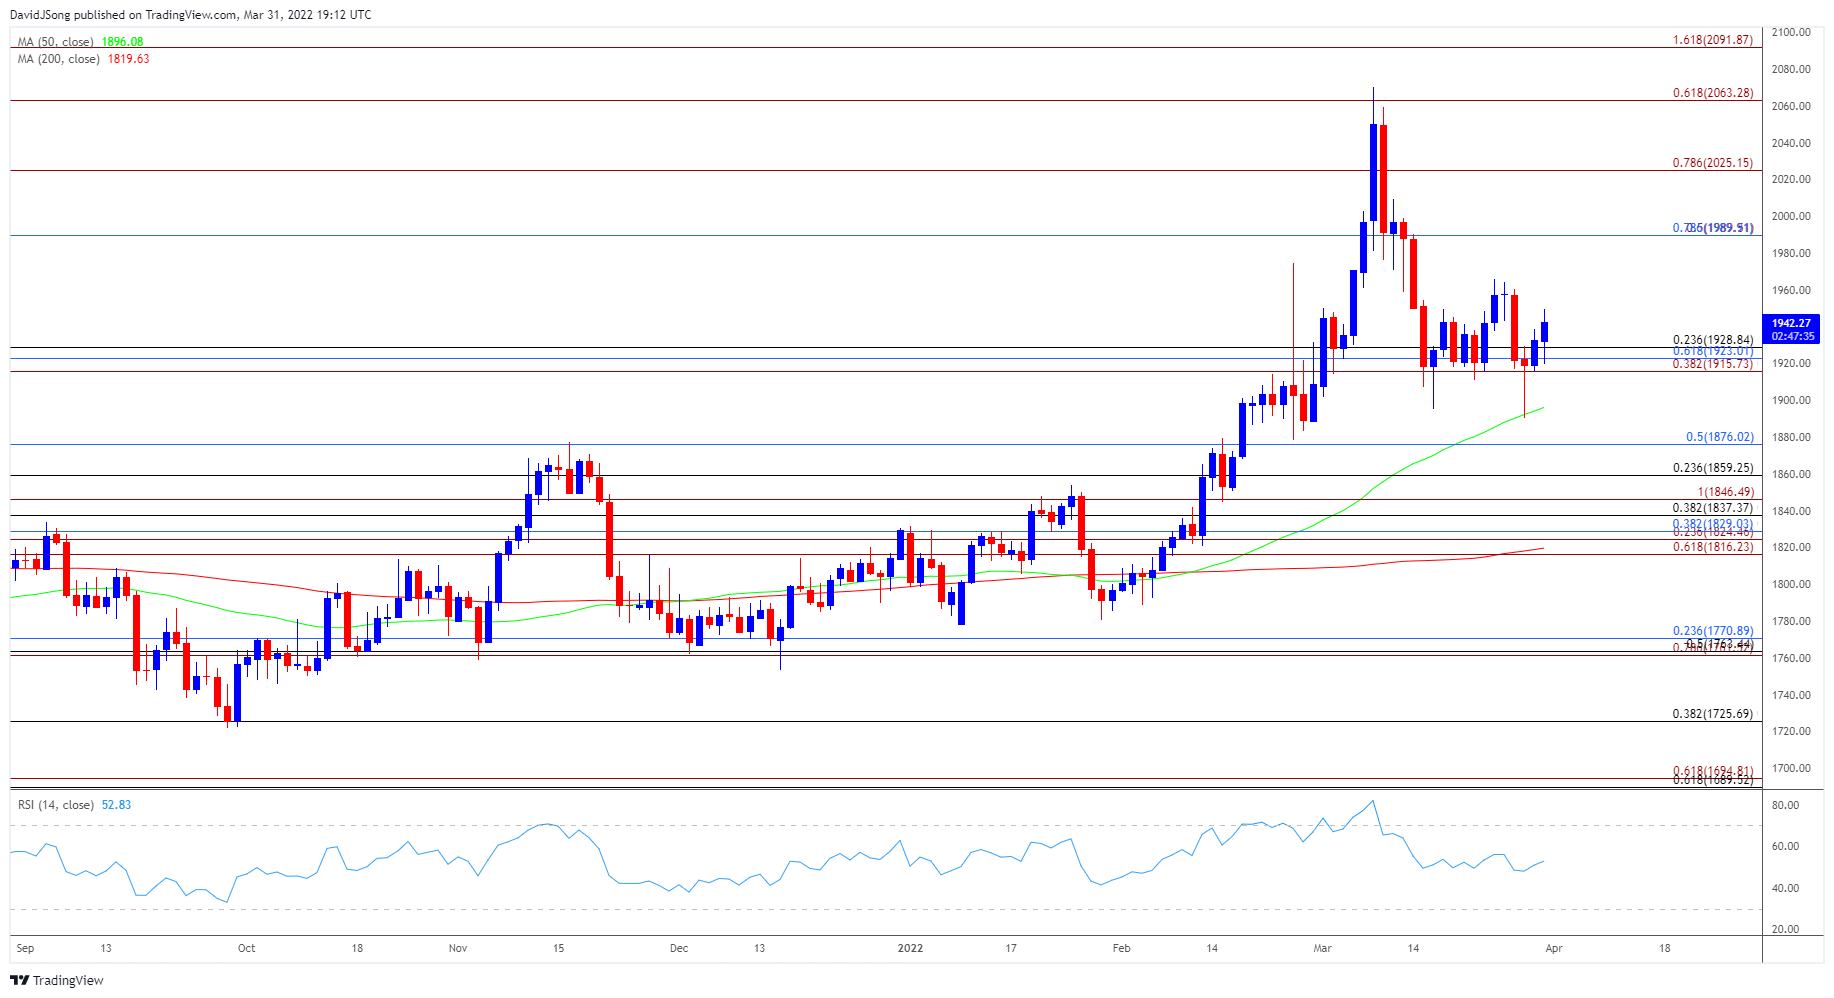
Source: Trading View
- The outlook for the price of gold remains constructive as the 50-Day SMA ($1896) retains the positive slope from earlier this year, and the decline from the yearly high ($2070) may turn out to be a correction in the broader trend as bullion appears to be reversing course after testing the moving average.
- The price of gold carves a series of higher highs and lows after failing to close below the Fibonacci overlap around $1916 (38.2% expansion) to $1929 (23.6% retracement), with a break above last week’s high ($1966) bringing the $1990 (78.6% retracement) area back on the radar.
- Next area of interest comes in around $2025 (78.6% expansion), with a move above the $2063 (61.8% expansion) region opening up the yearly high ($2070).
— Written by David Song, Currency Strategist
Follow me on Twitter at @DavidJSong
Be the first to comment