

nespix/iStock via Getty Images
The raw affordability of new homes held steady at record low levels in February 2022. While median household income increased, that increase kept pace with the ongoing escalation of new home prices.
The following chart confirms that assessment. We find median household income stayed at a record low of 17.8% of the median sale price of a new home in February 2022, effectively tying for the lowest level of affordability by this measure on record.
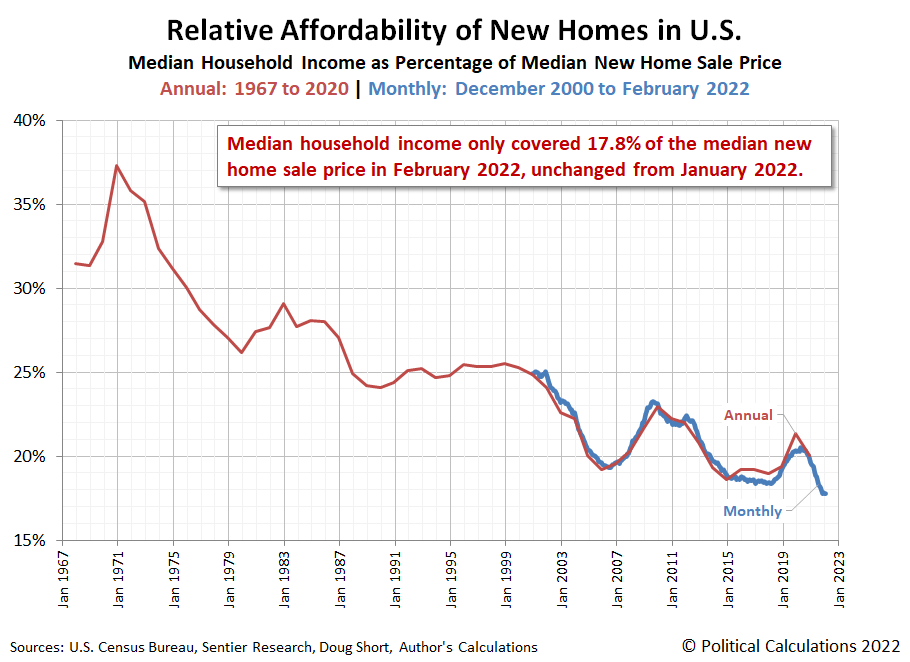
Extending out several more decimal places, January 2022 edges February 2022 for having the lowest-ever level of raw affordability for new homes in the U.S.
Taking the average 30-year conventional mortgage rate for February 2022 into account however, we find the mortgage payment for the median new home sold in February 2022 dipped slightly as a share of the typical income earned by an American household. Alas, not enough to break the uptrend that began after the Coronavirus Recession ended in April 2020. The next chart shows that outcome:
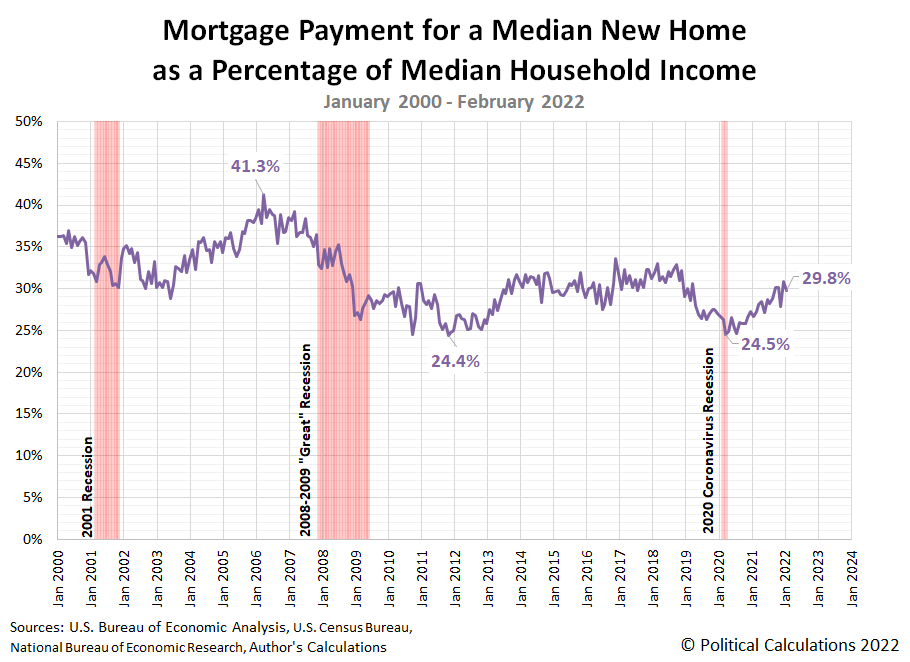
The average mortgage payment for a median new home sold in February 2022 represents 29.8% of the income for the median American household.
To close, we have a bonus chart for this month’s analysis, which visualizes the trailing twelve month averages for both median new home sale prices and median household income.
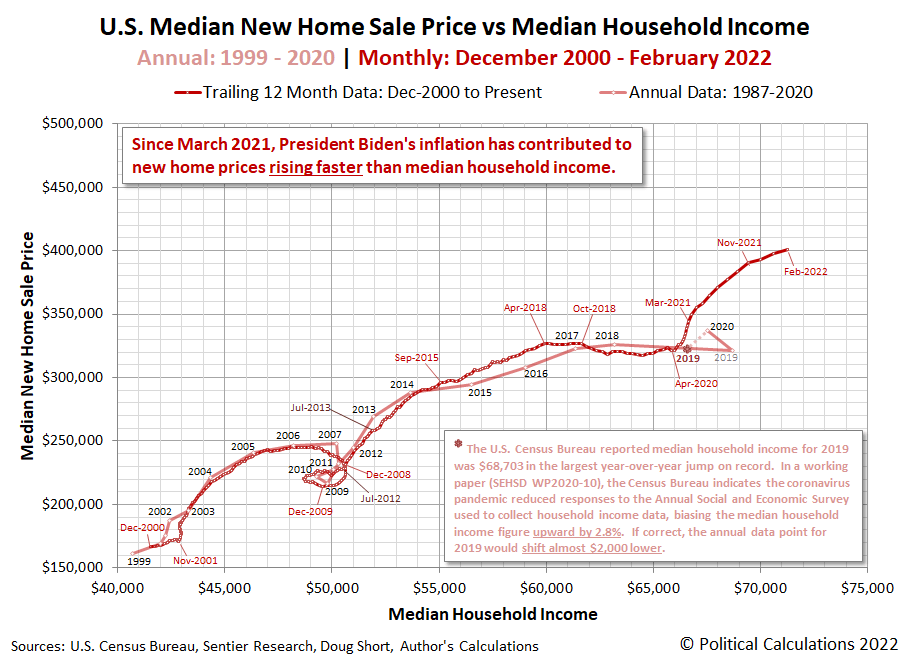
Notice how new home sale prices suddenly accelerated after March 2021, when President Biden’s American Rescue Plan stimulus checks started flooding into the U.S. economy? The median sale price of new homes has increased by $56,975, far outstripping the $4,611 increase in median household income. But that doesn’t consider the effect of the additional inflation that has eroded the purchasing power of the typical American household in the period since.
References
U.S. Census Bureau. New Residential Sales Historical Data. Houses Sold. [Excel Spreadsheet]. Accessed 25 February 2022.
U.S. Census Bureau. New Residential Sales Historical Data. Median and Average Sale Price of Houses Sold. [Excel Spreadsheet]. Accessed 23 March 2022.
Freddie Mac. 30-Year Fixed Rate Mortgages Since 1971. [Online Database]. Accessed 23 March 2022.
Editor’s Note: The summary bullets for this article were chosen by Seeking Alpha editors.
Be the first to comment