

RAND ANALYSIS
- South African unemployment rate reaches record highs.
- Spotlight on U.S. economic data Jackson Hole Symposium.
- USD/ZAR trading at key support – potential for bullish upside.
ZAR FUNDAMENTAL BACKDROP
Emerging Market (EM) currencies found their footing this week as the dollar faded. Although markets are expecting more details around QE tapering (which would theoretically support dollar strength), other factors such as a less hawkish stance from the Fed’s Kaplan (Dallas head), weaker than forecasted U.S. Manufacturing PMI data yesterday as well as the rebound in commodities all allowed for a ‘risk-on’ mood in financial markets this week.
The South African rand is no exception but sentiment could easily shift back to the greenback as the Jackson Hole Symposium approaches. Profit taking on the dollar was a likely contributor to USD outflows which again should not be taken as sustained dollar weakness.
Key economic data from the U.S. (durable goods orders and GDP growth) are in focus prior to the symposium later this week with South African unemployment rate coming in higher than previous (32.6%).
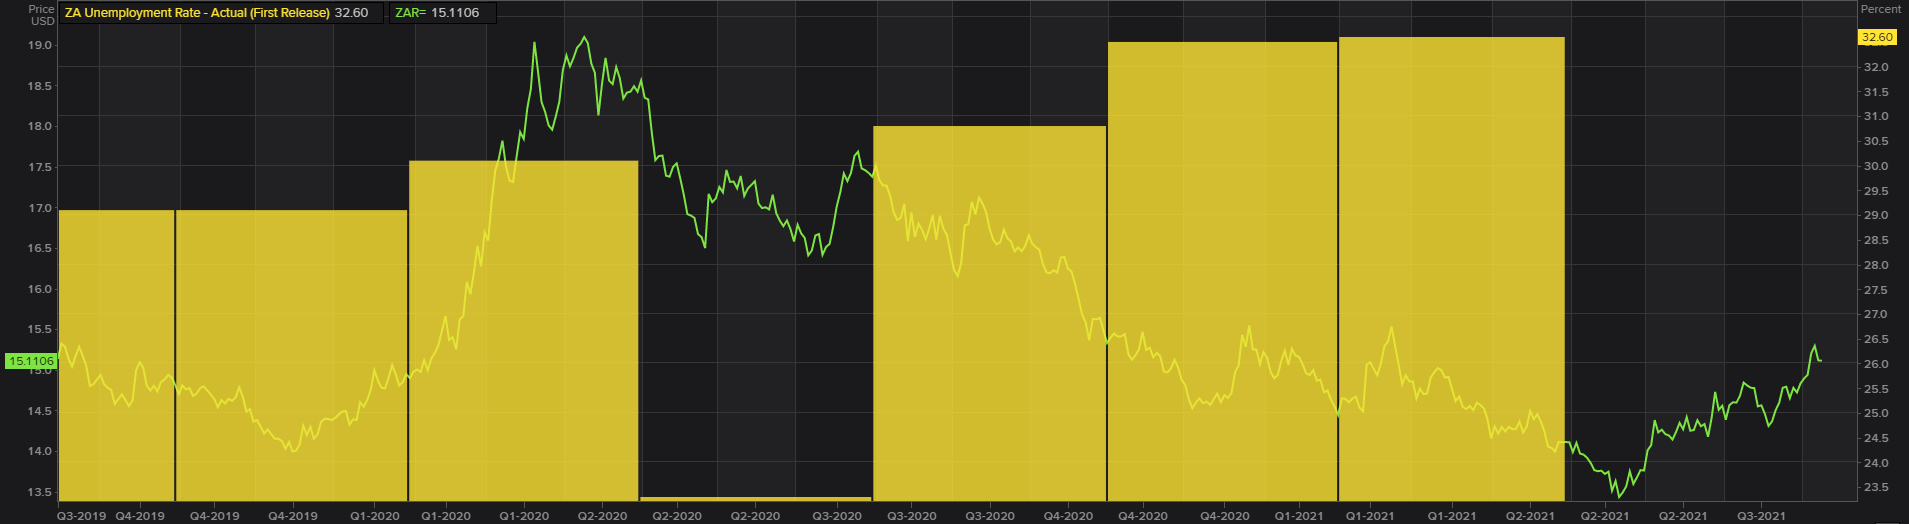
Since Q3 2020, the unemployment rate has been steadily rising alongside rand strength (see chart below) primarily due to dollar weakness – which could catch up with rand bulls as the dollar looks to rebound. The unemployment figure was highly anticipated by South Africans as the recent civil unrest in the provinces of Gauteng and KwaZulu Natal are to be included in the data.
South African unemployment rate vs USD/ZAR:
Source: Refinitiv
Actual Q2 data for 2021 increased to 34.4%, an expected rise which has yet to impact the USD/ZAR pair. This mornings pullback could have priced in this weaker print prior to release however, there is still room for further upside.
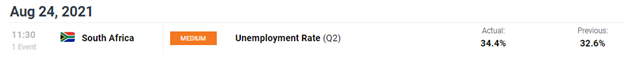
Source: DailyFX economic calendar
GET YOUR Q3 RAND FORECAST HERE!
TECHNICAL ANALYSIS
USD/ZAR DAILY CHART
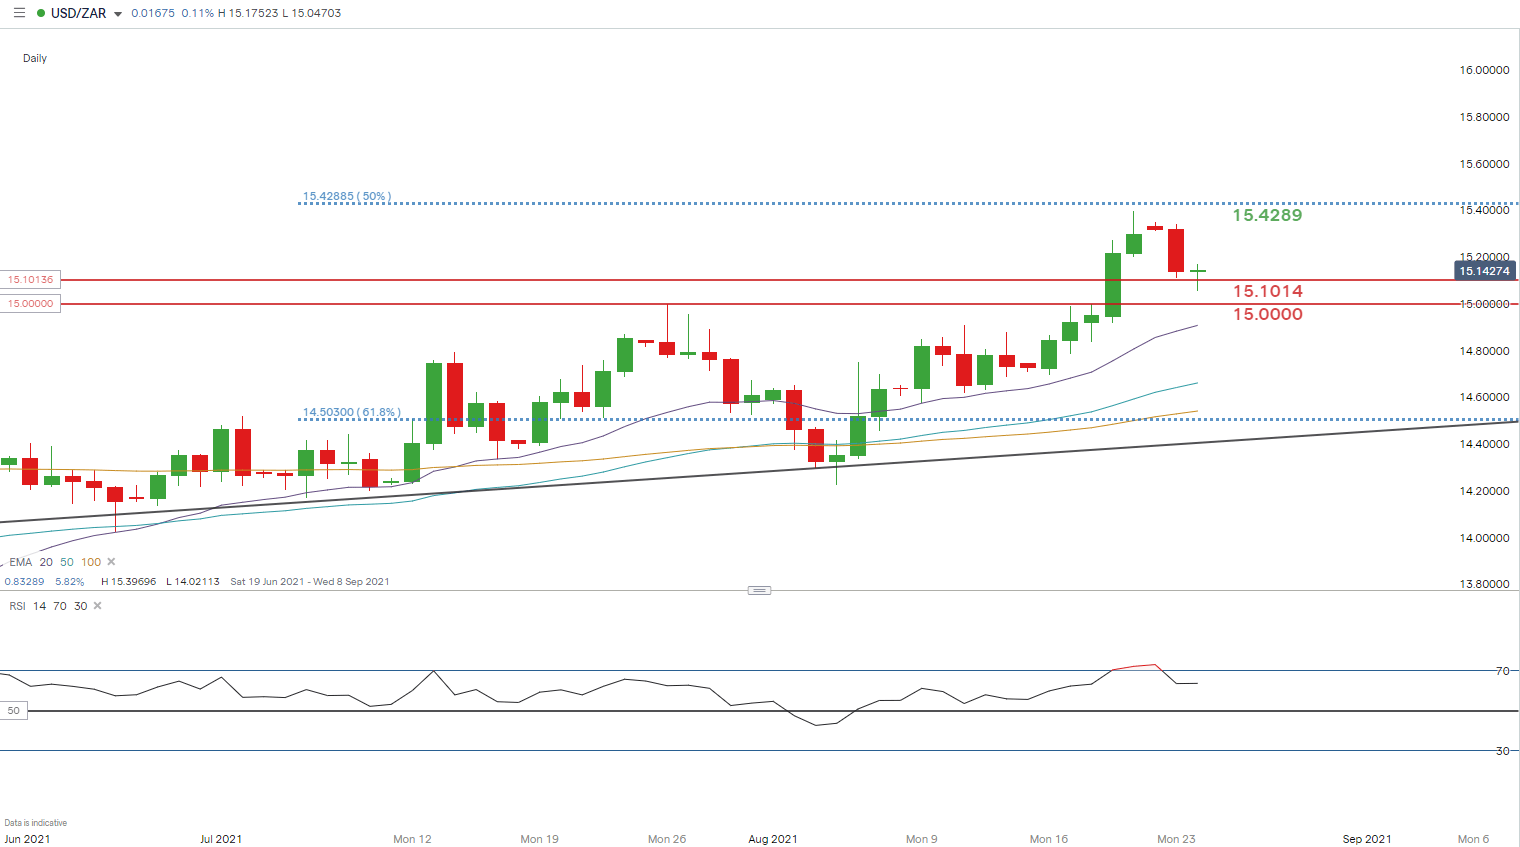
Chart prepared by Warren Venketas, IG
Price action on the daily USD/ZAR chart shows last week’s bull run towards the 50% Fibonacci level at 15.4289 (Fibonacci taken from February 2018 low to April 2020 high) last week. This week, ZAR bulls have clawed back some lost gains settling at the recent March swing high at 15.1014 (support level). This zone could provide a launchpad of sorts for a second push towards the 50% Fibonacci level depending on upcoming data and the outcome of the Jackson Hole Symposium.
The current daily candle displays a long wick formation (blue) which can indicate the potential for more bullish stimulus. The recent weak unemployment data may give bulls the backing to reach fresh daily highs – and may only reveal short-term as markets look to U.S. data in the days to come.
Resistance Levels:
Support Levels:
— Written by Warren Venketas for DailyFX.com
Contact and follow Warren on Twitter: @WVenketas
Be the first to comment