

Sundry Photography/iStock Editorial via Getty Images
Rakuten Group Inc. (OTCPK:RKUNY) is a leading Japanese telecommunications, retail e-commerce marketplace and mobile payment systems company. In this coverage, we analyzed the competitiveness of Rakuten’s e-commerce business relative to its main competitor, which is Amazon (AMZN), based on their market share, customer satisfaction as measured by online reviews, product breadth based on the number of product listings on their websites and fee structure to determine whether Rakuten derives an advantage.
Moreover, as the company implements its cross-selling strategy capitalizing on the Rakuten ecosystem of services, we compared its average revenue per user growth with competitors and forecasted its revenue growth based on ARPU and user growth.
Lastly, we analyzed the profitability of Rakuten’s mobile segment with its extensive expansion of 4G base stations and projected its segment profitability.
Amazon Expected to Maintain Competitive Lead
Rakuten is the second-largest online marketplace in Japan based on online website visits, only trailing behind Amazon. Though, Rakuten had been growing faster than Amazon between 2019 and 2021 (11.2% vs. 6.3%). However, it faces competition from other marketplaces such as Mercari (OTCPK:MCARY), ZOZOTOWN (OTCPK:SATLF) and Qoo10 Japan. As seen in the table below, only Qoo10 Japan had a higher growth rate (27.4%) than Rakuten, but it also had considerably lower monthly visits than Rakuten.
|
Online Marketplaces Monthly Visits in Japan (‘mln’) |
2019 |
2021 |
Growth % |
|
Amazon |
523 |
555.8 |
6.3% |
|
Rakuten |
489.5 |
544.3 |
11.2% |
|
Mercari |
70.3 |
75.2 |
7.0% |
|
ZOZOTOWN |
47 |
43 |
-8.5% |
|
Qoo10 Japan |
11.3 |
14.4 |
27.4% |
Source: Disfold, Webtailer, Khaveen Investments
Besides that, we compared its customer reviews with the other two leading retail e-commerce marketplaces in Japan which are Amazon and Mercari to compare their customer satisfaction. Rakuten had better reviews than the others. Based on the reviews, the satisfaction with Rakuten’s cashback system and the inclusion of sellers’ daily offers on the platform for customers’ convenience was highlighted.
|
Company |
Customer Ratings (Out of 5 Stars) |
|
Amazon |
3.2 |
|
Rakuten |
4.2 |
|
Mercari |
3.7 |
Source: Trustpilot, Khaveen Investments
According to Rakuten, it had taken initiatives to ensure the products’ quality listed on the marketplace by imposing additional requirements for the merchants. We believe this could lower the risk of fake and counterfeit products on Rakuten’s marketplace and enhance users’ shopping experience. However, we believe Amazon Japan has more flexible merchant onboarding requirements.
Additionally, we then compared the number of product listings based on selected products listed on Rakuten and Amazon Japan websites to determine which has an advantage in product variety. By taking the number of products stated on Rakuten’s website and calculating the number of products per page multiplied by the total page numbers of products for Amazon, we determined that Amazon has a significantly higher number of product listings which could be a disadvantage for Rakuten.
|
Product Listings Comparison |
Rakuten |
Amazon |
|
Rice cookers |
1,537 |
16,000 |
|
Men’s watches |
543,960 |
960,000 |
|
Women’s watches |
408,745 |
480,000 |
|
Monitors |
22,624 |
240,000 |
|
Keyboards |
26,164 |
480,000 |
|
Mouse |
46,753 |
240,000 |
Source: Rakuten, Amazon, Khaveen Investments
Furthermore, in contrast to the lower account fees and elimination of transaction, maintenance, and registration fees for the merchants by Amazon Japan, we believe Rakuten could be at a disadvantage as it charges more fees to its sellers as seen in the table below. However, Amazon includes higher referral fees than Rakuten.
|
Item |
Amazon Pro Seller Japan |
Rakuten Ichiba Seller |
|
Referral Fees |
8% – 15% |
2% – 7% |
|
Account Fees/month |
$39.99 |
$205 – $980 |
|
Transaction Fee |
0.00% |
2.50% – 3.50% |
|
Maintenance fee/month |
0.00% |
1.10% |
|
Registration Fees – One-off |
$0.00 |
$570 |
Source: Easy2Digital
Overall, we believe is well-positioned to benefit from the growth of e-commerce with its leading position only behind Amazon and high customer satisfaction. Though, we expect Amazon to pose a strong competitive threat with its superior product breadth and attractive fees for sellers. To project its growth, we expect Rakuten’s member growth to continue growing with a 5-year average growth assumption (7.47%) through 2026.
|
Rakuten Members Projection |
2018 |
2019 |
2020 |
2021 |
2022F |
2023F |
2024F |
2025F |
2026F |
|
Members (‘mln’) |
103 |
111 |
120 |
125.4 |
134.8 |
144.8 |
155.7 |
167.3 |
179.8 |
|
Growth % |
7.77% |
8.58% |
7.54% |
4.67% |
7.47% |
7.47% |
7.47% |
7.47% |
7.47% |
Source: Rakuten, Khaveen Investments
Increasing ARPU from Cross-selling Strategy
Rakuten members have been increasing at a 7-year average growth of 8.64% from 2014 to 2021. However, the growth has been decelerating from 11.04% in 2016 to 4.67% in 2021. On the bright side, its ARPU has shown accelerating growth from -0.77% in 2015 to 44.5% in 2021.
Compared to its main competitors in Japan including Amazon and Mercari, Rakuten had a higher 5-year average ARPU growth of 6.13% compared to Amazon’s -10.5% but lower than Mercari’s 15.58%. While Amazon had higher subscriber growth, its ARPU had decreased compared to Rakuten which increased. While Rakuten’s ARPU growth is lower than Mercari’s, its member base was much larger than Mercari’s. We believe its ARPU growth could be reflected in its advantage of customer loyalty by its cross-selling strategy within the ecosystem. Rakuten Ichiba has a variety of product offerings including fashion, home products, technology products and vehicles.
|
ARPU Comparison |
2016 |
2017 |
2018 |
2019 |
2020 |
2021F |
|
Rakuten Members (‘mln’) |
88 |
95 |
103 |
111 |
120 |
125.4 |
|
Growth % |
11.04% |
8.80% |
7.77% |
8.58% |
7.54% |
4.67% |
|
Rakuten Internet Services Revenue ($ mln) |
4,801 |
6,040 |
7,186 |
7,292 |
7,946 |
9,135 |
|
Growth % |
30.94% |
25.80% |
18.97% |
1.48% |
8.97% |
14.96% |
|
Rakuten ARPU ($) |
54.87 |
63.44 |
70.04 |
65.46 |
66.33 |
72.85 |
|
Growth % |
17.92% |
15.62% |
10.39% |
-6.53% |
1.33% |
9.83% |
|
Amazon Prime Subscribers (‘mln’) |
66 |
100 |
120 |
150 |
200 |
269 |
|
Growth % |
51.52% |
20.00% |
25.00% |
33.33% |
34.67% |
|
|
Amazon Japan Revenue ($ mln) |
10,800 |
11,910 |
13,830 |
16,000 |
20,460 |
23,070 |
|
Growth % |
10.28% |
16.12% |
15.69% |
27.88% |
12.8% |
|
|
Amazon ARPU |
235 |
180 |
138 |
133 |
136 |
86 |
|
Growth % |
-23.14% |
-23.36% |
-3.59% |
2.30% |
-10.50% |
|
|
Mercari Users (‘mln’) |
5.2 |
8.4 |
10.7 |
13.6 |
17.5 |
19.5 |
|
Growth % |
61.54% |
27.38% |
27.10% |
28.68% |
11.43% |
|
|
Mercari Revenue ($ mln) |
119.3 |
202.85 |
328.72 |
475.02 |
701.04 |
955.3 |
|
Growth % |
70.03% |
62.05% |
44.51% |
47.58% |
35.23% |
|
|
Mercari ARPU |
22.94 |
24.15 |
30.72 |
34.93 |
40.06 |
48.99 |
|
Growth % |
5.26% |
27.22% |
13.69% |
14.69% |
15.58% |
Source: Statista (Amazon), Statista (Mercari), Amazon, Mercari, Khaveen Investments
Based on Rakuten’s media webpage, the company first introduced its ecosystem efforts in July 2017. This coincides with Rakuten’s ARPU growth starting to turn positive in the following year after 3 years of negative growth. Rakuten has mentioned that the company has been leveraging on cross-selling strategy by “promoting cross-use between services and increasing customer retention, as well as minimizing risks through the diversification of businesses and maximizing the added value of synergy generated between businesses.”
As of Q4 2021, 74.7% of Rakuten users were using more than 1 service in its portfolio from 64.9% in 2017.
Moving forward, we projected its members and ARPU growth based on its 5-year average growth rate. We believe this can be achieved through the multi-purpose use of its loyalty program across its ecosystem of e-commerce, mobile payments, and banking that could increase the amount they spend across different platforms and thus potentially boost Rakuten’s ARPU growth.
|
Internet Services Revenue Projection |
2020 |
2021 |
2022F |
2023F |
2024F |
2025F |
2026F |
|
Members (‘mln’) (‘a’) |
120 |
125 |
135 |
145 |
156 |
167 |
180 |
|
Growth % |
7.54% |
4.67% |
7.47% |
7.47% |
7.47% |
7.47% |
7.47% |
|
ARPU ($) (‘b’) |
66.33 |
72.85 |
77.31 |
82.05 |
87.08 |
92.41 |
98.08 |
|
Growth % |
1.33% |
9.83% |
6.13% |
6.13% |
6.13% |
6.13% |
6.13% |
|
Internet Services Revenue ($ mln) (‘c’) |
7,946 |
9,135 |
10,420 |
11,884 |
13,555 |
15,461 |
17,634 |
|
Growth % |
8.97% |
14.96% |
14.06% |
14.06% |
14.06% |
14.06% |
14.06% |
*c = a x b
Source: Rakuten, Khaveen Investments
Mobile Segment Expected to Still Be Unprofitable in The Future
Since 2018, Rakuten has ventured into its mobile segment, providing telecommunication services in Japan. However, with the extensive costs of launching the services, Rakuten’s mobile segment has been unprofitable until 2021. In order to deploy its mobile infrastructure, Rakuten acquired Altiostar, a US mobile technology company, at over $1 bln which could support Rakuten by providing software to streamline the mobile network processes and automate operations.
Previously in 2021, Rakuten’s CEO Hiroshi Mikitani has mentioned that the mobile segment is expected to turn losses into profit by 2023 by growing its subscriber base. However, the company has been facing a shortage of nationwide service for its 4G network and initiated to increase in the 4G base stations in Japan for better coverage. Compared to its competitors, KDDI has 10,000 5G base stations and NTT DoCoMo (OTCPK:DCMYY) with 7,100 5G base stations. Rakuten had only 1,000 5G base stations as of Q2 2021 and the unfinished 4G base stations could hinder the 5G coverage of Rakuten to Japan’s users in the future.
While Rakuten introduced a one-year free campaign in 2020 followed by 3 months free campaign in 2021 to increase its subscriber base, we are cautiously optimistic about its growth going forward following the end of the promotion period. We expect Rakuten’s mobile segment users to decelerate through 2023 with intense competition from local competitors.
|
Rakuten Mobile Segment Users |
2020 |
2021 |
2022F |
2023F |
|
Mobile users (‘mln’) |
3.45 |
5.5 |
6.7 |
7.5 |
|
Growth % |
59.42% |
21.54% |
12.54% |
Source: Rakuten, Khaveen Investments
Rakuten provided a 1-year free-of-charge mobile carrier subscription until March 2021 when the 3-month free subscription was implemented subsequently. At the same time, its operating margin continued to decline in 2021. We expect the company to remain unprofitable in the foreseeable future as it continues to grow its subscriber base as well as expands its network across the country.
|
Rakuten Mobile Segment |
2019 |
2020 |
2021 |
2022F |
|
Mobile Revenue |
1,102.40 |
2,200.80 |
2,102.40 |
2,628.00 |
|
Mobile Operating Profit |
-552.6 |
-2,199.20 |
-3,628.13 |
-3,102.53 |
|
Mobile Operating Margin % |
-50.1% |
-99.9% |
-148.1% |
-148.1% |
Source: Rakuten, Khaveen Investments
Based on the unprofitability of the mobile segment due to the intensive costs of building 4G and 5G base stations, as well as the lower subscriber growth, we do not expect the mobile segment to generate profits by 2023. However, according to its Mobile segment President from its latest earnings briefing, the company expects to break even in 2023.
Rakuten Mobile is translating 4G and 5G networks and expanding attractive services to all customer groups. By continuing to grow our subscriber base, we aim to achieve breakeven in fiscal year 2023.” – Yoshihisa Yamada, President, Rakuten Mobile
Risk: Rising Debt
According to underwriter Daiwa Securities Group Inc (OTCPK:DSECF), Rakuten is “scheduled to price about 200 billion yen ($1.75 billion) of multi-tenor bonds”. As of 2021, its cash to debt ratio stood at 0.29x. We factored in $1.75 bln multi-tenor bonds in 2022 in our forecast and see its cash balances deteriorating weighed down by losses from its Mobile segment. Overall, we expect its cash to debt ratio to fall to 0.21x by 2024.
Rakuten, Khaveen Investments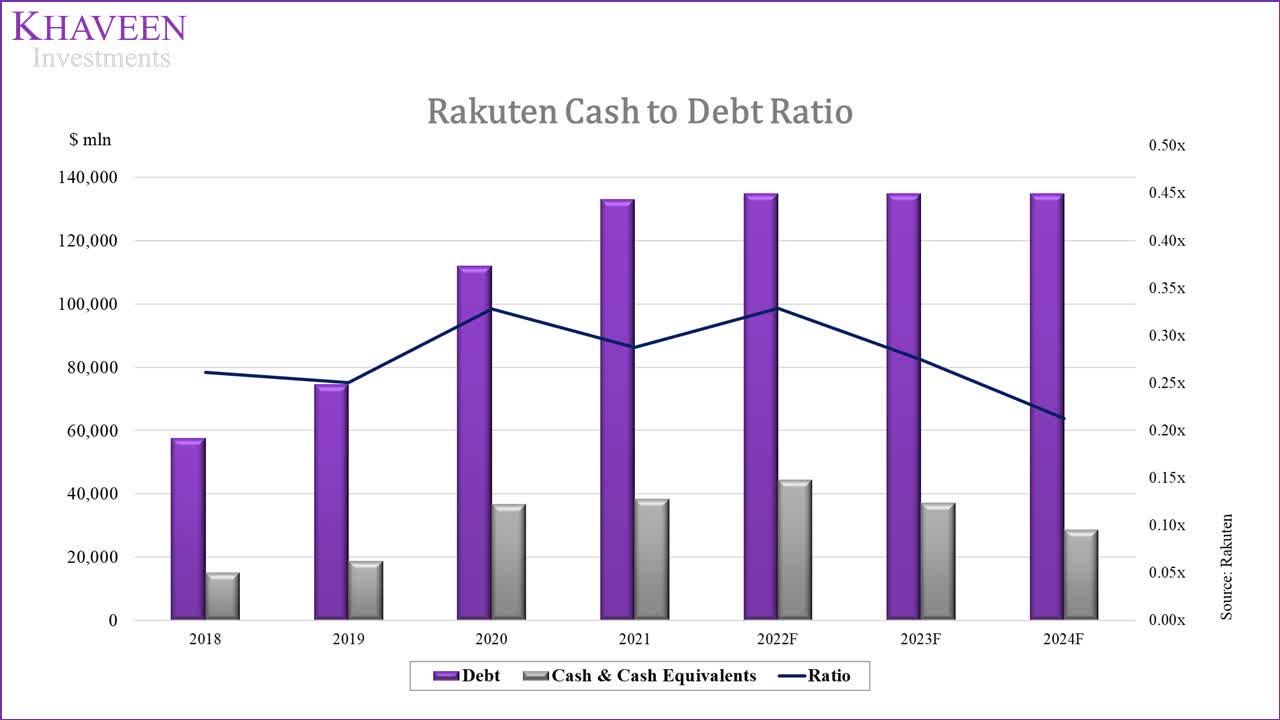
The $1.75 bln multi-tenor bonds consist of just a small portion of Rakuten’s total debt of $136 bln in 2021. While the amount is not very significant, we believe Rakuten’s cash to debt ratio remains low at 0.28x; the company could face a risk of not having sufficient liquidity to pay back its debt obligations.
Valuation
Due to the various segments of Rakuten in different industries, we used a sum of the parts valuation. For the Internet Services segment, we used a P/S Valuation as we forecasted it to grow robustly through 2024.
|
Internet Services Revenue Projection ($ mln) |
2020 |
2021 |
2022F |
2023F |
2024F |
|
Internet Services Revenue |
7,946 |
9,135 |
10,420 |
11,884 |
13,555 |
|
Growth % |
8.97% |
14.96% |
14.06% |
14.06% |
14.06% |
Source: Rakuten, Khaveen Investments
For the Fintech segment, we calculated its segment equity value by firstly determining its portion of banking assets and liabilities based on its 2020 financial report. Then, we adjusted the Banking Assets in 2020 to USD mln using the annual average rate of 1 USD = 106.754 JPY.
|
Banking Assets (JPY / USD mln) |
JPY (‘mln’) |
Weightage |
Adjusted JPY (‘mln’) |
Adjusted USD (‘mln’) |
|
Financial assets for securities business |
2,673,229 |
100% |
2,673,229 |
25,041 |
|
Loans for credit card business |
2,003,013 |
100% |
2,003,013 |
18,763 |
|
Investment securities for banking business |
266,227 |
100% |
266,227 |
2,494 |
|
Loans for banking business |
1,436,513 |
100% |
1,436,513 |
13,456 |
|
Investment securities for insurance business |
283,969 |
100% |
283,969 |
2,660 |
|
Total Banking Assets |
6,662,951 |
6,662,951 |
62,414 |
|
|
Remaining Assets |
1,912,185 |
35.49% |
678,674 |
6,357 |
|
Total assets excluding Cash, AR and Net PPE |
8,575,136 |
7,341,625 |
68,772 |
Source: Rakuten, Khaveen Investments
|
Banking Liabilities (JPY / USD mln) |
JPY (‘mln’) |
Weightage |
Adjusted JPY (‘mln’) |
Adjusted USD (‘mln’) |
|
Deposits of banking Business |
4,716,162 |
100% |
4,716,162 |
44,178 |
|
Financial liabilities for securities business |
2,587,227 |
100% |
2,587,227 |
24,235 |
|
Total Banking Liabilities |
7,303,389 |
7,303,389 |
68,413 |
|
|
Remaining Liabilities |
4,153,895 |
35.49% |
1,474,329 |
13,811 |
|
Total liabilities excluding AP, NCL |
11,457,284 |
8,777,718 |
82,224 |
Source: Rakuten, Khaveen Investments
Next, we assumed the increase in cash by deducting Banking Assets by Banking Liabilities.
|
Cash Growth in Banking |
2019 |
2020 |
Growth (JPY mln) |
Growth (USD mln) |
|
Banking Liabilities |
5,021,393 |
7,303,389 |
2,281,996 |
21,376 |
|
Banking Assets |
5,414,129 |
6,662,951 |
1,248,822 |
11,698 |
|
Increase / (Decrease) in Cash |
1,033,174 |
9,678 |
Source: Rakuten, Khaveen Investments
By assuming the assets and liabilities besides banking were distributed according to Rakuten’s revenue segment breakdown, which Fintech was 35.49% of the total revenue in 2020 excluding internal transactions, we have calculated the Fintech segment’s equity value to be $4,464 mln.
|
Rakuten Fintech Equity Value (2020) |
JPY mln |
Weightage |
Adjusted 2020 (USD mln) |
|
Cash & Equivalents |
1,988,132 |
35.49% |
6,609.86 |
|
Increase in Cash |
1,033,174 |
100.00% |
9,678.08 |
|
Accounts Receivable |
243,886 |
35.49% |
810.84 |
|
Net Property, Plant & Equipment |
684,110 |
35.49% |
2,274.47 |
|
Other Assets |
7,341,637 |
100% |
68,771.54 |
|
Fintech Asset |
88,144.92 |
||
|
Accounts Payable |
337,427 |
35.49% |
1,121.85 |
|
Non-Current Liabilities |
100,713 |
35.49% |
334.84 |
|
Other liabilities |
8,777,718 |
100% |
82,223.79 |
|
Fintech Liability |
83,680.48 |
||
|
Fintech Equity |
4,464.45 |
Source: Rakuten, Khaveen Investments
After we calculated the Fintech equity value for 2020, we projected the equity value for 2021 based on its growth rate (0.95%). For 2022, we projected it based on its 5-year average revenue growth.
|
Rakuten Fintech Equity Value Projections ($ mln) |
2020 |
2021F |
2022F |
|
Fintech Equity |
4,464.45 |
4,507.02 |
5,304.34 |
|
Growth % |
0.95% |
17.69% |
Source: Rakuten, Khaveen Investments
For the Mobile segment, we used P/B valuation instead due to its unprofitability. To calculate the Mobile segment’s assets, we used the average 4G LTE and 5G base station cost with the number of base stations planned. Assuming the debt to asset ratio remains at 0.91x based on its 2021 ratio, we calculated the equity value of the mobile segment in 2022.
|
Rakuten Mobile Segment Asset ($ mln) |
|
|
Average 4G LTE base stations cost (‘a’) |
0.1375 |
|
Number of 4G base stations planned (Quantity) (‘b’) |
44,000 |
|
Average 5G base stations cost (‘c’) |
0.057 |
|
Number of 5G base stations planned (Quantity) (‘d’) |
1,000 |
|
Mobile Segment Asset (‘e’) |
6,107 |
|
Debt / Asset Ratio |
0.91x |
|
Liability |
5,559 |
|
Equity |
548 |
*e = (a x b) + (c x d)
Source: IEEE, GizChina, Khaveen Investments
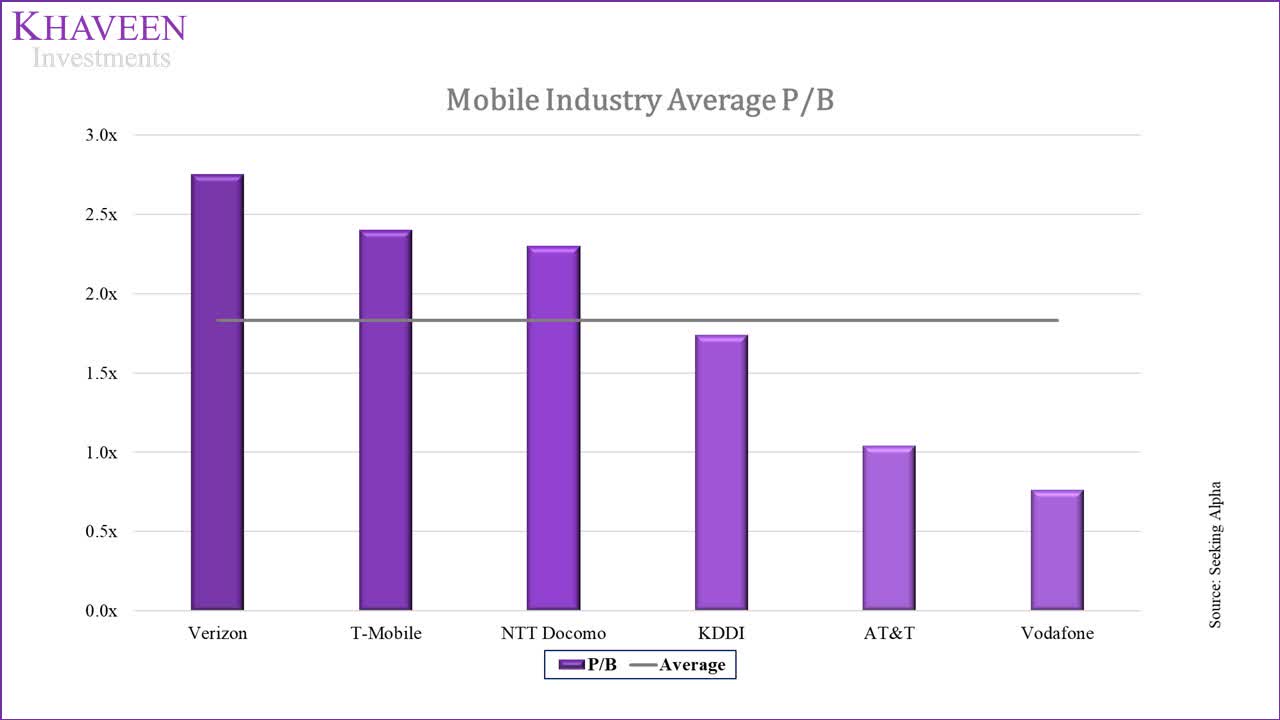
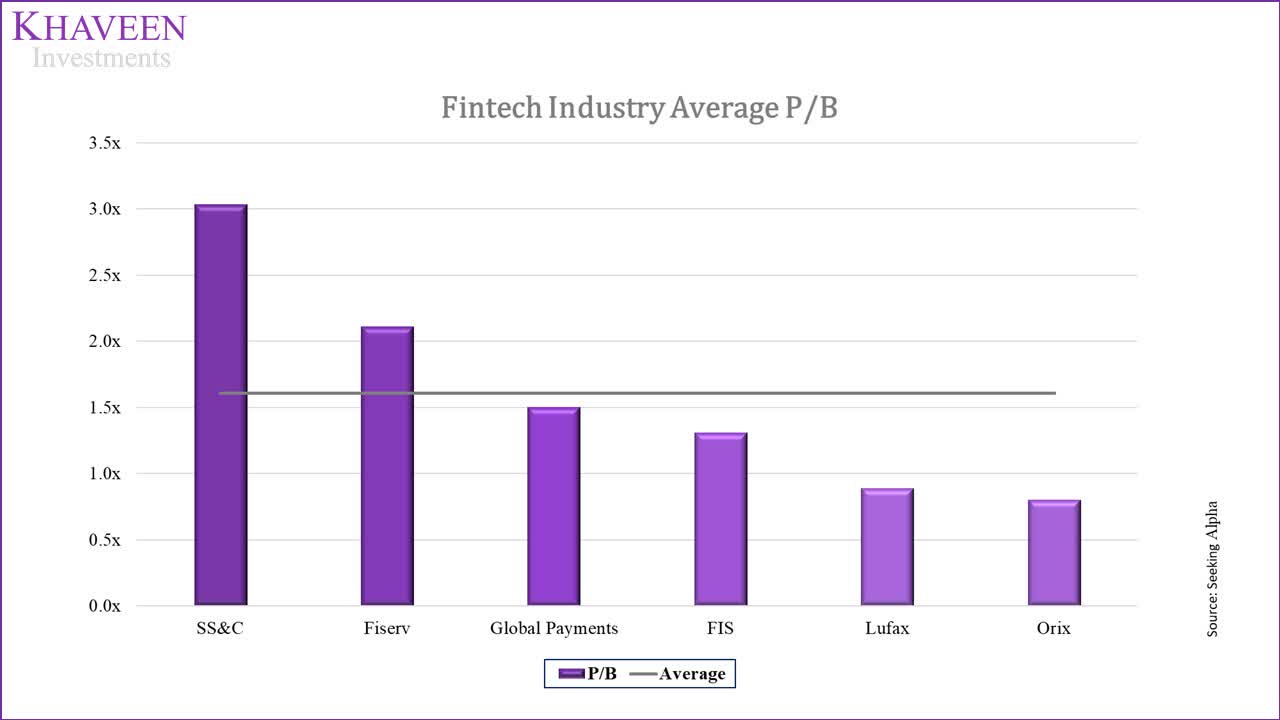
Due to the different valuation methods for Internet Services, Fintech and Mobile segment, we have taken the industry average P/S, and P/B and arrived at three averages of 1.31x, 1.61x and 1.83x respectively.
Seeking Alpha, Khaveen Investments Seeking Alpha, Khaveen Investments Seeking Alpha, Khaveen Investments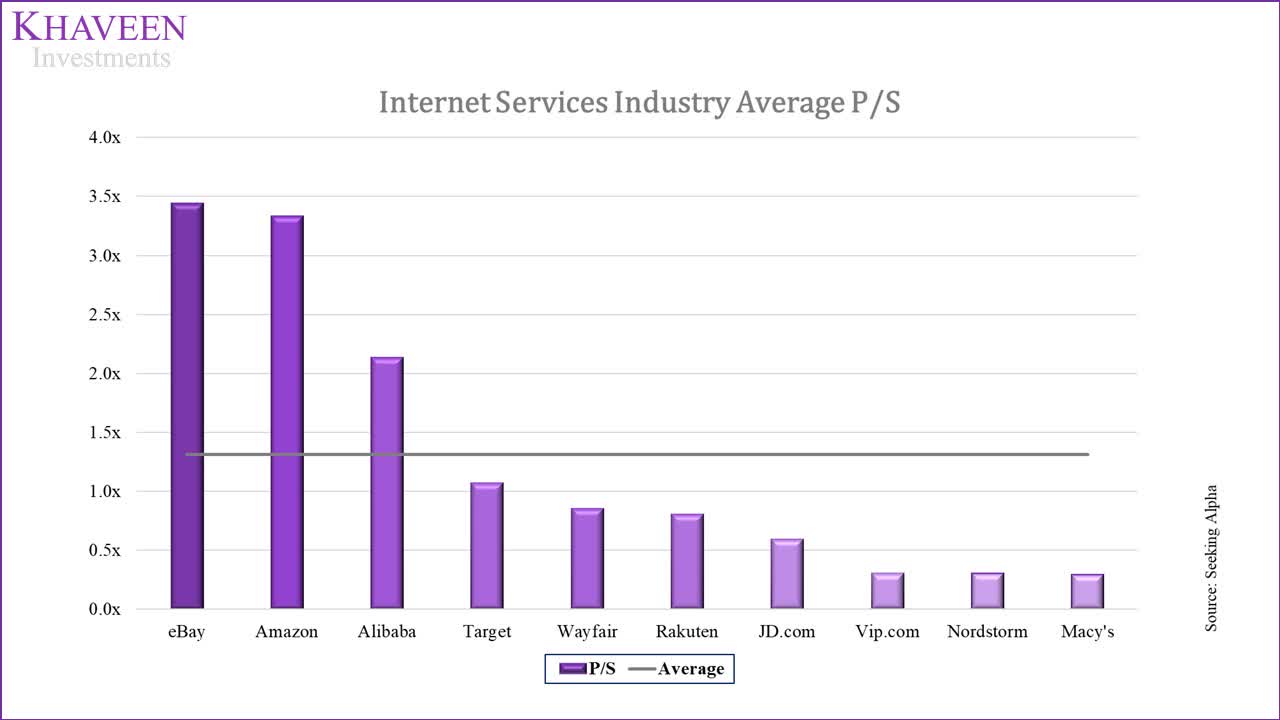
By multiplying our projected revenue and equity value for its segments with the industry averages, we arrived at the total valuation of $24817.10 mln.
|
Internet Services |
||
|
Revenue |
Industry P/S |
Valuation |
|
9,616.48 |
1.31x |
13,650 |
|
Fintech |
||
|
Equity Value |
Industry P/B |
Valuation |
|
5,122.80 |
1.61x |
8,522 |
|
Mobile |
||
|
Equity Value |
Industry P/B |
Valuation |
|
305.35 |
1.83x |
1,003 |
Source: Rakuten, Khaveen Investments
With the total valuation accounting for a 20% conglomerate discount divided by the shares outstanding of the company, we obtained an upside of 50%.
|
Rakuten Valuation |
|
|
Total Valuation ($ mln) |
23,175 |
|
Conglomerate Discount |
20% |
|
Adjusted Valuation ($ mln) |
18,540 |
|
Shares Outstanding (‘mln’) |
1,583 |
|
Target Price |
$11.71 |
|
Current Price |
$7.79 |
|
Upside |
50.30% |
Source: Rakuten, Khaveen Investments
Verdict
We believe Rakuten is poised to benefit from the rise of the e-commerce market in Japan with a leading position only behind Amazon and high customer satisfaction. However, we also expect tough competition from Amazon, the market leader, with more visits, as well as having a higher number of product listings and a variable fee structure. We expect Rakuten’s member growth to continue growing with a 5-year average of 7.47% growth assumption through 2026. Additionally, we believe through its cross-selling strategy, its ARPU growth outlook at a forecast growth rate of 6.13% is supported as customers purchase more from its platform and complement other revenue segments. However, we expect the mobile segment to remain unprofitable and the future competition for the 5G network in Japan could intensify as Rakuten expands aggressively in the country. With the sum of the parts valuation, we rate the company as a Strong Buy with a price target of $11.71.
Be the first to comment