

Pgiam/iStock via Getty Images
Investment Thesis
21st Century paces of change in technology and rational behavior (not of emotional reactions) seriously disrupt the accepted productive investment strategy of the 20th century. Passive investing can’t compete.
One required change is the shortening of forecast horizons. There must be a shift from the multi-year passive approach of buy and hold to the active strategy of specific price-change target achievement or time-limit actions, with reinvestment set to new nearer-term targets.
That change avoids the irretrievable loss of invested time spent destructively by failure to recognize shifting evolution, as in the cases of IBM, Kodak, GM, Xerox, GE, and many others.
It recognizes the progress in medical, communication, and information technologies and enjoys their operational benefits already present in extended lifetimes, trade-commission-free investments, and coming in transportation ownership and energy usage.
But it requires the ability to make valid direct comparisons of value between investment reward prospects and risk exposures in the uncertain future. Since uncertainty expands as the future dimension increases, shorter forecast horizons are a means of improving the reward-to-risk comparison.
That shortening is now best invoked at the investment entry point by using Market-Maker (“MM”) expectations for coming prices. When reached, the expanded capital is then reintroduced at the exit/reinvestment point to new promising candidates, with their own specific near-term expectations for target prices.
The MM’s constant presence, extensive global communications and human resources dedicated to monitoring industry-focused competitive evolution sharpen MM price expectations. But their job is to get buyers and sellers to agree on exchanging share ownership – without having to take on risk while doing it.
Others in the MM community provide protection for capital of the Transaction negotiators, which gets temporarily exposed to price-change risk. Derivative-securities deals to hedge undesired price changes are regularly created. The deals’ prices and contracts provide a window of sorts to view MM price expectations, the best indication of likely near-term outlook.
This article focuses primarily on Radian Group Inc. (NYSE:RDN).
Description of Equity Subject Company
“Radian Group Inc., together with its subsidiaries, engages in the mortgage and real estate services business in the United States. Its Mortgage segment offers credit-related insurance coverage primarily through private mortgage insurance on residential first-lien mortgage loans, as well as other credit risk management, contract underwriting, and fulfillment solutions. This segment primarily serves mortgage originators, such as mortgage banks, commercial banks, savings institutions, credit unions, and community banks. The company’s Homegenius segment offers title services. This segment serves consumers, mortgage lenders, mortgage and real estate investors, government-sponsored enterprises, and real estate brokers and agents. The company was founded in 1977 and is headquartered in Wayne, Pennsylvania.”
Source: Yahoo Finance
Alternative Investments Compared
The investment selections most frequently visited by users of Yahoo Finance were added to by principal holdings of stocks in the subject’s exchange-traded fund (“ETF”), and as a market proxy, the SPDR S&P 500 ETF (SPY) in making up a comparison group against which to match RDN.
Following the same analysis as with RDN, historic sampling of today’s Risk~Reward balances were taken for each of the alternative investments. They are mapped out in Figure 1.
Figure 1.
blockdesk.com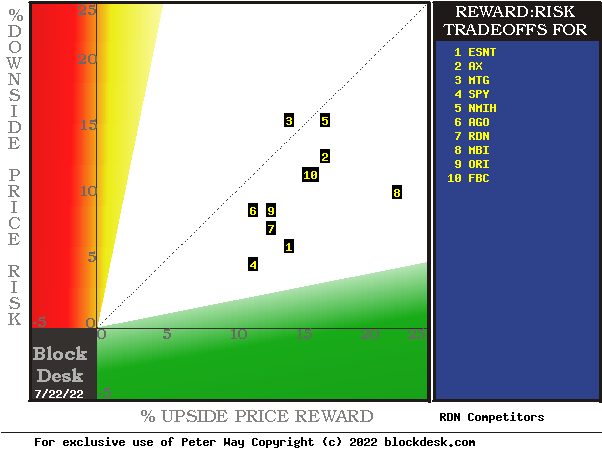
(used with permission).
Expected rewards for these securities are the greatest gains from current closing market price seen worth protecting short positions. Their measure is on the horizontal green scale.
The risk dimension is of actual price drawdowns at their most extreme point while being held in previous pursuit of upside rewards similar to the ones currently being seen. They are measured on the red vertical scale.
Both scales are of percent change from zero to 25%. Any stock or ETF whose present risk exposure exceeds its reward prospect will be above the dotted diagonal line. Capital-gain attractive to-buy issues are in the directions down and to the right.
Our principal interest is in RDN at location [7], midway between locations [6 and 1]. A “market index” norm of reward~risk tradeoffs is offered by SPY at [4].
Comparing Features of Alternative Investment Stocks
The Figure 1 map provides a good visual comparison of the two most important aspects of every equity investment in the short term. There are other aspects of comparison which this map sometimes does not communicate well, particularly when general market perspectives like those of SPY are involved. Where questions of “how likely” are present in other comparative tables, like Figure 2, may be useful.
Yellow highlighting of the table’s cells emphasize factors important to securities valuations and the security RDN, most promising of near capital gain as ranked in column [R].
Figure 2
blockdesk.com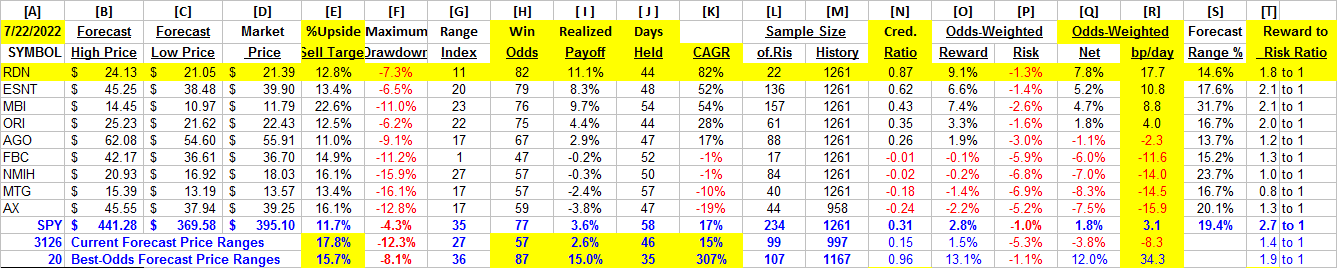
(used with permission)
Why Do All This Math?
Figure 2’s purpose is to attempt universally comparable answers, stock by stock, of a) How big the prospective price gain payoff may be, b) how LIKELY the payoff will be a profitable experience, c) how soon it may happen, and d) what price drawdown risk may be encountered during its holding period.
Readers familiar with our analysis methods after quick examination of Figure 2 may wish to skip to the next section viewing Price range forecast trends for RDN.
Column headers for Figure 2 define investment-choice preference elements for each row stock whose symbol appears at the left in column [A]. The elements are derived or calculated separately for each stock, based on the specifics of its situation and current-day MM price-range forecasts. Data in red numerals are negative, usually undesirable to “long” holding positions. Table cells with yellow fills are of data for the stocks of principal interest and of all issues at the ranking column, [R].
The price-range forecast limits of columns [B] and [C] get defined by MM hedging actions to protect firm capital required to be put at risk of price changes from volume trade orders placed by big-$ “institutional” clients.
[E] measures potential upside risks for MM short positions created to fill such orders, and reward potentials for the buy-side positions so created. Prior forecasts like the present provide a history of relevant price draw-down risks for buyers. The most severe ones actually encountered are in [F], during holding periods in an effort to reach [E] gains. Those are where buyers are emotionally most likely to accept losses.
The Range Index [G] tells where today’s price lies relative to the MM community’s forecast of upper and lower limits of coming prices. Its numeric is the percentage proportion of the full low to high forecast seen below the current market price.
[H] tells what proportion of the [L] sample of prior like-balance forecasts have earned gains by either having price reach its [B] target or be above its [D] entry cost at the end of a 3-month max-patience holding period limit. [I] gives the net gains-losses of those [L] experiences.
What makes RDN most attractive in the group at this point in time is its basic strength in capturing much of the forecast upside [E] in realized payoffs of [I], shown in [N] as a credibility ratio. Only one of its competitors manages to realize profits of half of what has been implied as an upside price gain forecast target.
Further, Reward~Risk tradeoffs involve using the [H] odds for gains with the 100 – H loss odds as weights for N-conditioned [E] and for [F], for a combined-return score [Q]. The typical position holding period [J] on [Q] provides a figure of merit [fom] ranking measure [R] useful in portfolio position preferencing. Figure 2 is row-ranked on [R] among alternative candidate securities, with RDN in top rank.
Along with the candidate-specific stocks these selection considerations are provided for the averages of some 3000 stocks for which MM price-range forecasts are available today, and 20 of the best-ranked (by fom) of those forecasts, as well as the forecast for S&P 500 Index ETF (SPY) as an equity-market proxy.
Current-market index SPY is marginally competitive as an investment alternative. Its Range Index of 27 indicates 3/4ths of its forecast range is to the upside.
As shown in column [T] of figure 2, those levels vary significantly between stocks. What matters is the net gain between investment gains and losses actually achieved following the forecasts, shown in column [I]. The Win Odds of [H] tells what proportion of the Sample RIs of each stock were profitable. Odds below 80% often have proven to lack reliability.
Price Range Forecast Trends for RDN
Figure 3
blockdesk.com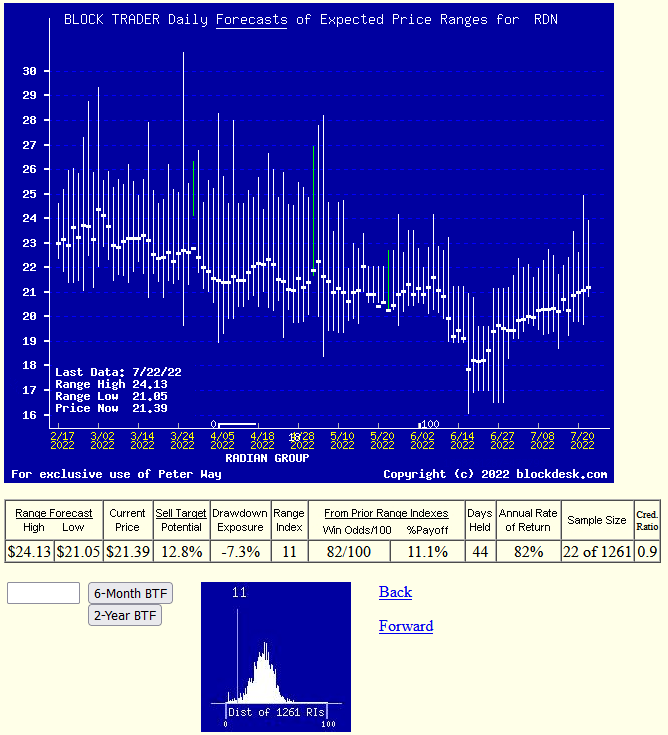
(used with permission)
No, this is not a “technical analysis chart” showing only historical data. It is a Behavioral Analysis picture of the Market-Making community’s actions in hedging investments of the subject. Those actions define expected coming price change limits shown as vertical bars with a heavy dot at the closing price of the forecast’s date.
It is an actual picture of the expected future, not a hope of the recurrence of the past.
The special value of such pictures is their ability to immediately communicate the balance of expectation attitudes between optimism and pessimism. We quantify that balance by calculating what proportion of the price-range uncertainty lies to the downside, between the current market price and the lower expected limit, labeled the Range Index [RI].
Here, the RI at zero indicates no further price decline is likely, but not guaranteed. The odds of 3 months passing without either reaching or exceeding the upper forecast limit or being at that time below the expected lower price (today’s) are quite slight.
The probability function of price changes for RDN is pictured by the lower Figure 3 (thumbnail) frequency distribution of the past 5 years of RI values with the zero today indicated.
Conclusion
The multi-path valuations explored by the analysis covered in Figure 2 are rich testimony to the near-future value prospect advantage of a current investment in Radian Group Inc. over and above the other compared alternative investment candidates.
Be the first to comment