

PM Images
Intro: Visualizing Our Covered Call Strategies
Covered calls are a core part of our strategy to cash out on our growth strategy with a change to retain the underlying asset. In the past, we mainly time our covered calls when the Implied Volatility (IV) is high and when the underlying stock is within our take profit zone. This allowed us to (1) “take profit” without selling the underlying stock, and (2) need not sell the underlying stock if the stock price does not exceed the strike price (which it often does not).
Let’s visualize what it looks like for us to engage in covered calls.
Firstly, we found that a Bitcoin (BTC-USD) company, Bitfarms (BITF) had a 5x upside back in June 2021. Hence, we entered our first position at $3.25 per share. 5 months later in November 2021, as BITF was approaching our price target of $8.50, we suggested selling call options to take profit.
However, if you’re familiar with options, an alternative to taking profits is to sell covered call options with a strike price of $10, trading further upside for a fixed premium. This will be our course of action when BITF hits our price target of $10.
At that time, this was a very sensible move because the premium was over 20% (>$2) when the IV was very high due to BITF spiking above that $9.00 price level. But from our point of view, the premium is enough to not only cover our initial investments but also increase our holdings.
As for our action plan, we’ve bought back only half the call option sold during our previous coverage. The profits made are then used to buy up more BITF shares. We were able to increase our BITF holdings by 25% without additional capital injection. We did not buy back all the call options sold as we’re still being cautious about a potential massive head-and-shoulders pattern on the daily and weekly chart.
We eventually sold all our holdings at around $4.50 backed by our bearish thesis on Bitcoin.
The benefits of our covered call strategy are 2-fold. Firstly, our returns on BITF exceeded 300% which was the return we would earn if we sold at $9.00. Secondly and more importantly, the premiums we collected exceeded the initial capital invested in BITF, this means that we had eliminated all downside by engaging in covered calls when BITF was at its peak.
Since our bearish thesis on growth and Bitcoin, we have since pivoted to value and dividends. However, the strategy is the same, we only sell covered calls to take a profit, not simply for the sake of income generating. We still retain our strategy to seek both capital appreciation and income.
Unfortunately, the Global X Nasdaq 100 Covered Call ETF (NASDAQ:QYLD) does not provide such an avenue based on both history and strategy. Moreover, QYLD is losing its appeal in the return to a high risk-free yield environment.
In this article, we’ll present our case against QYLD and specify the one market condition we’ll consider investing in QYLD.
Why Tech for Income?
QYLD is Positioned as an Income-generating Vehicle
QYLD writes call options on the Nasdaq-100 Index, saving investors the time and potential expense of doing so individually.
In simple words, QYLD’s upside and downside are as below:
- Upside = 0% capital appreciation (assuming at-the-money call is sold) + the 9% annual premium collected.
- Downside = Nasdaq-100 Index’s downside minus the premium (which averages to 9% annually since 2014) collected.
The aggregate of QYLD’s upside and downside potential dictates that QYLD’s price will decline over time. The only question is whether the premiums collected can exceed the share decline. The same applies to other younger covered call ETFs, such as Global X Russell 2000 Covered Call ETF (RYLD) and JPMorgan Equity Premium Income ETF (JEPI). Given enough time, we also expect RYLD and JEPI to follow QYLD’s price trajectory.
Fig 1. QYLD Price Performance Since 2014 (YCharts)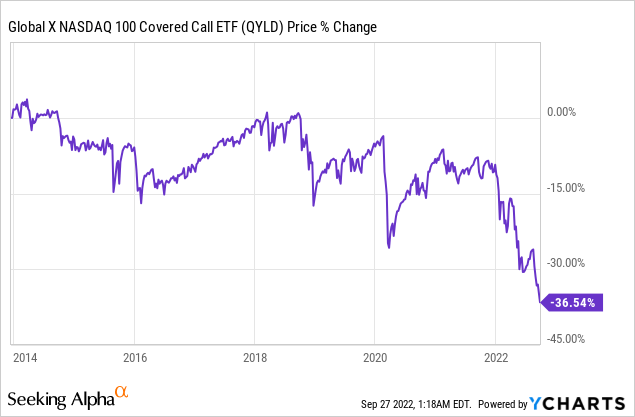
QYLD is faithful in generating income since January 2014 (Fig 1). QYLD was trading at around $25 per share in January 2014 and has distributed a total of $20.80 per share to date. This averages around 9% annually. This 9% also aligns with the Nasdaq-100’s theoretical At-the-money call options based on the Black-Scholes options pricing model.
Fig 2. QYLD’s Distribution History Since Jan 2014 (Author, www.globalxetfs.com)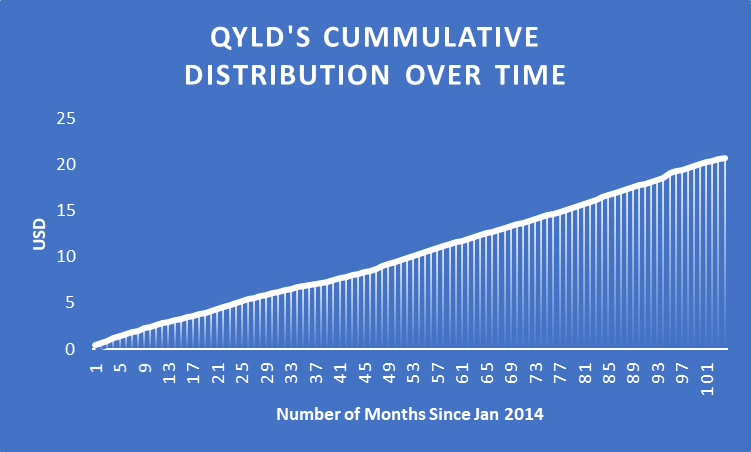
On the other hand, QYLD’s price declined by 4% annually on average. Hence, QYLD’s net average return annually is around 5% while the Nasdaq or Invesco QQQ Trust (QQQ) averages 18%.
The Tech sector and the Nasdaq are often used interchangeably. To us, the main reason to invest in Tech in the first place is the capital appreciation potential, not income generation (dividends). If income is the primary objective, aside from bonds, blue-chip dividend value stocks would serve you better where the yield continues to grow annually based on the initial invested capital without sacrificing any upside.
For instance, Procter & Gamble (PG) was trading for $60 in January 2014 while the dividend almost doubled from $1.85 (or 3% yield) in 2014 to $3.55 (or 6% dividend yield) in 2022.
Therefore, in our opinion, there are better means other than QYLD (passive Nasdaq covered calls) to meet the income generation objective.
Dollar-Cost Average? Price Trajectory Not Unfavorable for Long Time Investing
Logically speaking, if you know now that, structurally, QYLD’s price is deflationary (decline over time) while income distributions remain constant, wouldn’t you wait to “buy” the same amount of income at a lower price?
Fig 3. QYLD’s Distribution Remains Relatively Constant Despite Decline in Price (Author, www.globalxetfs.com)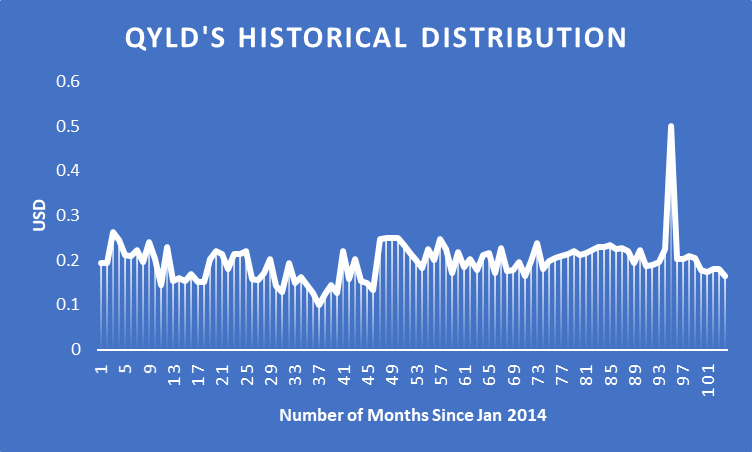
This adds more downside pressure to the price of QYLD, or at least, subtracts more upside potential due to less demand. You might ask why this may be a problem. This may be a problem because QYLD’s price might detach from its net asset value (‘NAV’) and trade significantly lower than its NAV during times of extreme volatility. The escalating Russia-Ukraine war, the collapse of the Euro and the British Pound, the Europe energy crisis, and the risk of famine certainly put the risk of extreme market volatility on the map.
An example is a Trust trading below NAV is the Grayscale Bitcoin Trust (OTC:GBTC) (Fig 4).
Fig 4. GBTC Discount or Premium to NAV Chart (YCharts)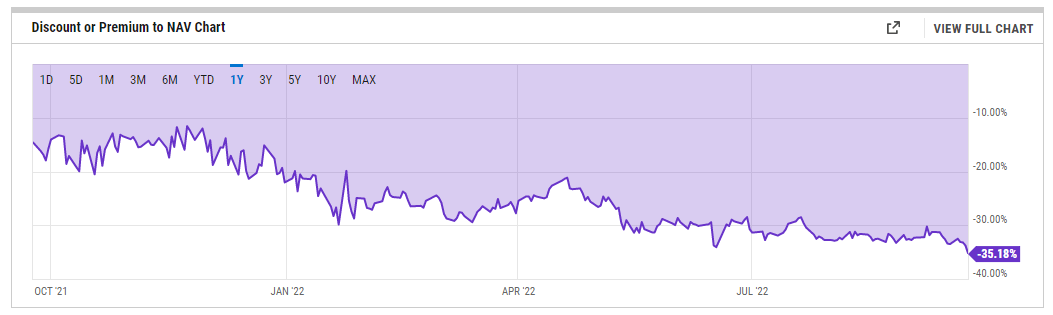
Some investors might argue that reinvesting income generated could amplify income distribution over time. But this holds true for every positive yield asset such as PG. Moreover, if income generation is your main investment objective, you probably have other purposes for the income generated and could not sustain DCA over a long period of time.
A High-interest Rate and Stagnating Market is QYLD’s Best Friend
This begs the question, under what market conditions should we consider investing in QYLD?
According to Global X, QYLD has underperformed the market indices such as the Nasdaq over the past decade due to high growth in the tech sector. Now that the interest rate is increasing, the interest-sensitive Nasdaq is expected to decline. Therefore, this could be the time for QYLD to shine.
Key Takeaways:
– The Nasdaq 100 experienced strong returns over the past decade, largely due to its high-tech growth-oriented exposure
– The Nasdaq 100 is sensitive to bond yields, and therefore, may face pressure if there are rate increases
– Covered call strategies on the Nasdaq 100 are a powerful solution for investors to potentially generate income and monetize volatility amid choppy markets
The keywords are “Pressure” and “volatility”.
- Pressure implies a stagnating or slow growth market
- No price decline to offset the 9% yield from options premium
- No upsides wasted. The 9% average yield from options premium will outperform other indices (S&P500, Nasdaq, DJI, etc.)
- Volatility
- Higher volatility = Higher options premium = More yield
- Increasing Interest Rate
- According to the Black-Scholes pricing model, higher interest rates will increase the premium of call options, which implies increasing the yield of QYLD. However, this upside might be offset by the increased opportunity cost and the declining stock market
Does the current market reflect these conditions? Not yet.
We do not think that the current market is stagnating yet. We expect another round of stock market declines before stagnating. For now, we expect the market to bottom out after the coming winter. By then, if we couldn’t identify drivers for growth, then we’ll consider the high-yielding QYLD.
Verdict
Our main utility for covered calls is to “take profit” rather than simply generate income. Given how we expect QYLD to continue to decline in price, it doesn’t meet our investment objectives to appreciate capital and generate income. Even if our goal is to generate income, blue-chip dividend value stocks would better serve us. Moreover, the risk-free 10Y treasury bond yield (3.88%) has outperformed QYLD’s 3-year average return (2.99%) and is tracking towards QYLD’s 5-year average return (5.41%).
QYLD would be ideal in one very specific market condition: a volatile yet stagnating market. Although the Nasdaq market volatility is currently elevated (Fig 5), we expect the Nasdaq to suffer another leg down before stagnating. Therefore, we’ll put off any investments into QYLD for now.
Fig 5. Elevated Nasdaq Volatility (Author, TradingView)
Be the first to comment