

mi-viri
Investment summary
From the Portfolio Manager’s Desk
We’ve had to remain active on our Quipt Home Medical Corp. (NASDAQ:NASDAQ:QIPT) position this YTD considering its failure to recapture losses from earlier in the year. The downside continues for QIPT, and we’ve debated long and hard at what to do tactically with the stock in our equity risk budget.
On the one hand, we have a stock with the potential to re-rate by several upturns. On the other, investors continue to rotate out of growth names and are positioning for long-term value plays instead. Alas, a dislocation in fundamentals to market behaviour exists. Question is, if this presents an opportunity or not.
QIPT now serves >200,000 active patients across 90 locations and continues to expand on its strategy of organic growth and accretion from acquisitions. To this end, it’s added $4.5mm [$0.13/share] in accretive adjusted-EBITDA after completing 4 acquisitions since April.
We believe QIPT will continue building momentum around its broad offering of end to end respiratory sales. The fact it’s woven itself into the fabric of several adjacent markets means a wider distribution of revenue, and multiple growth levers to touch on. As hospitals and service providers increasingly look to standardize their procedure algorithms, we believe QIPT’s consolidated range also positions it to capture market share going forward.
In addition, we see tremendous earnings upside for the company looking ahead, and are forecasting triple-digit EPS upsides over the coming periods into FY23. We definitely believe the market is under-reflecting this growth potential. The stock has already taken out our previous price targets of $5.60, but we now see upside potential in the realms of $9.50-$11. Rate speculative buy.
Key risks to the investment thesis:
- Persistence of macroeconomic headwinds, such as rates, economic growth, resulting in further selloff in broad equities.
- Weak institutional buying to illicit the momentum needed to see a rate of change in share price.
- The company fails miserably on its growth estimates, either from operations, or threat of competitors.
- Slowdown in key respiratory and durable medical equipment end market.
- Drastic change to CMS rates for DME, reduced capital budgeting from hospitals and service providers.
Investors should heavily consider these risks. Should they eventuate, this would reverse our thesis.
Key data to understand: market, macro drivers
Some investors might be wondering just what it might take to get this stock to move. Despite numerous upside catalysts, the market has continued to re-rate QIPT heavily to the downside in 2022.
But we can’t blame the company, nor investors for the rotation in both factor and sector positioning this YTD.
We note numerous systematic and macro-headwinds [inflation, rates, supply chain, Europe, etc]. Just like in the last inflation/rates cycles, within this cycle, the highest correlating sectors showing upside are utilities, financials, and energy. As much has been reflected in FY22 by the record FCF yields produced by some of the world’s most profitable miners, for example. Perhaps this time, the difference is the presence of a ‘short growth’ trade that’s also been an effective inflation and downside hedge [See: Exhibit 4].
Problems arise in this landscape for equity investors whose portfolios are tied up to growth.
Firstly, traditional sectors [industrials, energy, utilities] have caught a strong bid in 2022, as mentioned. The 2021/2022 commodities rally [oil, natgas, lithium, etc] is chiefly responsible. Those inflows brought on a large factor and sector rotation from 2021.
We can see the cycle of rotation[s] almost pin-point in Exhibit 1. It shows the tech-heavy SDPR S&P 500 ETF (SPY) vs. the Betashares Global Energy Companies ETF (ASX-listing: FUEL.AX) – a terrific proxy for energy stocks given its Australian exposure [Australia via the AUD is not only a proxy for the global economy, but one of the leading producers of global energy resources].
As seen, the reversal started in December, and the pivot-point came in February when the pair finally crossed. This inverse relationship has remained in situ until this date.
Exhibit 1. Factor/Sector rotations spurred on by shifting macroeconomic landscape [energy repricing the primary factor].
Data: HB Insights, Updata. Image from Updata.
This signalled the Fed’s hand in reversing its stance on monetary policy, causing a re-rating of duration and risk-free rates. Indeed, the correlation of stocks/bonds/yields [Exhibit 3] continues a tight fit, with yields leading stocks lower. Growth equities in particular have been compressed with the 10-year yield.
But the market is well aware of these numbers and narrative, it’s not news. Problem is, however, the impulse effect from the re-pricing of rates on risk appetite.
Value therefore retains a positive spread over growth [Exhibit 2], with the pair diverging amid the latest broad rally in equities. Investors are rewarding value factors in a flight to quality in my estimation, which bodes in poorly for strong growers like QIPT.
Exhibit 2. Value retains a positive spread over growth in FY22 with the gap intensifying with the latest trending market
Data: Updata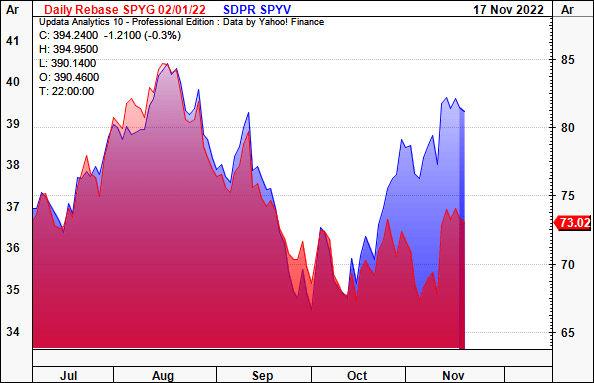
Exhibit 3. Covariance of growth/yields continues tight fit, with yields leading growth stocks lower.
Data: Updata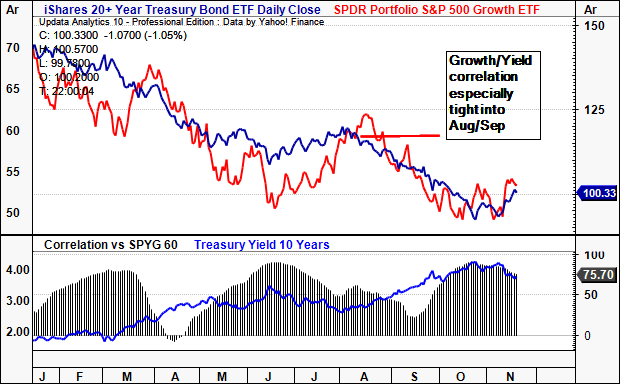
If that isn’t enough, the below chart [Exhibit 4] shows the Short Ark Innovation ETF (SARK) [our proxy for the ‘short growth trade’] versus the SPY to really hammer in the factor rotation.
We’ve tracked the SARK since its inception and noted it serves as terrific evidence of the ‘short-growth’ trade. Clearly the broad risk appetite has dampened and this has caused a severe wind-back in positioning towards growth.
Hence, for QIPT, it’s no wonder net fund exposure has only increased by 20% in total since May FY22 [Exhibit 5]. The lack of accumulation from large buyers means a positive shift in stock price is unlikely, especially at this end of the market cap spectrum.
If you look at the cloud chart below labelled “Exhibit 5(a).”, you’ll see on-balance volume is flat as further reflection of this. These factors have clamped upside potential in QIPT this year to date by our estimation.
Good news is, after identifying these data points, we can look to see a reversal in them as evidence for QIPT’s alpha potential.
Exhibit 4. SARK vs. SPY, daily – the ‘short growth’ trade has performed tremendously well as a dual-long with energy/commodities.
Data: Updata
Exhibit 5. QIPT net fund exposure increased by just 20.4% in total since May = lack of accumulation from large buyers.
Data: Refinitiv Eikon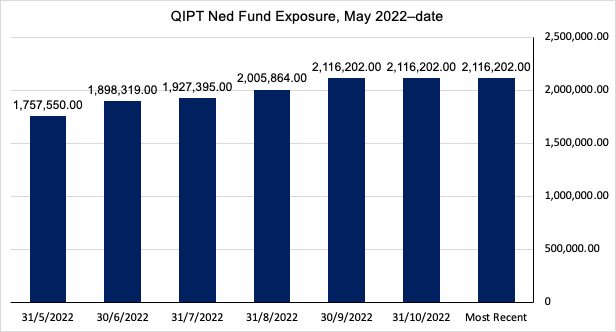
Exhibit 5(a). On balance volume is flat – also suggests lack of accumulation
Data: Updata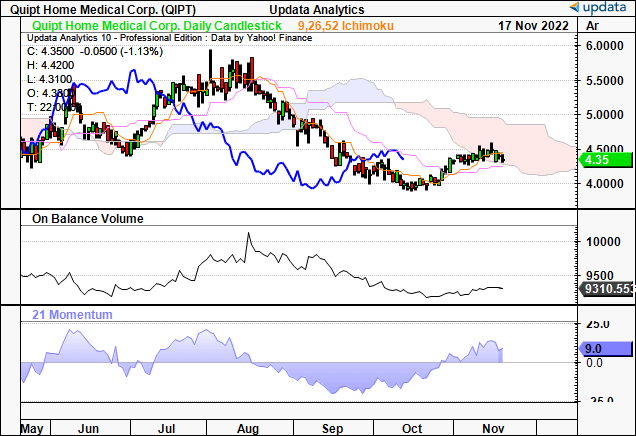
Q3 numbers exhibit growth potential
QIPT continues to grow at pace on a sequential basis. It clipped revenue growth of 40% YoY, printing $36.7mm at the top-line for Q3.
Unique set-ups deliveries grew 40% vs. the year prior to 133,704, whereas respiratory resupply setups grew 55%. This is a positive step after the Philips Respironics’ device recall in FY21′. Patient backlog is now at ~6,000 from the high of ~8,000 in Q1 FY22, with the inventory trend tracking up over time.
Herein lies a mid-term growth catalyst for QIPT in our estimation. A patient joins the company’s resupply program a total 3 months after first being set up on a device. This creates a revenue lag as it makes its way through the 6,000 patient backlog number. Therefore, as the backlog begins to drain, this creates a revenue tailwind as this income will be realized in full into the coming quarters.
Another mid-term growth lever is the current regulatory climate, as CMS announced a 500bps adjustment for durable medical equipment (“DME”) to match CPI earlier in the year. Also, the pricing environment is far more benign after the FY21 competitive bidding round was cancelled, thereby giving clarity on QIPT’s operating margins downstream.
Finally, the UnitedHealthcare (UHC) contract is a key insulator that we believe will reduce capital intensity and increase operating for the company. It can leverage this contract within its growth route to expand patient, capital equipment access, as UHC will help to finance growth.
This leaves enormous headroom to generate future value from return on invested capital and retain EBIT margin.
As much was confirmed Seeking Alpha contributor Aaron Warwick’s recent analysis on the company. His synopsis sums up the opportunity nicely:
By signing this national contract with UHC, QIPT has ensured that wherever they expand, UHC will pay for QIPT’s equipment and services. Since UHC is the largest health insurer in the US, this national contract provides significant advantage to QIPT. Moreover, the contract allows QIPT to easily layer on additional equipment and services to the business of its acquired companies.
Growth assumptions reveal tremendous earnings upside
We note the tremendous earnings upside in both management and consensus’ forecasts. We are aligned with both and see triple-digit EPS growth each period in to FY23. It’s not unreasonable for QIPT to see 150% upside per share at the bottom-line in Q4, by estimate. We’ve charted these EPS growth assumptions in Exhibit 7.
Given the stock’s performance this year, there’s a clear divergence between fundamentals to market behaviour. The market is definitely under-reflecting this growth potential in the QIPT share price in our opinion.
Question is, what’s the likelihood it will recognize this and reward the company accordingly [especially given trends this YTD]?
Exhibit 6. QIPT Forward estimates summary FY22-24′ [qrtly, annual]
Data: HB Insights Estimates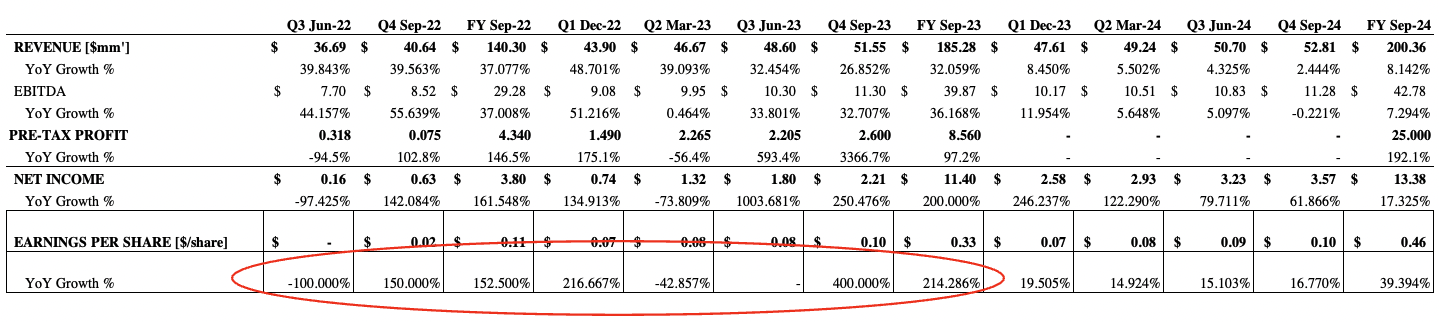
Exhibit 7. Bottom-line growth assumptions, FY22-24′
Data: HB Insights Estimates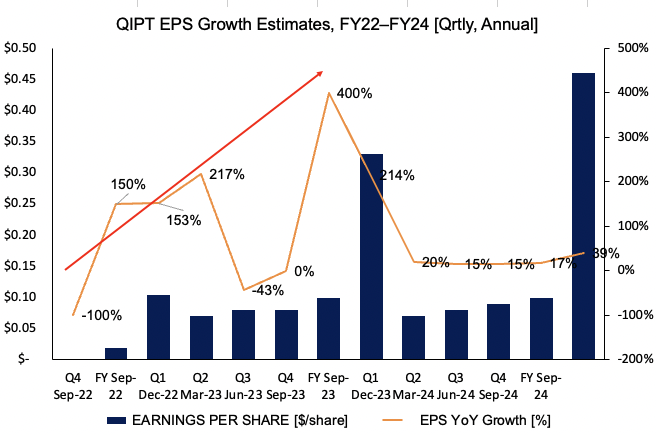
The technical picture
Given these recent developments, we then checked for a connection between fundamentals and technicals to guide price visibility looking ahead.
The stock has tried to slow its pace of decline and formed a base 2-3 times since its FY21 peak. With each relief rally, as it back and filled in sideways consolidation, the weekly volume trend was contracting. It failed to break the 50DMA on each attempt. This combination is evidence of heavy resistance in our opinion.
With the latest relief rally the stock has turned off its low-point and tracks toward the 50DMA and 250DMA. The question is will it break through this resistance point?
In the last attempted rally [June/July 2022] volume dried up before it broke-out to the upside. This has served as a good entry point on multiple occasions into the stock since its IPO in FY18.
The volume trend has been contracting into this latest move [October/November]. This could be a good or a bad thing, depending on what unfolds in the coming weeks. Technical evidence is unclear on whether it will fail this attempt as well.
Exhibit 8. QIPT 2-year weekly price evolution
Data: Updata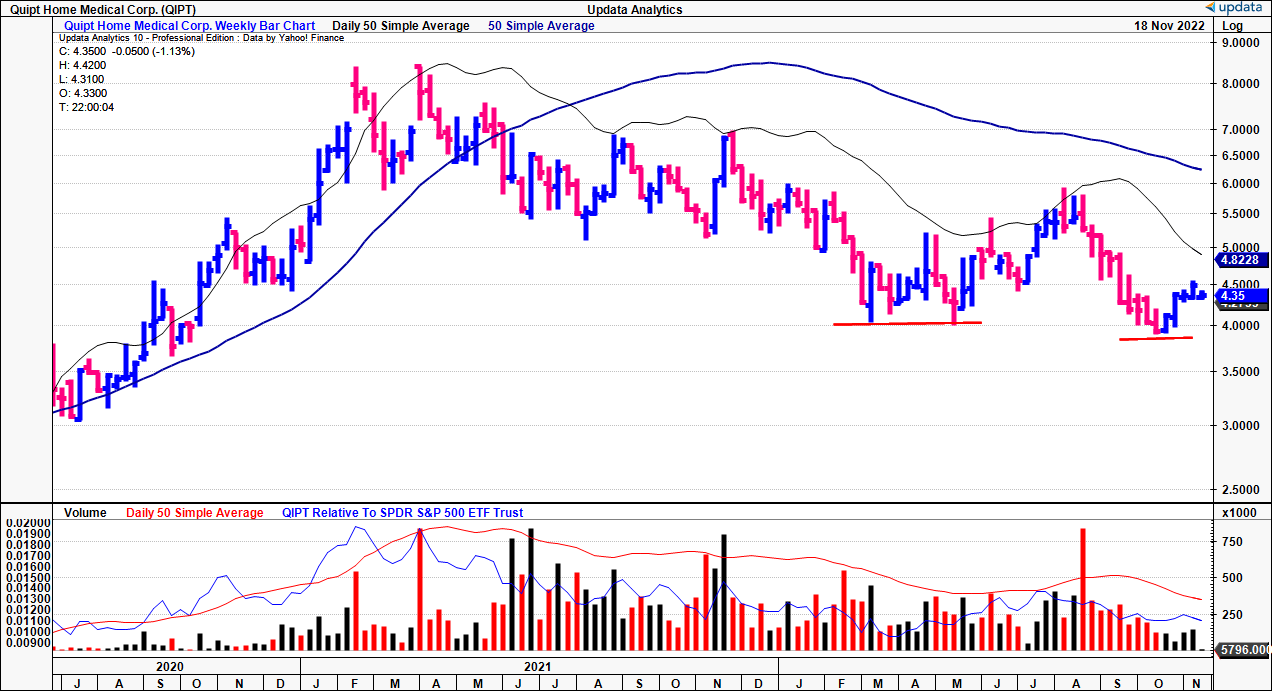
For example, we had previous short-term price targets to $5.50-$5.60 in our last coverage on the stock.
QIPT took this level out in August within its previous up-cycle. This gives me greater confidence on targets looking ahead.
You can see this in the takeout from the analysis, below.
Takeout from our previous QIPT analysis [Exhibit included]:
“In terms of price action, point & figure analysis on a 3-box reversal and 0.1 box size shows the stock has broken through two inner-resistance lines and is showing upside targets at $5.50 and $5.60. Previous downside targets have already been confirmed and taken out, before the latest upswing.
- Previous analysis, Exhibit 10 – “Multiple upside targets to $5.50-$5.60”:
Data: Bloomberg. Image taken from: HB Insights: “Quipt: At A Turning Point, Seeking 40% Return Objective” [June 29 2022].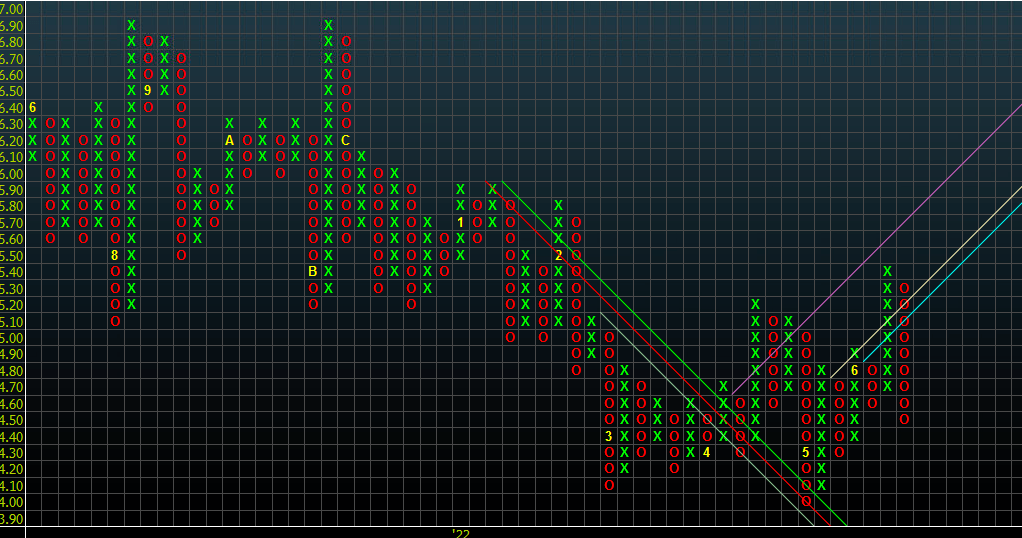
Alas a key risk is the new downside technical price target shown below to $3.70.
With the stock displaying good confluence to the price targets outlined from these chart studies, this is a serious consideration for price distribution in the near-term.
Exhibit 9. Downside targets to $3.70 after taking out previous $5.60 target.
Data: Updata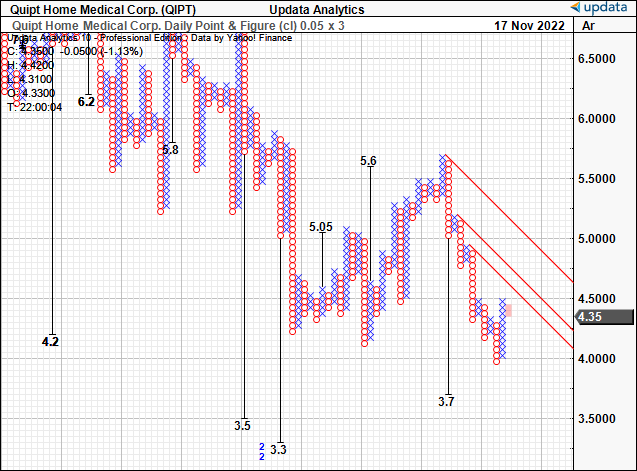
Price objectives to $9.55, $11.07
Consensus has QIPT valued at 32x forward non-GAAP earnings and 40x forward GAAP EPS. This grossly undervalues the forward upside capture for QIPT in our opinion, especially seeing our >100-200% quarterly EPS growth assumptions looking ahead.
We therefore believe QIPT should trade at close to 87x FY22 earnings, deriving a price target of $9.55. Looking further out, rolling our FY23 estimates forward and we value the stock at 39.5x FY23′ P/E. This derives a price target of $11.
Each scenario offers 120-155% upside potential respectively, confirming our buy thesis.
Exhibit 10. Forward P/E assumptions: FY22 estimates
Note: Fair forward price-earnings multiple calculated as 1/fair cost of equity. This is known as the ‘steady state’ P/E. For more and literature see: [M. Mauboussin, D. Callahan, (2014): What Does a Price-Earnings Multiple Mean?; An Analytical Bridge between P/Es and Solid Economics, Credit Suisse Global Financial Strategies, January 29 2014] (Data: HB Insights Estimates)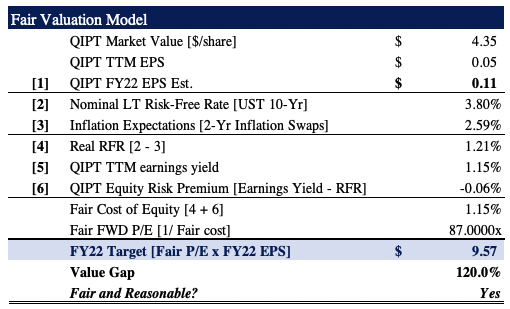
Exhibit 11. Forward P/E assumptions: FY23 estimates.
Note: As above. (Data: HB Insights Estimates)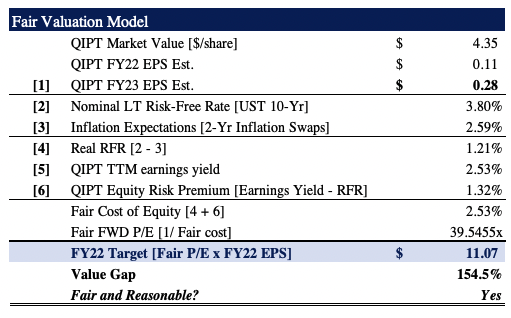
Here’s the deal. We continue to rate QIPT a speculative buy and see enormous upside potential in the stock should the market align itself with the company’s growth percentages. Problem is, that’s been a challenge this year to date as the market seems focused/fixated on other systematic factors right now. Alas, we say to keep sizing small for now, eyeing a move above the 50DMA and volume breakout [weekly chart] as good markets for an entry decision. Our next price objectives are $9.50, then $11. Rate buy.
Be the first to comment