

Drs Producoes/E+ via Getty Images
Investment Thesis
Today, I will review the First Trust NASDAQ Clean Edge Green Energy Fund (NASDAQ:QCLN), one of a handful of renewable energy ETFs currently trading on U.S. exchanges. I was nervous about what I’d find after digging into QCLN, but to my surprise, QCLN’s fundamentals are better than I imagined. Though it trades at an exceptionally high valuation, more than 50% of the portfolio has a Seeking Alpha Growth Grade of A- or better, and 70% of companies are operating cash flow positive. Unfortunately, QCLN has considerable timing risks, and initiating a position isn’t prudent in this risk-off environment, despite last week’s optimistic inflation numbers. Therefore, I’ve decided to remain neutral, and I look forward to explaining why in more detail next.
ETF Overview
Strategy Discussion
QCLN tracks the Nasdaq Clean Edge Green Energy Index, selecting small- mid- and large-cap U.S.-listed common stocks and depositary receipts classified as technology manufacturers, developers, distributions, or installers that fall under one of the following four sub-sectors:
- Advanced Materials: nanotech, membranes, silicon, lithium, carbon capture and utilization, and other materials and processes that enable clean-energy technologies
- Energy Intelligence: conservation, automated meter reading, energy management systems, smart grid, superconductors, and power controls
- Renewable Electricity Generation & Renewable Fuels: solar photovoltaics, concentrating solar, wind, geothermal, and ethanol, biodiesel, biofuel enabling enzymes
- Energy Storage & Conservation: advanced batteries, hybrid drivetrains, hydrogen, fuel cells for stationary, portable and transportation applications
Additional criteria include a minimum market capitalization of $150 million, an average daily trading volume of at least $100,000 shares, and a minimum closing price per share of $1. The Index is weighted based on a modified market capitalization methodology and is rebalanced quarterly and reconstituted semi-annually.
The Index has exposure to 19 GICS industries, with the top ten as follows:
- Semiconductor Equipment: 21.67%
- Automobile Manufacturers: 18.13%
- Semiconductors: 13.92%
- Electrical Components & Equipment: 13.68%
- Specialty Chemicals: 11.82%
- Renewable Electricity: 9.14%
- Fertilizers & Agricultural Chemicals: 2.33%
- Diversified Metals & Mining: 1.82%
- Electronic Equipment & Instruments: 1.72%
- Heavy Electrical Equipment: 1.26%
The top six total 88.36% of the ETF, so it’s not well-diversified. However, diversification isn’t the purpose of thematic ETFs like QCLN. Proponents of thematic investing (which I am not) argue that a better way to design a portfolio is to invest in various themes like renewable electricity, low carbon, artificial intelligence, and fintech. Unfortunately, this approach often ignores risk management. Of the 38 thematic ETFs I track, the average five-year beta is 1.27, so they’re best suited for growth investors with a long time horizon.
Sector Exposures and Top Ten Holdings
FactSet lists three peers for QCLN in the Renewable Energy segment:
Morningstar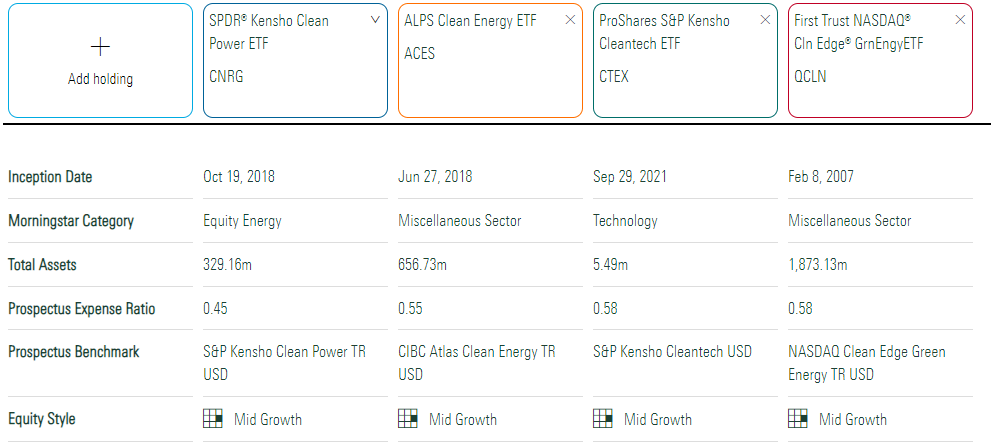
QCLN’s 0.58% expense ratio is tied for the highest, but it’s also the most established, dating back to February 2007. The SPDR Kensho Clean Power ETF (CNRG) and the ALPS Clean Energy ETF (ACES) have been around for about four years, while the ProShares S&P Kensho Cleantech ETF (CTEX) is the newest to hit the market. However, with just $5.49 million in assets under management, the economics don’t favor it being around for long.
Each ETF’s sector exposures are listed below. QCLN holds stocks across five sectors: Technology (36.72%), Consumer Discretionary (17.80%), Industrials (16.84%), Materials (16.26%), and Utilities (10.88%). CNRG and CTEX take an equal-weight tiered approach to weight constituents, while ACES and QCLN follow a vanilla market-cap-weighting scheme.
Morningstar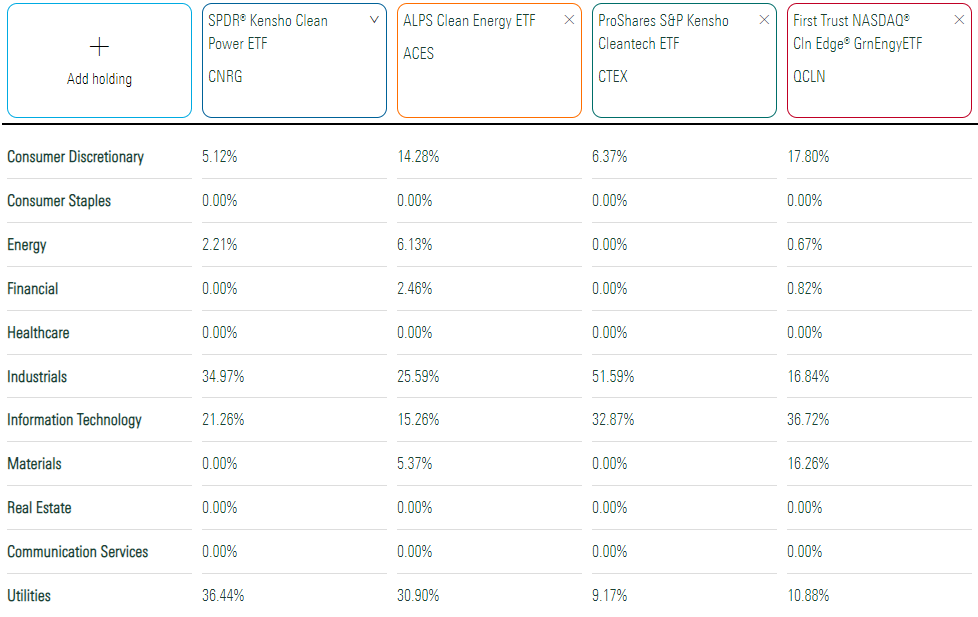
Finally, the listing below of QCLN’s top 25 holdings totals 84.80% of the portfolio. Albemarle (ALB), the beneficiary of a 200%+ lithium price increase this year, is up over 40% YTD and has a $38 billion market capitalization. For reference, the median market capitalization for QCLN constituents is just $2.76 billion, which helps explain ALB’s 10.05% portfolio weighting.
First Trust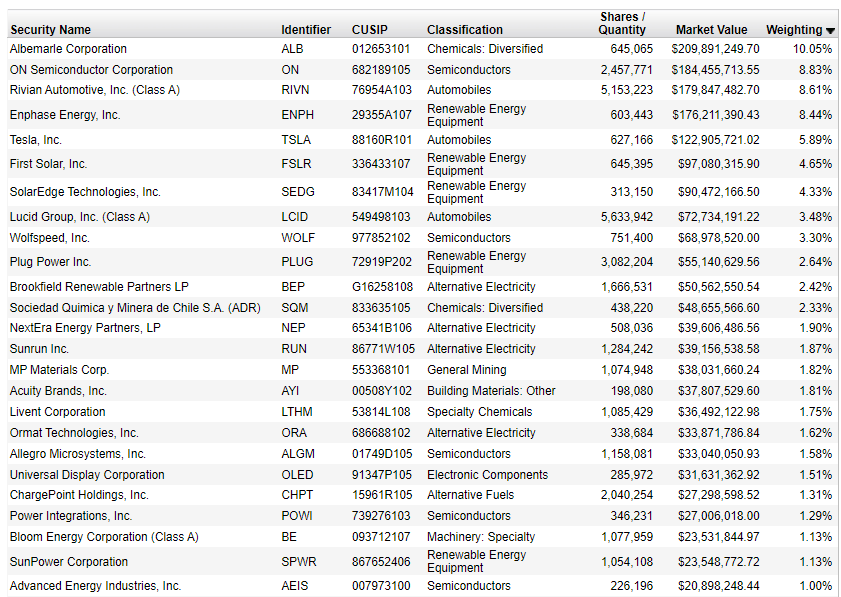
ETF Analysis
Using Profitability To Gauge Speculation
First and foremost, QCLN is a speculative investment. It shouldn’t replace a core holding like SPY, but a certain degree of speculation is appropriate in most cases. I like to keep it around 5% of my total portfolio, but this figure can vary widely based on your risk tolerance.
An objective way to measure speculation is by analyzing company profitability. For an ETF, it’s a bit more involved, but Seeking Alpha provides Profitability Grades for 59/62 of QCLN’s constituents or 91.25% of the ETF. For example, consider ALB and its B- Profitability Grade. Relative to other companies in the Materials sector, ALB has excellent EBIT and net income margins but a poor asset turnover ratio.
Seeking Alpha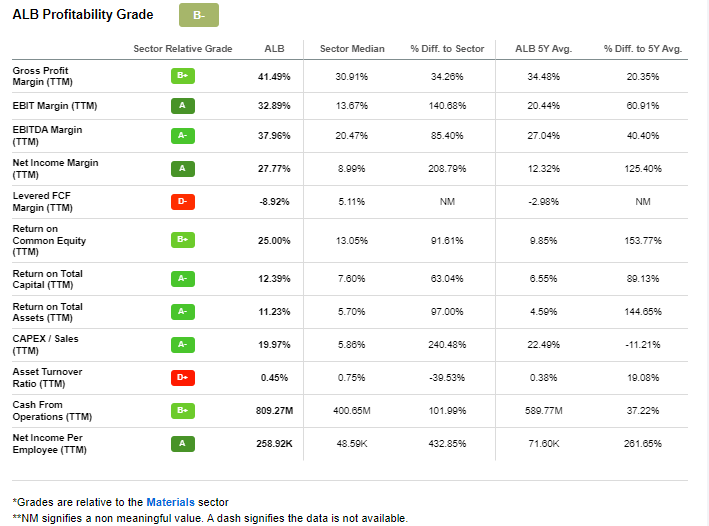
While no quant system is perfect, the results align with a logical person’s expectations. To illustrate, consider the median profitability scores, which I’ve normalized on a ten-point scale, for the following ETF categories:
- Small-cap dividends: 5.75
- Small-cap value: 5.86
- Small-cap blend: 6.25
- Small-cap growth: 6.49
- Mid-cap dividends: 6.98
- Mid-cap value: 6.77
- Mid-cap blend: 6.96
- Mid-cap growth: 7.55
- Large-cap dividends: 9.30
- Large-cap value: 8.98
- Large-cap blend: 9.21
- Large-cap growth: 9.24
Profitability improves as market capitalization increases. In addition, value ETFs are often less profitable than growth ETFs, meaning their lower valuations are at least partially justified. Nevertheless, the easiest way to avoid speculative stocks is to stick with large-cap ETFs.
The median profitability score for thematic ETFs with a specific focus is 6.41, placing it close to the small-cap growth category. Unfortunately, QCLN’s profitability score is just 5.46, further evidence that the ETF is highly speculative. Investors should proceed cautiously and understand that an extreme risk-on environment is needed to justify the uncertainty. Still, CNRG, ACES, and CTEX have profitability scores of 5.10, 3.50, and 4.61, so while QCLN is still a speculative ETF, it appears to be of higher quality than its closest competitors.
Company Snapshot
The following table summarizes selected fundamental metrics for QCLN’s top 25 holdings, which cover 84.81% of the portfolio. I’ve listed summary metrics for CNRG, ACES, and CTEX in the bottom rows for comparison purposes.
The Sunday Investor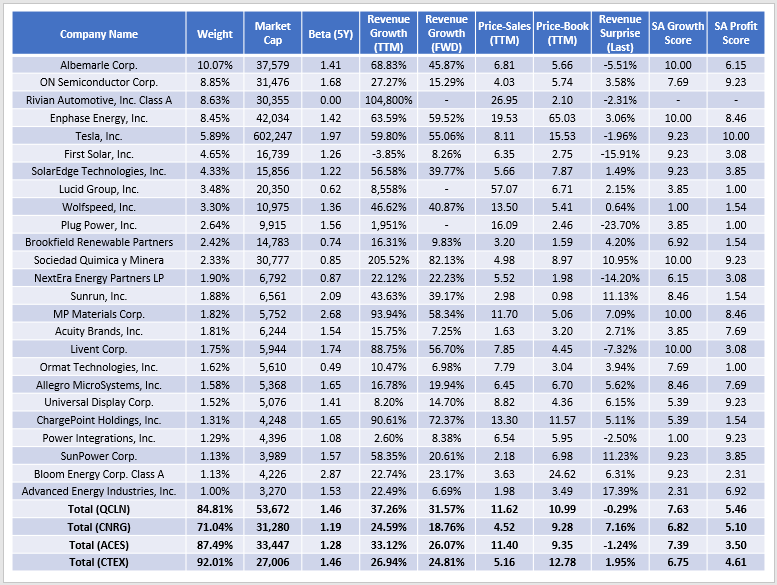
QCLN has a 7.63 growth score, supported by its estimated 31.57% revenue growth rate. Like nearly all U.S. equities, this growth is lower than the last twelve months (37.26%), but it’s still better than its three peers. ACES, the other market-cap-weighted ETF, also looks good from a growth perspective, but as mentioned before, its 3.50 profitability rating is disastrous. The main benefit is a lower five-year beta, but that’s probably not a concern for the average speculative investor.
High valuations often accompany growth, and QCLN is no exception. It currently trades at 11.62x trailing sales and 10.99x trailing book value. A few heavily-weighted companies like Rivian Automotive (RIVN) skew QCLN’s valuation. RIVN, a startup expected to produce 25,000 electric vehicles this year, has a $30 billion market capitalization yet is likely years away from earning a profit.
Seeking Alpha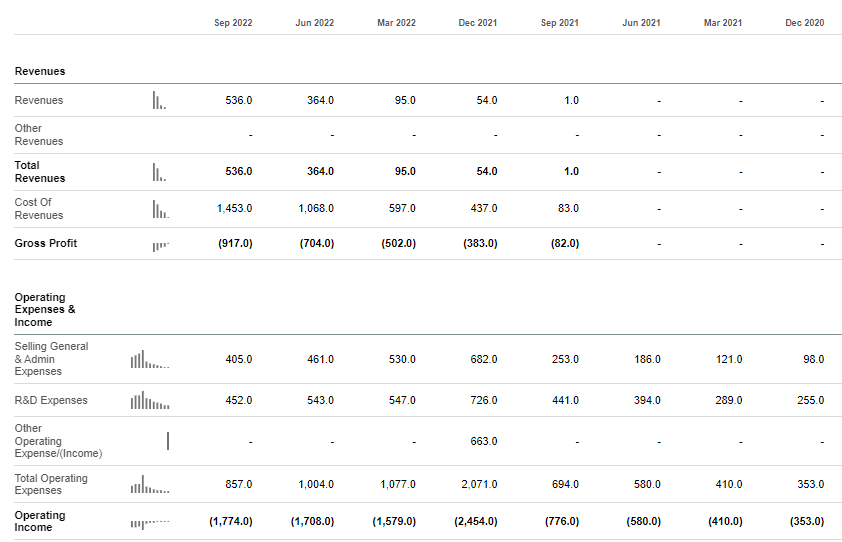
RIVN is just one example, but over half of QCLN’s constituents had negative operating cash flow over the last twelve months. These 32 companies account for 31.48% of the ETF, compared to 29.48%, 42.27%, and 42.64% for CNRG, ACES, and CTEX, respectively.
Performance Analysis
Comparable broad-market ETFs include the Vanguard Small-Cap Growth ETF (VBK) and the Vanguard Mid-Cap Growth ETF (VOT). These are good choices for growth investors wanting to diversify by size, and they’ve outperformed since March 2007 despite QCLN’s meteoric rise in 2020. However, QCLN’s standard deviation and drawdown figures are much larger, leading to inferior risk-adjusted returns (Sharpe and Sortino Ratios).
Portfolio Visualizer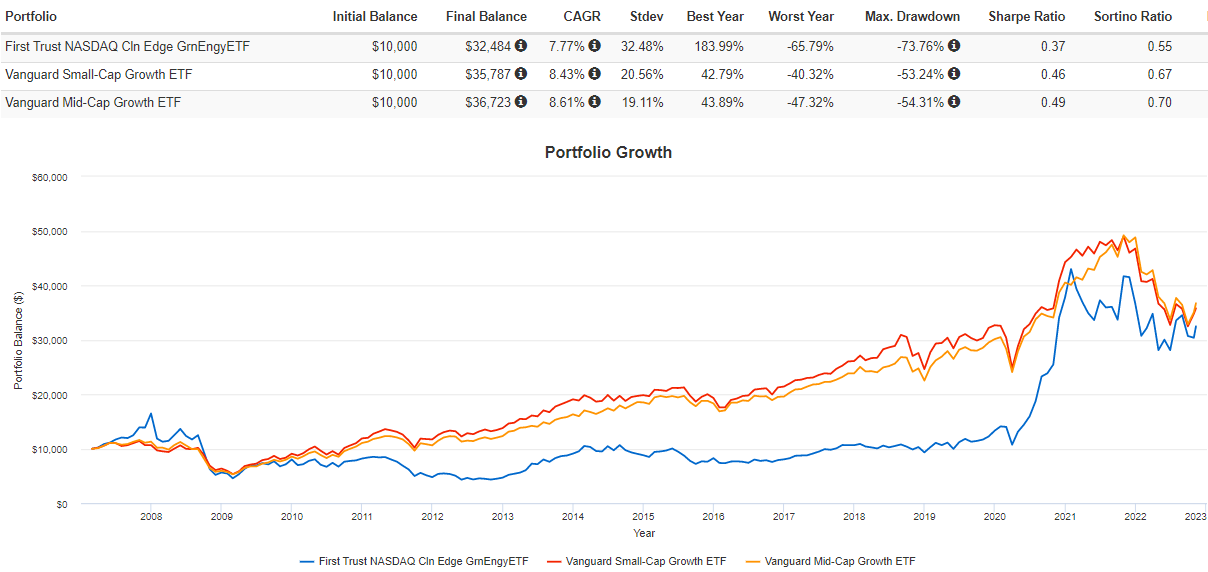
First Trust reports a 7.34% annualized return through October 31, 2022. Excluding fees and other sources of tracking error, its Index has gained 7.57% per year vs. 6.76% for the Russell 2000 Index. This is not a fair comparison, given how QCLN is primarily a growth ETF. Nevertheless, it’s a data point in favor of growth investing, assuming you’re able to take on the additional risk.
First Trust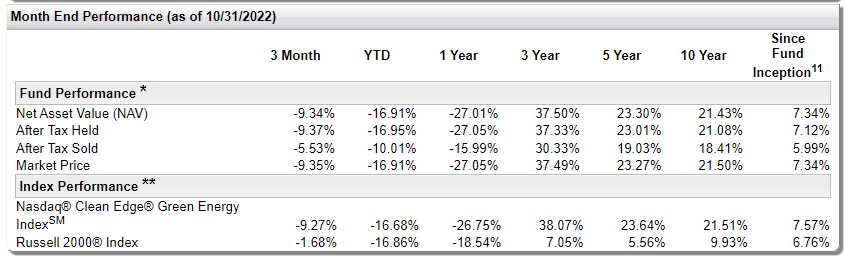
Long-term price charts are important to consider because they can highlight timing risks. QCLN outperformed VOT by 51.75%, 61.49%, and 149.50% in 2007, 2013, and 2020. These vast gains are necessary because otherwise, the average annual underperformance was 10.11%. I believe the timing risks are too significant due to negative earnings surprise trends. As detailed in the fundamentals table above, the weighted-average sales surprise for QCLN’s constituents was -0.29%, well below the 3.20% and 2.80% averages for the S&P 600 and the S&P 400 Indexes, as reported by Yardeni Research. Last week, QCLN gained 10.37%, consistent with how other growth ETFs performed in response to a lower-than-expected inflation reading. More of this is needed to support a risk-on environment, but until we start seeing the effects in the financials, QCLN and other renewable energy ETFs remain very risky.
Investment Recommendation
I could go either way on QCLN. On the one hand, it looks better than its peers. The 149.50% total return in 2020 is tempting, and its 31.57% expected sales growth rate is among the highest I’ve seen. Only Fintech, AI, and a host of energy-focused ETFs offer similar growth, so QCLN appears well-positioned should the risk-on environment return. However, the market environment does not support investing in QCLN or other renewable energy ETFs. QCLN looks the best regarding profitability, but it’s richly valued, highly volatile, and has an inferior track record than broad-based funds like VBK and VOT. If you want to speculate, these ETFs are the more responsible route. Remember, even though renewable energy is the future, that doesn’t mean you should buy it at any price and at any time.
Be the first to comment