

Darren415
This article was first released to Systematic Income subscribers and free trials on July 17.
Welcome to another installment of our Preferreds Market Weekly Review, where we discuss preferreds and baby bond market activity from both the bottom-up, highlighting individual news and events, as well as top-down, providing an overview of the broader market. We also try to add some historical context as well as relevant themes that look to be driving markets or that investors ought to be mindful of. This update covers the period through the second week of July.
Be sure to check out our other weekly updates covering the BDC as well as the CEF markets for perspectives across the broader income space.
Market Action
Preferreds were up on the week, supported by a drop in Treasury yields and a stabilization in credit spreads. All but two sectors are up on the month. So far, July has brought some relief to the market with a +1% total return, offsetting about a third of the June drop.
Systematic Income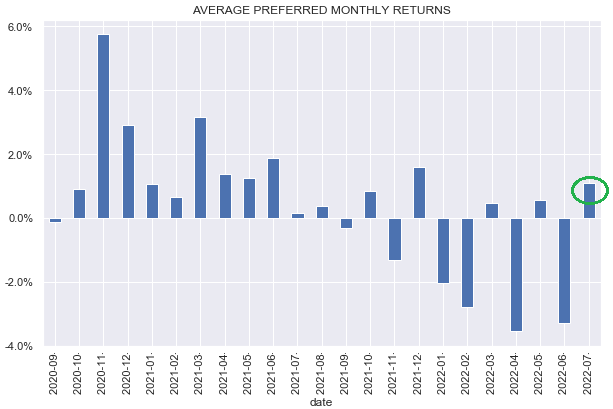
A drop in Treasury yields – 10Y yields stand 0.56% below their recent peak in mid-June – as well as a fall in credit spreads have been supporting fixed-income sectors like preferreds in the last few weeks.
The preferreds median yield-to-worst has traded in a 6-6.5% yield range since Q2. It’s unlikely we see a sharp drop in yields going forward. Credit spreads will likely remain elevated on the back of a slowing aggregate demand picture, a sharp pace of hikes by the Fed and its likely result in a recession sometime in 2023. Treasury yields should also remain elevated even if inflation starts to peak over the following few months given it’s unlikely to collapse from current levels.
Systematic Income Preferreds Tool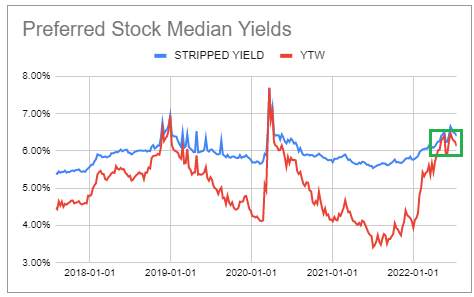
Market Themes
There was an interesting exchange on the service about the price action of preferreds this year, specifically, whether preferreds trade with equities or trade with interest rates. If we put aside whether this is a useful question or not – we can look at a couple of different metrics. We can simply point to the broader moves – for example, (common) equities, broadly speaking, are down 20% while preferreds, if we look at the larger ETFs, are down around 13%.
Systematic Income Preferreds Tool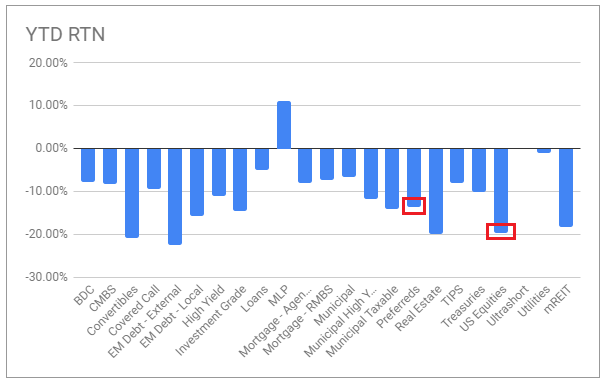
So yes both are sizable moves. But the reason preferreds are down a lot is not because stocks are down a lot. It’s because stocks AND bonds are down a lot. For instance, medium-term Treasuries are down 10% while long-dated Treasuries are down 20% – very unusual moves for the sector. If bonds were up, preferreds returns would not be anywhere near stock returns.
We can also look at the beta of preferreds i.e. how their daily returns look relative to daily stock returns. The beta of, by far the largest preferred fund, iShares Preferred and Income Securities ETF (PFF) has risen to about 0.5 which is on the higher side (historic average is closer to something like 0.25). That 0.5 beta is high but it’s not really close to 1 at which level we could say preferreds are trading like stocks. Preferreds beta does tend to rise when volatility increases which is because credit spreads start to dominate returns and spreads can be very volatile. If we look at a more representative picture of the preferreds market then the (3-month rolling) beta of the First Trust Preferred Securities and Income ETF (FPE) which holds both retail and institutional preferreds is only 0.2.
Systematic Income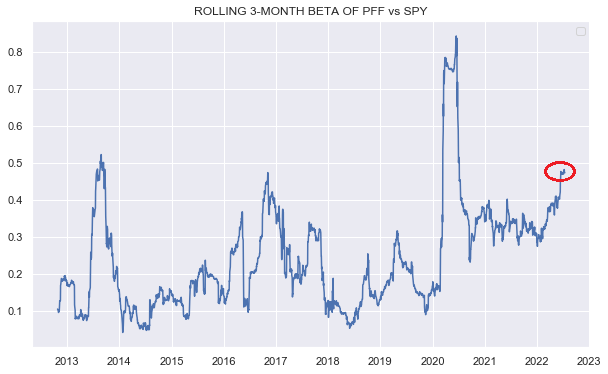
What we can say is that the volatility of preferreds, and other fixed-income assets, has increased because Treasuries and stocks have mostly moved, unusually, in the same direction in the first half of this year. This pattern has already started to reverse as Treasuries have begun to trade in the opposite direction from stocks since the market is now more focused on recession rather than inflation.
Market Commentary
In the mortgage REIT Annaly preferreds suite NLY.PF has continued to outperform NLY.PI. Since the start of the year F has outperformed by about 9% (-6% vs -15% total return) and by about 5.5% since it was highlighted on the service in April. It’s now verging on being expensive.
Systematic Income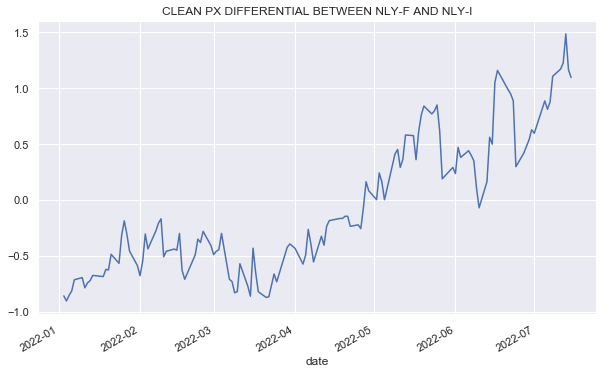
Our view is that it’s still likely to get a pop when it floats in September, particularly, as the market is now pricing in an even faster path of near-term hikes. When the stock floats, its stripped yield will be much higher than that of NLY.PI which should allow it to outperform further. However, for longer-term buy-and-hold investors I is beginning to look as, if not more, attractive relative to F.
Systematic Income Preferreds Tool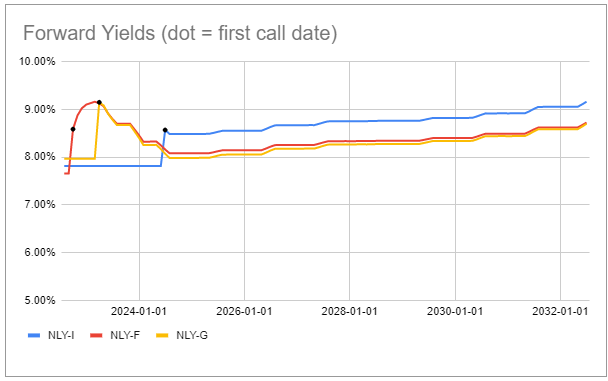
Stance And Takeaways
The 2s10s Treasury yield curve has inverted by about 0.2% as of this writing – a level we haven’t seen in about 15 years. The continued rise in short-term rates should continue to support floating-rate preferreds or those that are due to float in the next few months – a sub-sector which we are focused on at the moment.
At the same time we don’t expect preferreds yields to move significantly lower. This is because the scenario where both Treasury yields and credit spreads jump lower is extremely unlikely. Treasury yields are only likely to move significantly lower in case of a hard landing – a pattern which we have seen many times before. However, in this scenario credit spreads will move significantly higher as the market starts to price in a much greater level of corporate distress. Credit spreads are off their tights but not yet near typical recessionary levels. This keeps us somewhat cautious in chasing the small rally we have seen in the last few weeks.
Be the first to comment