

da-kuk/E+ via Getty Images
This article was first released to Systematic Income subscribers and free trials on Jan. 24.
Welcome to another installment of our Preferreds Market Weekly Review where we discuss preferreds and baby bond market activity from both the bottom-up, highlighting individual news and events, as well as top-down, providing an overview of the broader market. We also try to add some historical context as well as relevant themes that look to be driving markets or that investors ought to be mindful of. This update covers the period through the third week of January.
Be sure to check out our other weekly updates covering the BDC as well as the CEF markets for perspectives across the broader income space.
Market Action
Preferreds did not escape unscathed with all sectors finishing lower this week. That said, the moves in most sectors have not been extreme and, on a month-to-date basis, three sectors are still in the green.
Systematic Income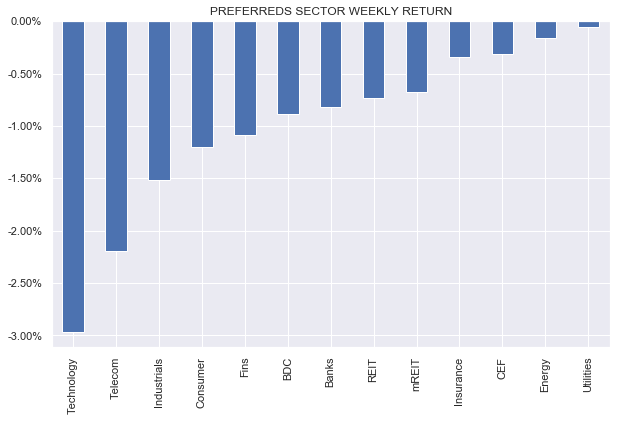
Unlike its CEF counterpart, the monthly picture in the preferreds sector is quite benign. The total return for January is still stronger than what it was for November and October of last year. By contrast, the CEF market total return in January is the worst since March of 2020.
Systematic Income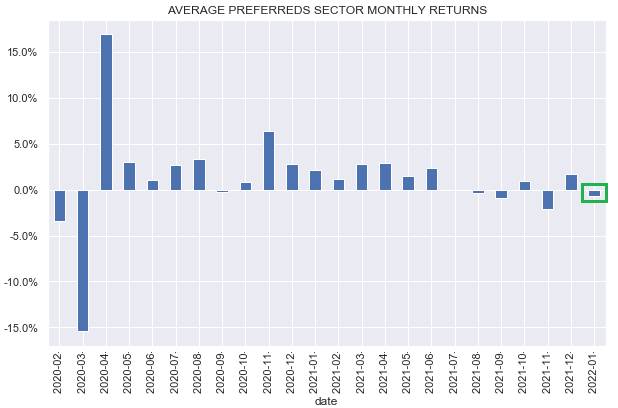
Most of the weakness in the CEF market was due to the widening of discounts – the lack of discounts in preferreds has allowed the sector to remain more resilient as we highlighted in an earlier article comparing the two types of assets.
Market Themes
Investors in senior securities (i.e. preferreds and baby bonds) occasionally have the choice to allocate to either a preferred stock or a bond of the same issuer. Historically, many investors would simply buy the highest-yielding senior security, whether bond or preferred, however, the experience of the COVID drawdown and recent market volatility has made many questions how to think about the risk / reward of going for a bond or a preferred.
To provide some intuition of how investors can think about the risk / reward when allocating to bonds versus term preferreds let’s take a look at the case of the popular CLO Equity CEF Oxford Lane Capital Corp (OXLC). The fund has three term preferreds and two bonds outstanding.
This is how the balance sheet stacked up as of the end of the year.
Systematic Income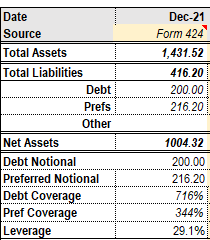
Many investors tend to take the view that there is not a big difference between asset coverage of 200% (for preferreds) and 300% (for debt) in the capital structure so they might as well go for the higher yielding security.
There are three problems with this approach. First, the 200% – 300% rule of thumb doesn’t actually capture the realities of the balance sheet of individual issuers. For instance, in the case of OXLC, debt currently carries asset coverage of 716% while preferreds have asset coverage of 344%. And when preferreds will have coverage of 200% bonds will have coverage of 417%, rather than 300%.
Secondly, as we discussed earlier, asset coverage is not a very useful metric for preferreds because it ignores the relative amounts of debt and preferreds in the capital structure, lumping them together.
And thirdly, focus on asset coverage doesn’t actually provide sufficient intuition to weigh the risk and reward of debt and preferreds, that is, unless you are Rain Man.
A good way to get some intuition about the relative risk/reward between debt and preferreds is to consider how much each type will get in various recovery scenarios on the underlying assets. The two lines below plot the relative payoffs for each. For example, if underlying assets recover 10% (on the x-axis), the debt will be paid off at 72 cents on the dollar (orange line) while the preferreds will get nothing (grey line). On the other hand, if the assets recover 25% then the debt gets paid off in full while the preferreds get 73 cents on the dollar.
Systematic Income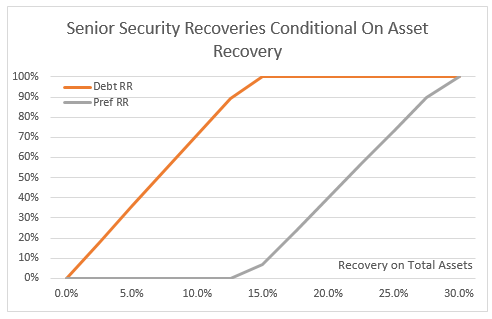
In our view, this kind of analysis is more useful than the traditional focus on asset coverage. Investors can use these payoffs when considering the yield differential on offer across the different types of securities.
Market Commentary
As highlighted previously, the CLO Equity fund Eagle Point Credit Co (ECC) is redeeming the preferred (ECCB), and bonds (ECCY) and (ECCX), the last one partially, on the back of its recent issuance of (ECCV). This should provide a small boost to the fund’s income as it is redeeming securities with coupons of 7.75% (ECCB), 6.75% (ECCY) and 6.6875% (ECCX) and replacing them with one paying 5.375% (ECCV). For the bonds ECCY and ECCX, this is a good example of why it can make sense to tilt to lower-coupon bonds / preferreds among those that are currently callable. ECCX has a slightly lower coupon so it’s only being partially redeemed whereas ECCY, which has a higher coupon, is being fully redeemed.
The two bonds have tended to trade at very similar yields, so investors didn’t give up any yield by tilting to the lower coupon one. Apart from potentially enhancing their call protection due to the tendency of issuers to call their highest-coupon securities first, it also often enhances yield because higher coupon securities often trade at lower yields-to-call (because many low-information investors just go by current yields rather than yields-to-call).
That, obviously, doesn’t always work as issuers sometimes fully redeem multiple bonds / preferreds like when TWO did it a while back. However, in the case of ECC, it does mean that the remaining ECCX shares can squeeze a few more coupons at an attractive risk / reward.
The mREIT preferred sector is one that remains fairly compelling in this environment as it is relatively higher-yielding with many securities featuring yields north of 7% and one that features many different types of coupon profiles which can be handy for investors looking to diversify their interest rate exposure.
For investors specifically concerned about the impact of rising rates on the typically very long-duration preferreds sector some of the fix/float options that should stand up better to higher rates are the New Residential Investment Corp. Series D (NRZ.PD) which resets to the coupon of 5Y Treasury yield (i.e. 5Y CMT) + 6.22% in 2026, currently trading at a 6.97% YTC. The Granite Point Mortgage Trust Series A (GPMT.PA) resets to a coupon of SOFR + 5.83% with a 7% floor in 2026 and is trading at a 6.91% YTC. What’s appealing about this last coupon structure is that the coupon will not fall below the current 7% fixed level but it can also participate in higher short-term rates.
Stance & Takeaways
Our lower beta playbook has worked well in this latest drawdown. Niche sectors, highlighted below, have outperformed the broader income space.
Systematic Income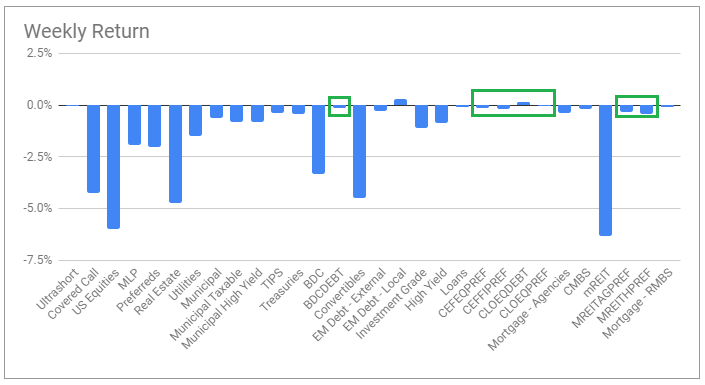
Pinned-to-par securities mostly outperformed in their sectors last week. Overall, out pinned-to-par watchlist on the service delivered a -0.2% return versus a -1% return for the average sector.
Systematic Income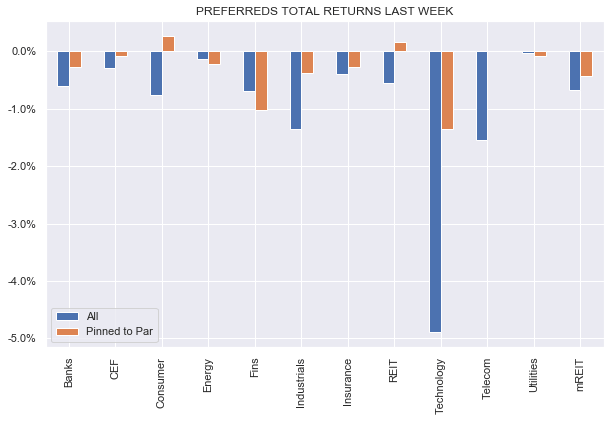
Shorter-maturity securities across both preferreds and bonds outperformed as well, delivering a flat return for the week.
In terms of allocation, we made a recent rotation from the XFLT Series 2026 (XFLT.PA) which dipped to a sub-3% YTC to the mREIT Arlington Asset Investment Corp 2025 bond (AIC) that is currently callable (with no call price risk). This improves the yield profile and lowers duration while maintaining a high quality profile. The traditional low duration go-to of many income portfolios are loans, however, these tend to be relatively low quality, particularly as held by CEFs, with a sweet spot around the single-B area (one rating level ahead of CCC) which is not terribly well-suited for a defensive stance. This means that investors who want to maintain a more defensive posture should consider higher-quality securitized assets such as ABS and MBS as well as shorter-maturity senior debt.
Overall, the recent drawdown has not opened up a huge number of new opportunities as most preferreds sectors are still up over the past month. However, this resilience of the sector does provide one advantage of offering a stable source of capital to reallocate to underperforming parts of the broader income sectors such as CEFs. For example, the chart below shows the performance of the various sleeves of our High Income Portfolio with Preferreds and Baby Bonds wrapped around zero and CEFs underperforming.
Systematic Income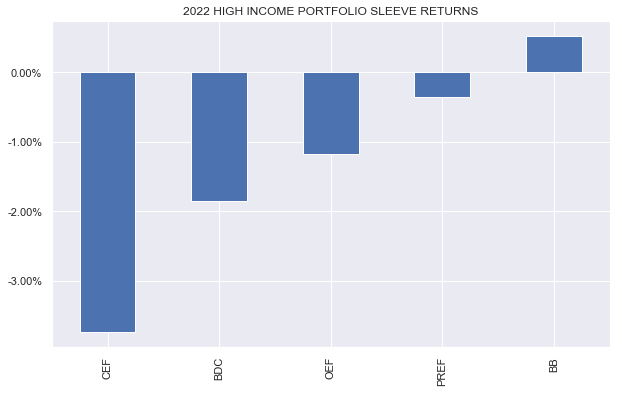
This reallocation between different investment vehicle types can allow investors to take advantage of developing opportunities across the broader income space by moving capital from more stable parts of the portfolio to those offering an improved value proposition. This is a strategy that we have pursued preemptively over the past year in our portfolios by reallocating away from the CEF sleeve towards preferreds and BDCs and it is one that we will be looking to reverse if CEF market weakness continues.
Be the first to comment