

Khanchit Khirisutchalual
As the world emerges from Covid-19, it is interesting to observe Apple (AAPL) and Microsoft (MSFT) as outperformers (in terms of stock price) relative to large cap tech peers. Specifically, I compare against Google (GOOGL), Amazon (AMZN) and Meta (META), with the overarching logic being that they are all platform-based ecosystems.
Yahoo FInance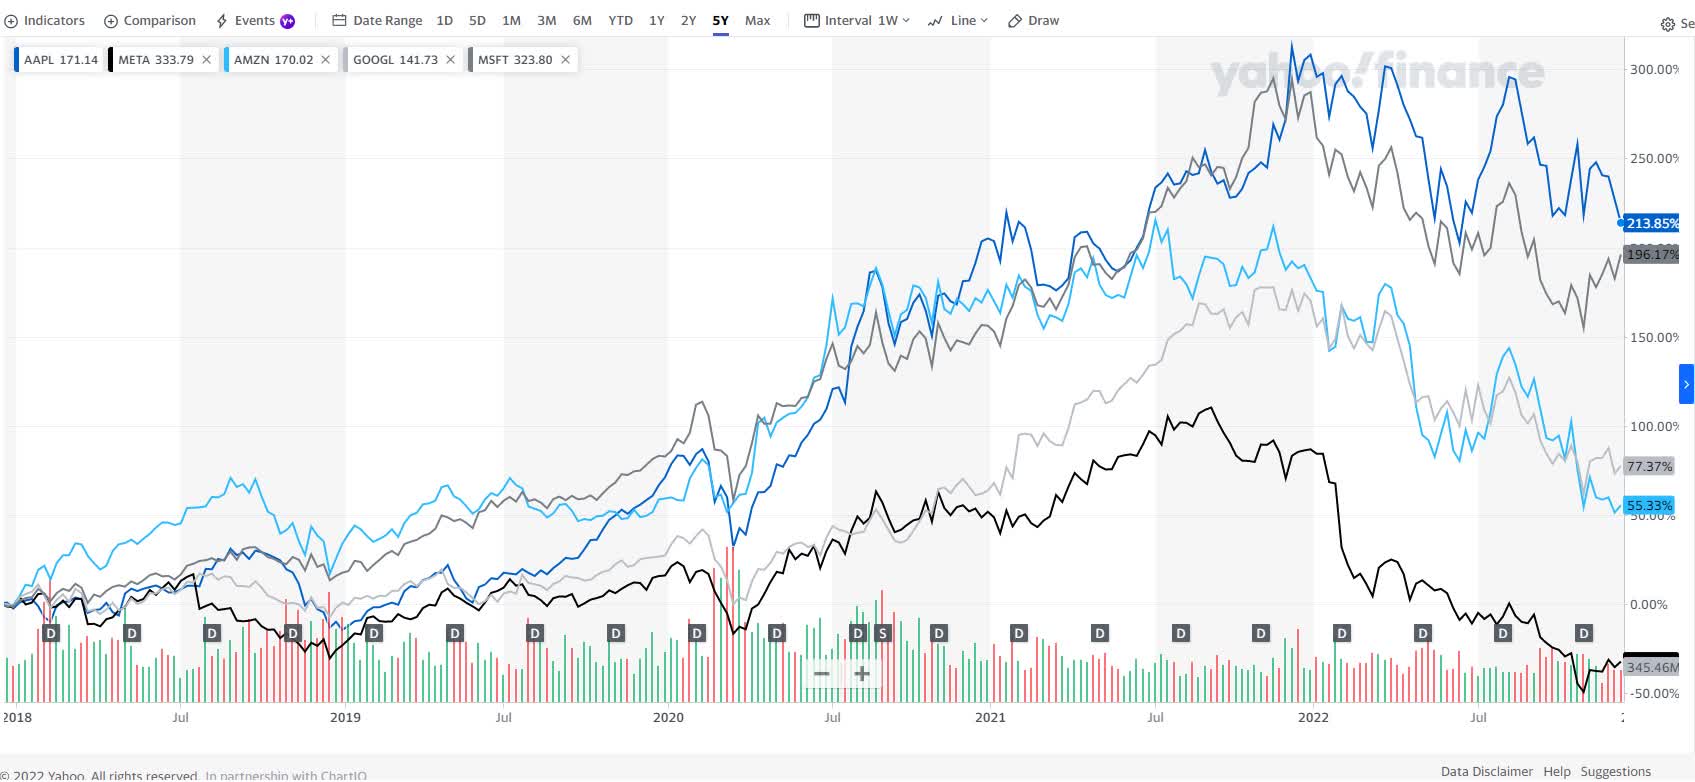
(Note: From best to worst in terms of performance: AAPL, MSFT, GOOGL, AMZN, META)
Given the increasing importance of investment for tech companies in innovating and sustaining growth, this article will take a look at the return on incremental invested capital (“ROIIC”), a measure to determine the effectiveness of capital deployed, of the respective companies mentioned above. I calculate ROIIC using incremental operating income as numerator and the total capex spent on property, plant and equipment, and company acquisitions over the trailing 4 quarters of as denominator.
While all of these companies operate platform-based ecosystems, they certainly do not operate in the same lines of business. The ROIIC exercise highlights very different stories for each company, which makes sense given returns and capital intensity / needs would be subject to different influences external to management effectiveness and other company-controllable factors.
1. AAPL:
In a way, Apple Inc. does not lend itself to ROIIC analysis as well as other companies. While it certainly qualifies as a platform-ecosystem company, Apple derives 80% to 90% of revenue from physical product sales (i.e. iPhones) which stands in contrast to the other companies discussed in this article.
Even though Apple doesn’t manufacture any of its products, from an accounting perspective selling a physical product suggests most expenses would be revenue expenditure (accounted for in profit and loss statement) as opposed to selling a service which would entail a higher proportion of capital expenditure (you would build the tech infrastructure or whatever is needed to provide your service and subsequent monetization is more time-based; in contrast, the mapping of costs to product sales is more one-to-one). Nevertheless, given it is considered one of the closest competitors for both Microsoft and Google, I include it for the sake of completeness.
Capital IQ, author’s own analysis Capital IQ, company filings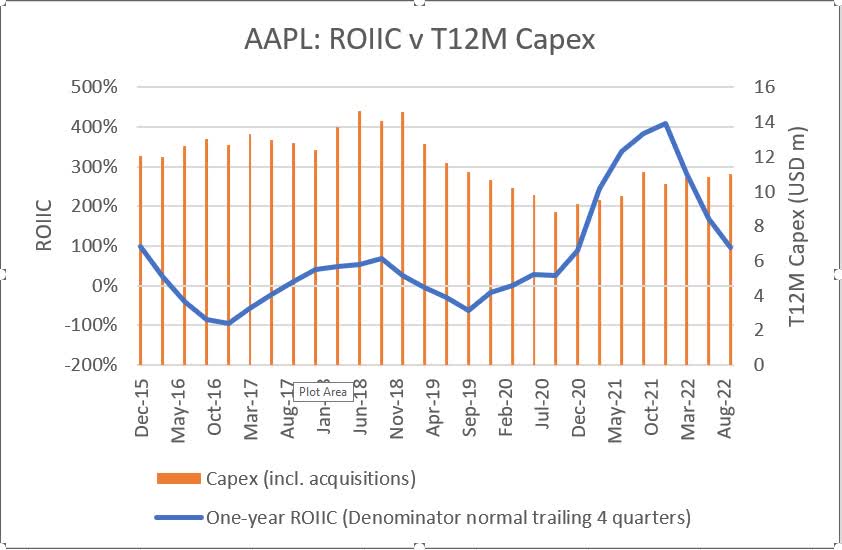
Key observations on AAPL’s ROIIC profile:
- Apple’s trailing 12-month capex is remarkably stable at USD 10m to 14m, without signs of uptick even as the business grows, which is consistent with the revenue expenditure point (that it is capex light and R&D (part of opex) heavy).
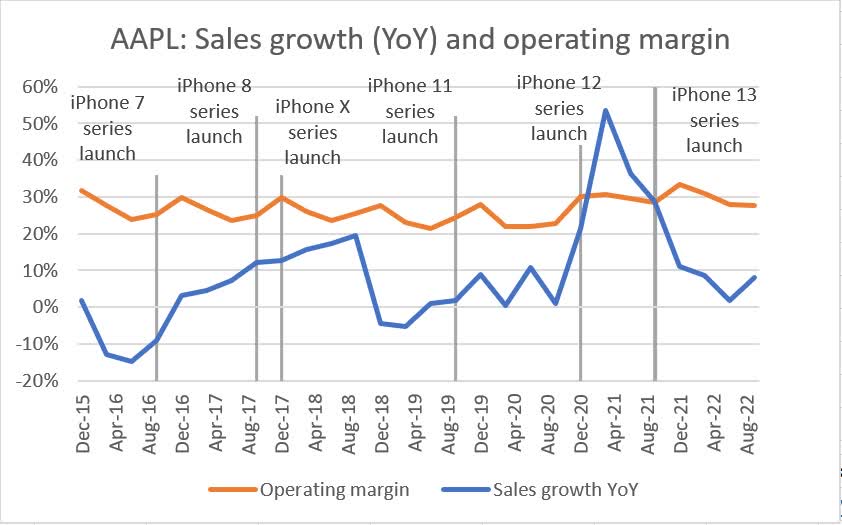
- ROIIC is mathematically a function of sales growth, margin fluctuations and capex. Given the minimal change in capex, and the relatively stable margins, ROIIC is then mostly driven by the pace of growth.
It is interesting to note that Apple’s stock price performed best in the last 5 years out of this batch. A potential explanation is that the current headwinds it faces is supply-side in nature (i.e., production bottlenecks, component shortages etc.) rather than demand driven (i.e., demand for iPhones remain extremely robust), as opposed to peers (e.g. see Microsoft’s Azure below). Intuitively, supply issues are more controllable than demand.
2. MSFT:
Microsoft is a close runner up in terms of 5-year stock price performance with high and stable ROIIC, which serves as testimony to the company’s success in transitioning from a license-based proprietary software model to a services and subscription business model (providing infrastructure-, platform-, and software-as-a-service).
Capital IQ, author’s own analysis Capital IQ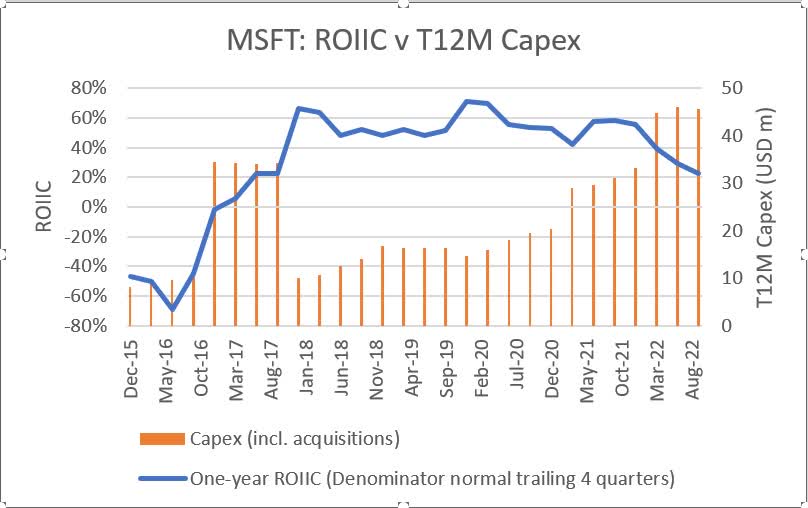
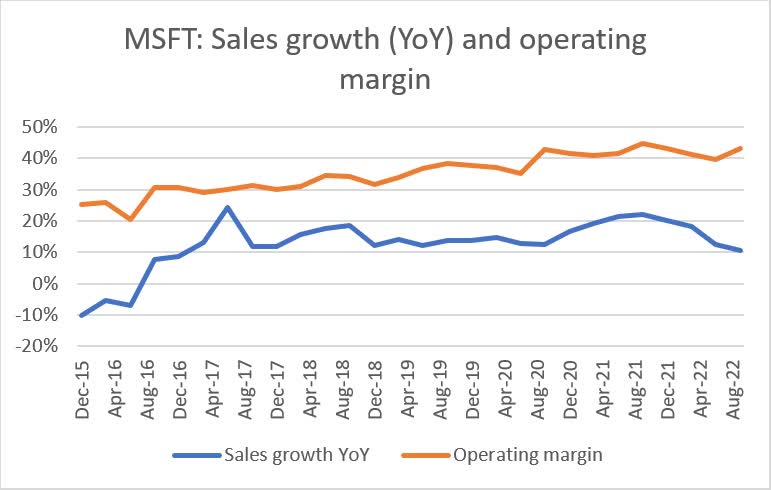
It wasn’t long ago in 2014 to 2016 when the company underwent a major reorganization, involving an overhaul of its engineering/R&D operations to better align with the strategic direction of the company, followed by a restructuring of its sales and marketing teams.
Key observations on MSFT’s ROIIC profile:
- 2017 onwards saw Microsoft’s pivoting efforts pay off, as operating margins increased in tandem with capex edging up, resulting in ROIIC at 50% to 60% from beginning of 2018 through 2021, and has only begun to dip in 2022 due to slowing growth in demand for Azure, which has been driving Microsoft’s resurgence as a technology powerhouse.
- During its earnings call for the most recent quarter ending September 2022, the company sounded a cautious note describing how it has been reaching out proactively to customers and helping them “optimize their workloads” (i.e. help customers run applications and tasks more efficiently at lower costs). The company also guided for cloud segment revenue growth to slow by 5 percentage points this quarter (from 42% in the fiscal first quarter (ending Sep 2022) to 37% in the current quarter (ending Dec 2022)) in constant currency terms and mentioned margin pressure due to high energy costs.
3. GOOGL
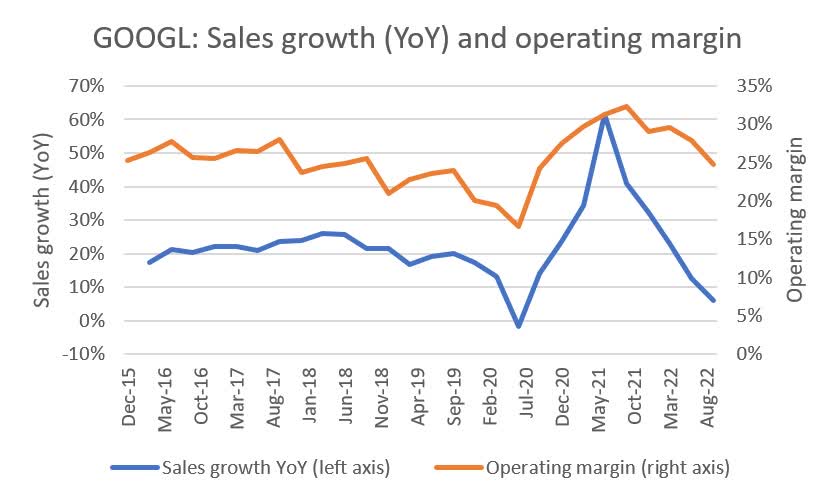
Google’s business model is based on developing and offering free applications, online services and content, and making money by selling third-party advertising. The advertising revenue funds development of products and services provided to users at no or little cost.
Capital IQ, author’s own analysis Capital IQ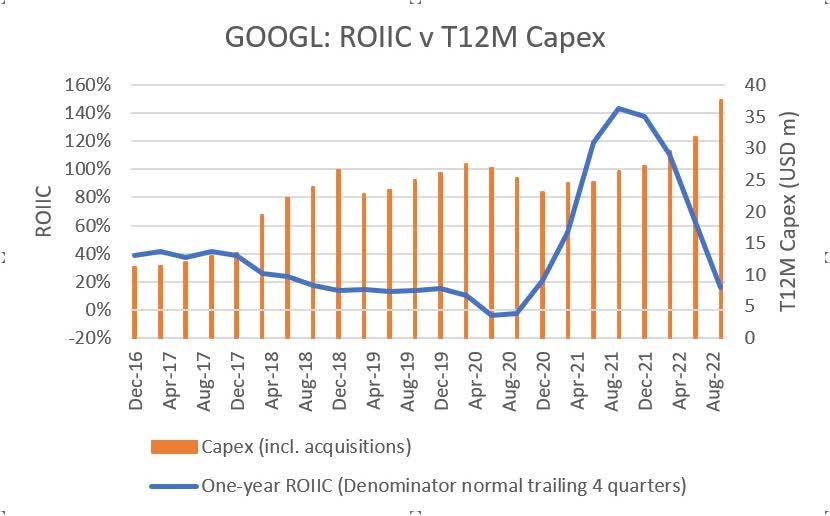
Key observations on GOOGL’s ROIIC profile:
- Google’s capex is characterized by a gradual uptrend as the company grows which is matched by a steady decline in incremental returns generated on that invested capital – at least in the pre-pandemic years.
- The onset of Covid-19 brought considerable volatility to ROIIC. This can be attributed to:
- The surge in online activity during the pandemic, which under revenue models such as cost per click and cost per thousand impressions (as opposed to contract-based revenue models such as Microsoft), results in relatively volatile sales growth movements entering and exiting the pandemic.
- This is compounded by the high degree of operating leverage characteristic of platform ecosystems. Google shows a clear pattern of increase in operating margin when sales growth accelerates and decrease in operating margin when sales growth decelerates. Any acceleration / deceleration in growth is compounded by its effect on margins, making incremental profits (and therefore the numerator of ROIIC) more volatile.
- CFO Ruth Porat’s comments during the earnings call for the quarter ending June 2020 supports the operating leverage point.
- “…much of our expense base, both in cost of revenues and opex, is not directly correlated with changes in revenues. For example, although TAC and content acquisition costs are obviously tied to revenues, there is a sizable percentage of items in Other Cost of Revenues that are generally less variable in nature such as depreciation and operations costs of our technical infrastructure, as well as for activities like customer support and content review.”
4. AMZN
Amazon is the most asset heavy business (due to the warehousing and fulfilment network and to a lesser degree inventory ownership of its e-commerce business) out of all the names covered in this article. This means it has high operating leverage (also quite observable, like Google), but in addition its relatively slim profit margins (operating margin at single digits) means that small fluctuations have a large impact on incremental profits.
Capital IQ, author’s own analysis Capital IQ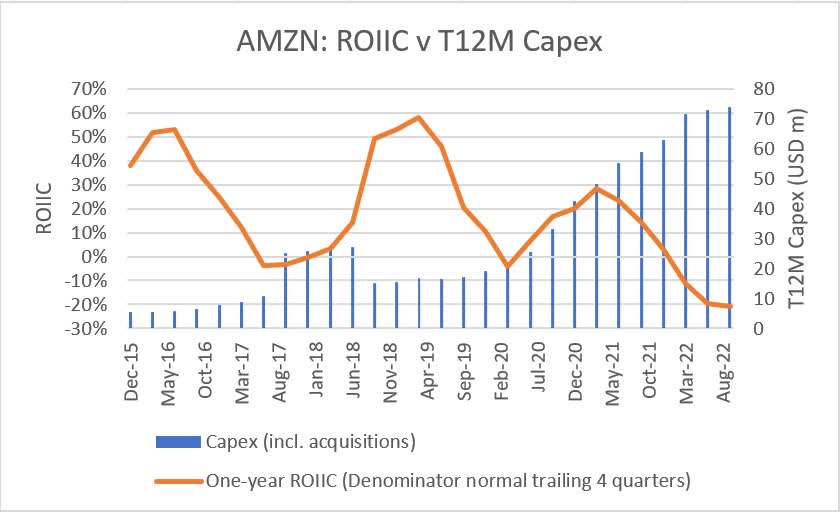
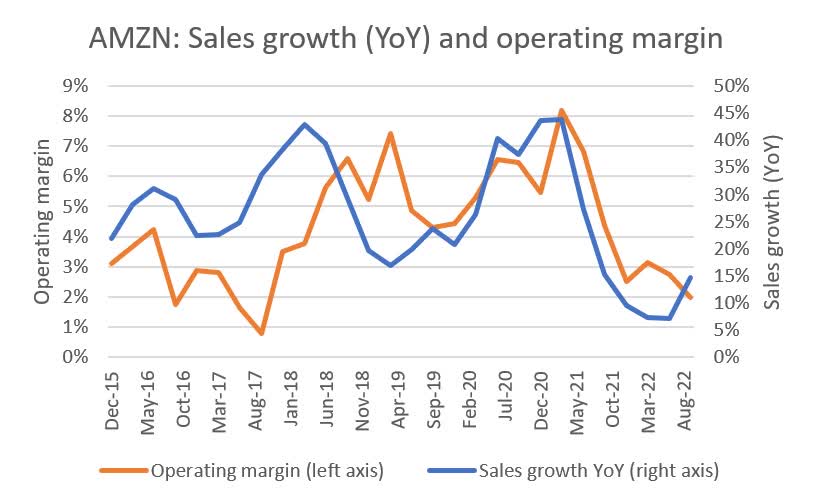
Key observations on AMZN’s ROIIC profile:
There are three dips in Amazon’s historical ROIIC profile – 2017, 2020 and then now.
- 2017: saw a step up in investments towards (i) increasing fulfillment capacity in response to strong growth of the Fulfilment by Amazon (“FBA”) business and (ii) in infrastructure in capital leases in response to the strong growth in AWS, which corresponds to the first trough in the graph.
- 2020: Amazon took decisive actions in response to the pandemic, stepping in to fill the role of traditional brick-and-mortar stores more so than before amidst lockdowns, as people started ordering everyday / household and staple items online. This includes hiring more people (and at higher rates) to handle surging volumes, as well as implementing Covid prevention measures to ensure a safe working environment for employees.
- During its earnings call for the quarter ending March 2020, CFO Brian Olsavsky said “customer demand remains high, the incremental revenue we are seeing on many of the lower ASP essential products is basically coming at cost. We’ve invested more than $600 million in COVID-related costs in Q1 and expect these costs could grow to $4 billion or more in Q2. These include productivity headwinds in our facilities as we provide for social distancing and allow for the ramp up of new employees, investments in personal protective equipment for employees, enhanced cleaning of our facilities, higher wages for our hourly teams…”
- As incremental revenue dollars earned were coming at higher expense, this depresses incremental profit (and is borne out in the ROIIC graph).
- 2022: The latest slide in ROIIC is a double whammy from (i) externally driven costs, namely intensifying inflationary pressures and (ii) internally controllable costs, primarily productivity and fixed cost deleverage (i.e., exiting the pandemic, AMZN quickly found itself going from an understaffed to overstaffed position, resulting in lower productivity).
5. META
Last and perhaps most controversial out of the five names is Meta. Meta has continuously made bets outside of social media (e.g. in VR/AR in 2014/2015, then in developing its own cryptocurrency Diem (formerly Libra)) but struggled to convert them into anything more meaningful.
Capital IQ, author’s own analysis Capital IQ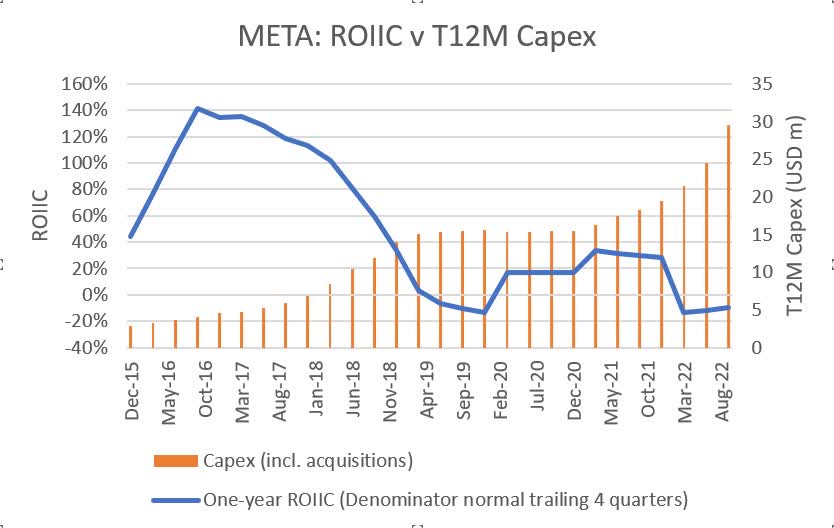
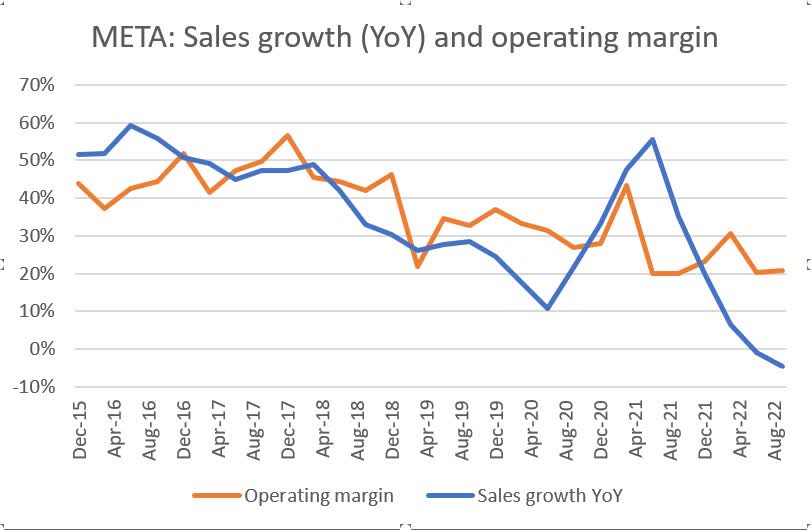
Key observations on META’s ROIIC profile:
The maturing of its core social media businesses and lack of substantial new growth pillars was compounded by the the Cambridge Analytica episode (when Facebook allegedly allowed millions of its users’ personal information to be fed to Cambridge Analytica, who misused that personal data to micro-target and manipulate swing voters in the 2016 US presidential election) which triggered a round of heavy investment in data privacy and cyber security by Facebook.
- 2018: According to Mark Zuckerberg on the earnings call for the quarter ending June 2018, the company was “investing so much in security that it will significantly impact our profitability. We’re starting to see that this quarter.”
- 2019: ROIIC hit lows in 2019 when the episode culminated in Facebook paying a $5.0 billion fine to the US Federal Trade Commission (“FTC”), a settlement amount agreed in 2019 and reflected in 2019 general and administrative expenses (even though actions under probe occurred in 2016).
- 2022: Meta’s latest initiative is the metaverse, or more specifically, to help “bring the metaverse (defined as “an embodied internet where people have immersive experiences beyond two-dimensional screens”) to life”. Investments in the relevant business unit, Reality Labs (which is responsible for the company’s augmented and virtual reality products), is creating a material drag1 on profitability and ROIIC.
1 Investments in Reality Labs reduced 2021 overall operating profit by approximately $10 billion, according to the company’s 10-K for the fiscal year ending December 2021, and guidance was for investment amounts to increase in future periods.
Closing Remarks
Companies need to invest (and, for tech companies, innovate) to keep growing. The fierce competition is additional cause for tech companies to reinvest instead of distributing cash back to shareholders. Investing under diminishing returns is common (perhaps even inevitable) and investing despite negative returns has always been more easily forgiven for tech players. We examined various ROIIC profiles above – high and stable, volatile, declining, and even some not-as-meaningful profiles, but at the end of the day, ROIIC strives to answer basic questions such as “How is this company deploying capital?”, “How does that weave into its business model?”, “Is it efficient?”.
Be the first to comment