

BD Images
Introduction
Houston, Texas-based Phillips 66 (NYSE:PSX) released its second quarter of 2022 on July 29, 2022.
Note: This article is an update to my article published on February 23, 2022. I have followed PSX on Seeking Alpha since December 2018.
1 – 2Q22 Snapshot
The company reported second-quarter 2022 adjusted earnings per share of $6.77 from $0.77 a year ago, beating analysts’ expectations.
Quarterly revenues totaled $49,309 million, up from the year-ago quarter’s $21,927 million.
PSX 2Q22 highlights (PSX Presentation)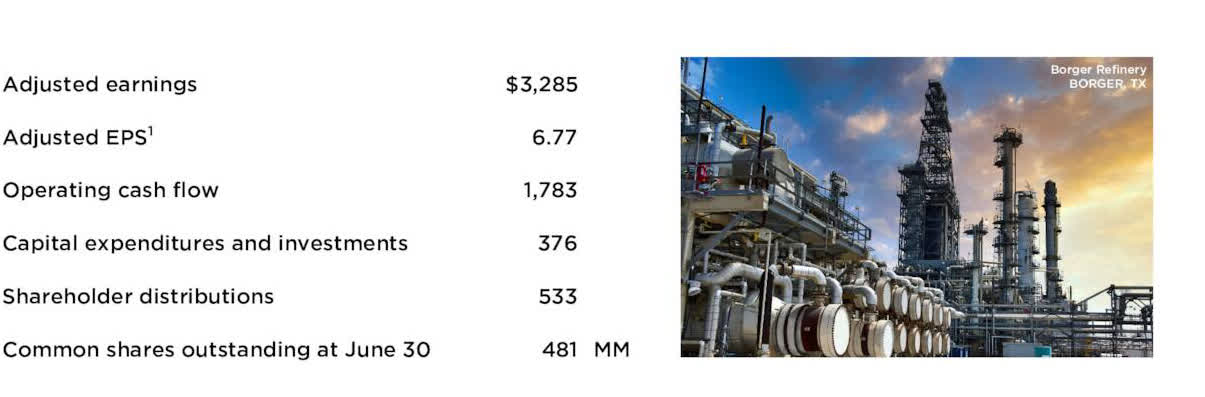
The solid quarterly results increased from higher refining margins worldwide.
2 – Business description
Phillips 66 operates in four segments (Midstream, Chemical, Refining, and Marketing). Below are the quarterly earnings per segment:
PSX Quarterly revenues per segment in 2Q22 (Fun Trading)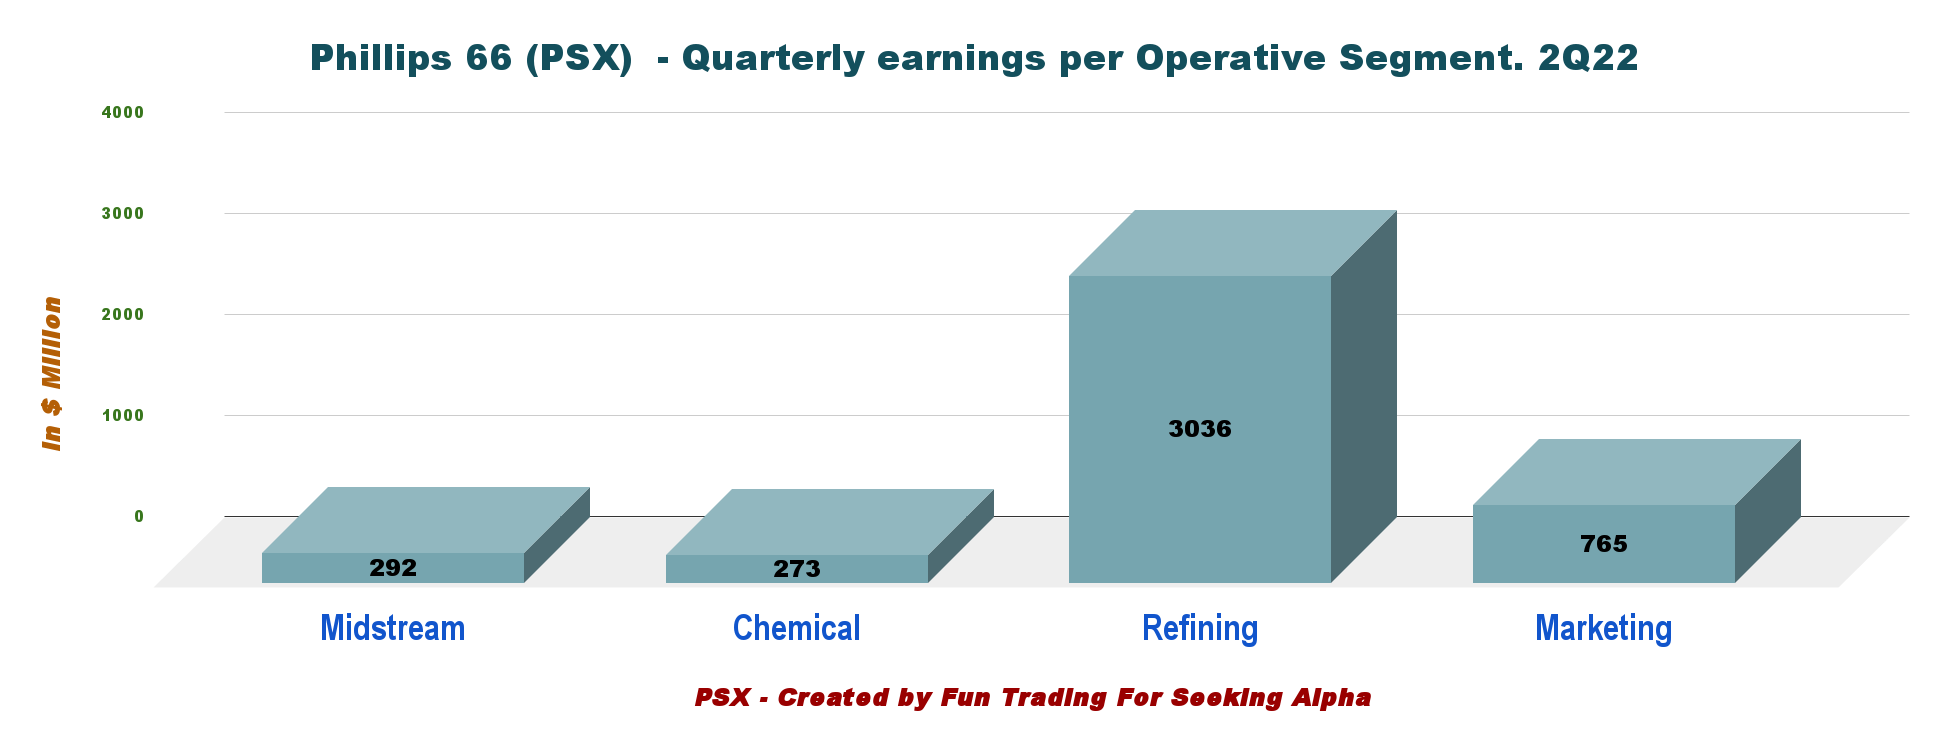
I am covering three refiners on Seeking Alpha. Phillips 66, Marathon Petroleum (NYSE:MPC), and Valero Energy (NYSE:VLO).
You can read my recent article on MPC by clicking here.
3 – Stock performance
Let’s see how these three refiner stocks are doing compared to the VanEck Vectors Oil Refiners ETF (NYSEARCA:CRAK). Below is the year-to-date chart comparison using my three selected refiners and the VanEck Oil Refiner ETF.
As we can see, PSX has underperformed its peers. PSX is up 24% on a one-year basis, well below MPC and VLO.
PSX Chart comparison PSX, MPC, VLO, CRAK (Ycharts)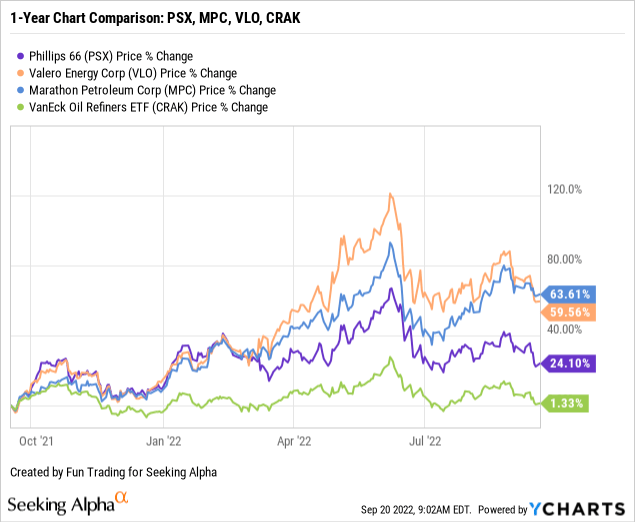
4 – Investment Thesis
The investment thesis has been constant for years. Investors should view the stock as a long-term investment, and a continuous accumulation is still the best alternative.
However, the third quarter will probably show a normalization in progress from extremely favorable margins experienced in the second quarter to a more reasonable pace as we advance. The Fed’s action on interest rates to fight rampant inflation will likely aggravate this situation. Thus, use caution and do not overspend.
The crucial issue here is the extreme volatility, which requires a particular trading/investing strategy that I promote in my marketplace, “The gold and oil corner.”
It is essential to trade short-term LIFO and profit from the wild fluctuations attached to this cyclical industry. I recommend using short-term about 40% of your position and keeping a core long-term for a much higher target or enjoying a steady stream of dividends. PSX pays a dividend yield of 4.66%, which is excellent.
PSX dividend comparison (Fun Trading)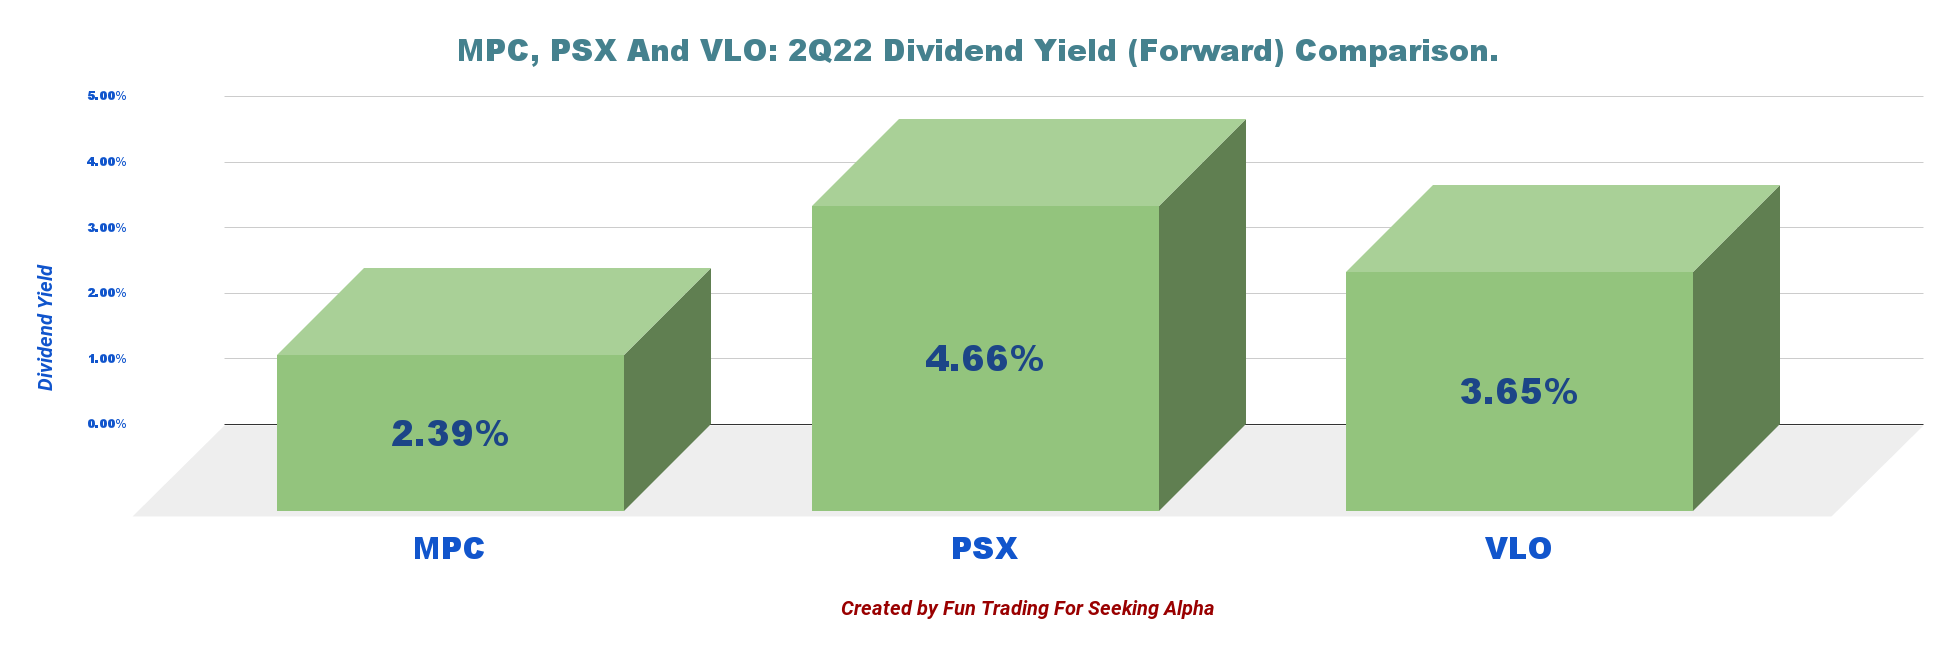
The third quarter is coming fast and will be announced on November 1, 2022.
Financials History: The Raw Numbers – Second-Quarter 2022
| Phillips 66 | 2Q21 | 3Q21 | 4Q21 | 1Q22 | 2Q22 |
| Total revenues and other | 27.00 | 30.24 | 32.60 | 36.18 | 48.58 |
| Revenues in $ Billion | 27.89 | 31.47 | 33.57 | 36.72 | 49.31 |
| Net income in $ Million | 296 | 402 | 1,271 | 582 | 3,167 |
| EBITDA $ Million | 949 | 966 | 2,298 | 1,307 | 4,604 |
| EPS diluted in $/share | 0.66 | 0.91 | 2.88 | 1.29 | 6.53 |
| Operating cash flow in $ Million | 1,743 | 2,203 | 1,800 | 1,136 | 1,783 |
| CapEx in $ Million | 380 | 552 | 597 | 370 | 376 |
| Free Cash Flow in $ Million | 1,363 | 1,651 | 1,203 | 766 | 1,407 |
| Total cash $ million | 2,207 | 2,897 | 3,147 | 3,335 | 2,809 |
| Total LT Debt in $ million | 15,413 | 14,910 | 14,448 | 14,434 | 12,969 |
| Dividend per share in $ | 0.90 | 0.90 | 0.92 | 0.97 | 0.97 |
| Shares Outstanding (Diluted) in Million | 440.4 | 440.4 | 440.7 | 450.01 | 485.04 |
Source: Company filing
Analysis: Revenues, Earnings Details, Free Cash Flow, Net Debt, And Outlook
1 – Revenues were $49.309 billion in 2Q22
PSX Quarterly revenues history (Fun Trading)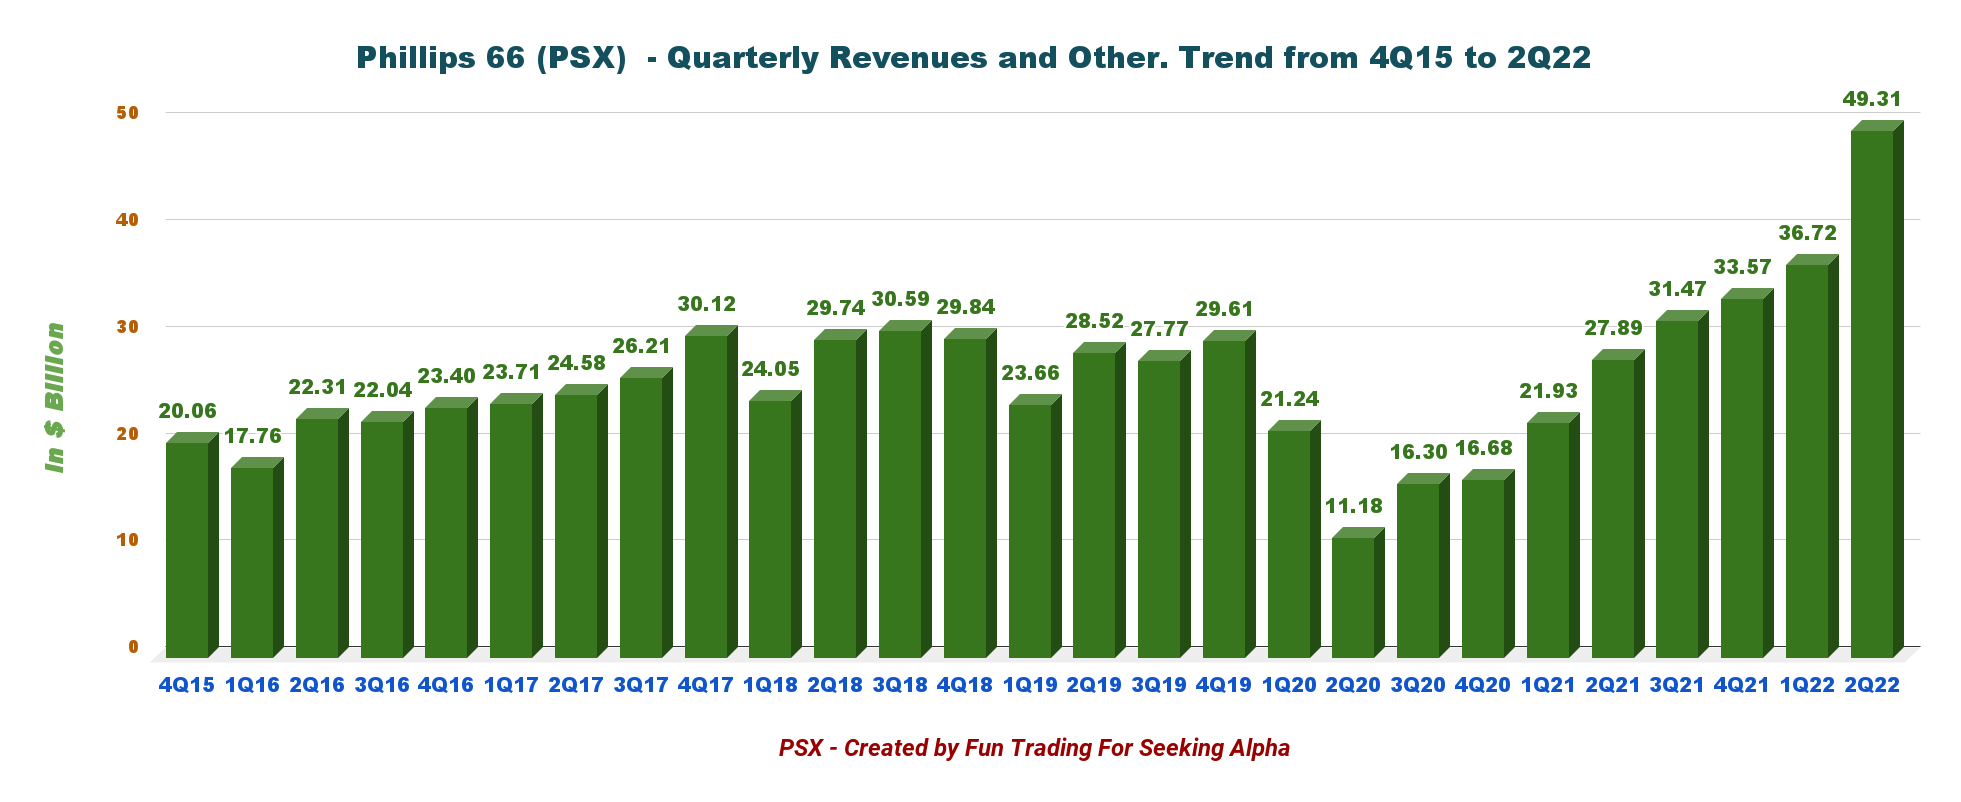
Phillips 66 posted a second-quarter 2022 income of $3,167 million or $6.53 per share. The second quarter’s total costs and expenses rose to $45,203 million from $27,449 million in the same quarter a year ago.
1.1 – Midstream: The company generated adjusted quarterly pre-tax earnings of $292 million, down from $316 million in 2Q21. Lower contributions from transportation weakened the segment.
1.2 – Chemicals: The segment generated adjusted pre-tax earnings of $273 million, down from $657 million in 2Q21. PSX experienced lower contributions from the olefins and polyolefins businesses.
1.3 – Refining: PSX reported an adjusted pre-tax income of $3,132 million compared with $706 million in 2Q21. The segment experienced increased volumes and realized margins.
PSX Quarterly margins per region 2Q22 (Fun Trading)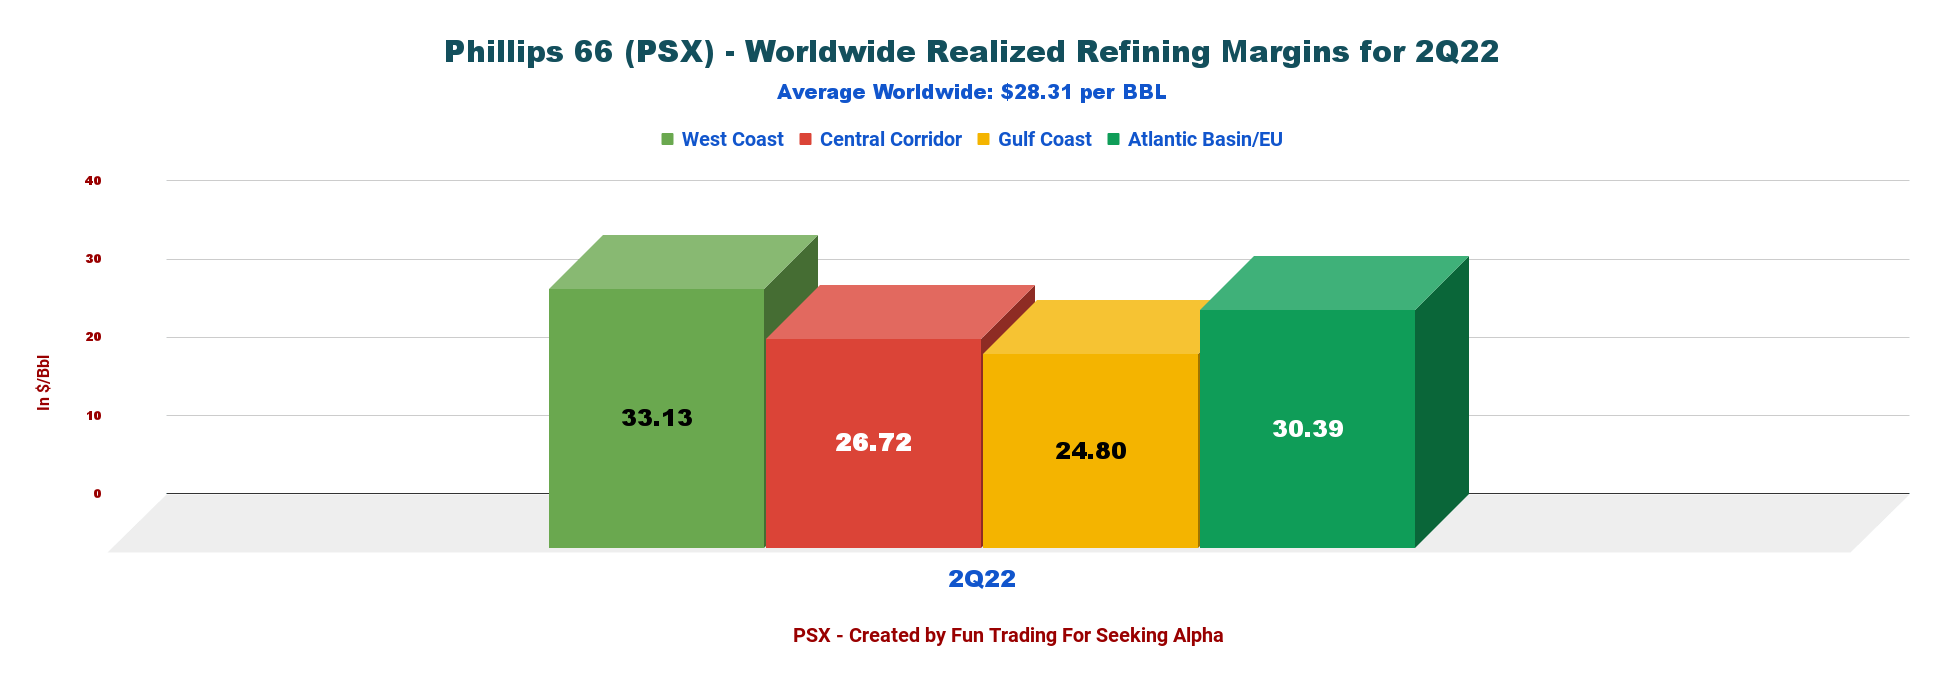
| $/bbl | 2Q21 | 3Q21 | 4Q21 | 1Q22 | 2Q22 |
| West Coast | 3.37 | 7.46 | 15.41 | 17.68 | 33.13 |
| Central Corridor | 6.40 | 12.47 | 12.60 | 7.89 | 26.72 |
| Gulf Coast | 2.10 | 5.75 | 9.19 | 7.71 | 24.80 |
| Atlantic Basin/EU | 4.63 | 9.27 | 11.00 | 11.71 | 30.39 |
| Worldwide | 3.92 | 8.57 | 11.60 | 10.55 | 28.31 |
Source: Fun Trading file.
1.4 – Marketing and Specialties: Pre-tax earnings also dropped to $765 million from $479 million in 2Q21. Realized marketing fuel margins in the USA rose to $3.24/barrel, up from the year-ago quarter of $2.62. The company posted $8.20/barrel in the international markets, up significantly from the year-ago level of $2.89.
1.5 – Outlook 3Q22
PSX Outlook 3Q22 (PSX Presentation) Note: At the Sweeny Hub, the Frac 4 startup is expected late in the third quarter of 2022, adding 150,000 BPD capacity. The total project cost is expected to be approximately $525 million. Upon completion, total Sweeny Hub fractionation capacity will be 550,000 BPD. The fractionators are supported by long-term commitments (press release). 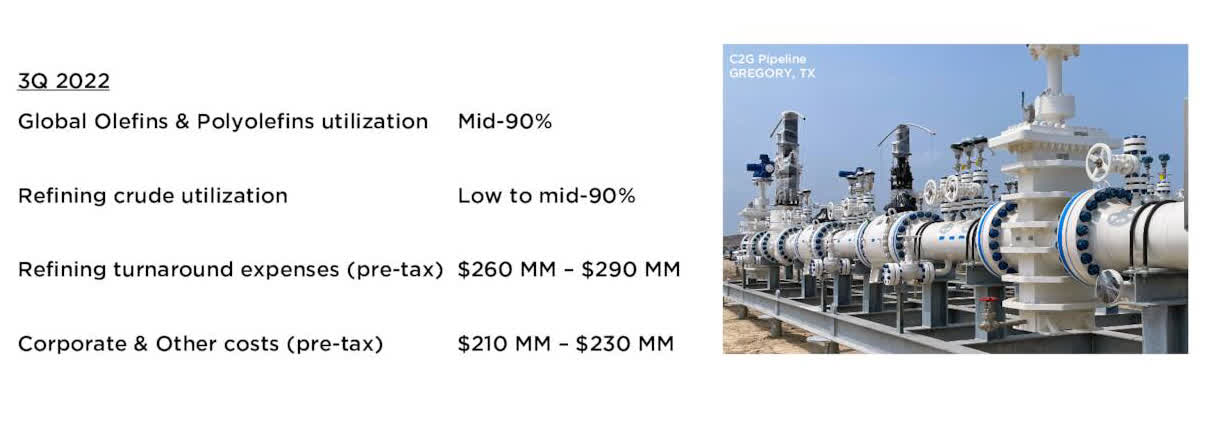
1.6 – Pending acquisition bid for DCP Midstream (DCP)
On August 17, 2022, Phillips 66 announced that it made an offer to Acquire Outstanding Publicly Held Common Units of DCP Midstream, LP.
Phillips 66 also announced today it has submitted a non-binding proposal to the board of directors of the general partner of DCP Midstream offering to acquire all publicly held common units of DCP Midstream for cash. Subject to negotiation and execution of a definitive agreement, Phillips 66 is proposing consideration of $34.75 for each outstanding publicly-held common unit of DCP Midstream as part of a transaction that would be structured as a merger of DCP Midstream with an indirect subsidiary of Phillips 66 with DCP Midstream as the surviving entity.
PSX Ycharts PSX DCP comparison (Ycharts)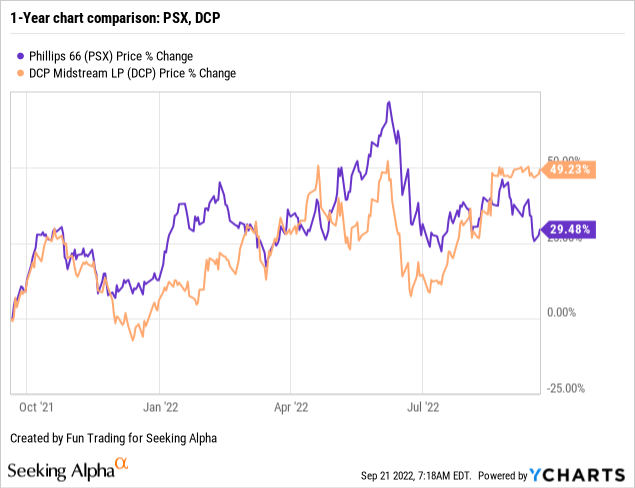
It is still too early to talk about the deal in detail. However, what is vital here is that PSX reveals a new strategy to diversify away from Refining to expand its Chemicals and Midstream segments to generate more free cash flow. However, the question, as always, is at what price for shareholders?
In general, such deals are turning instantly adverse to “acquiring” shareholders and benefitting the “acquired” shareholders. We can see in the chart above that it has been the case here.
2 – Free cash flow was $1,407 million in 2Q22
PSX Quarterly Free cash flow history (Fun Trading)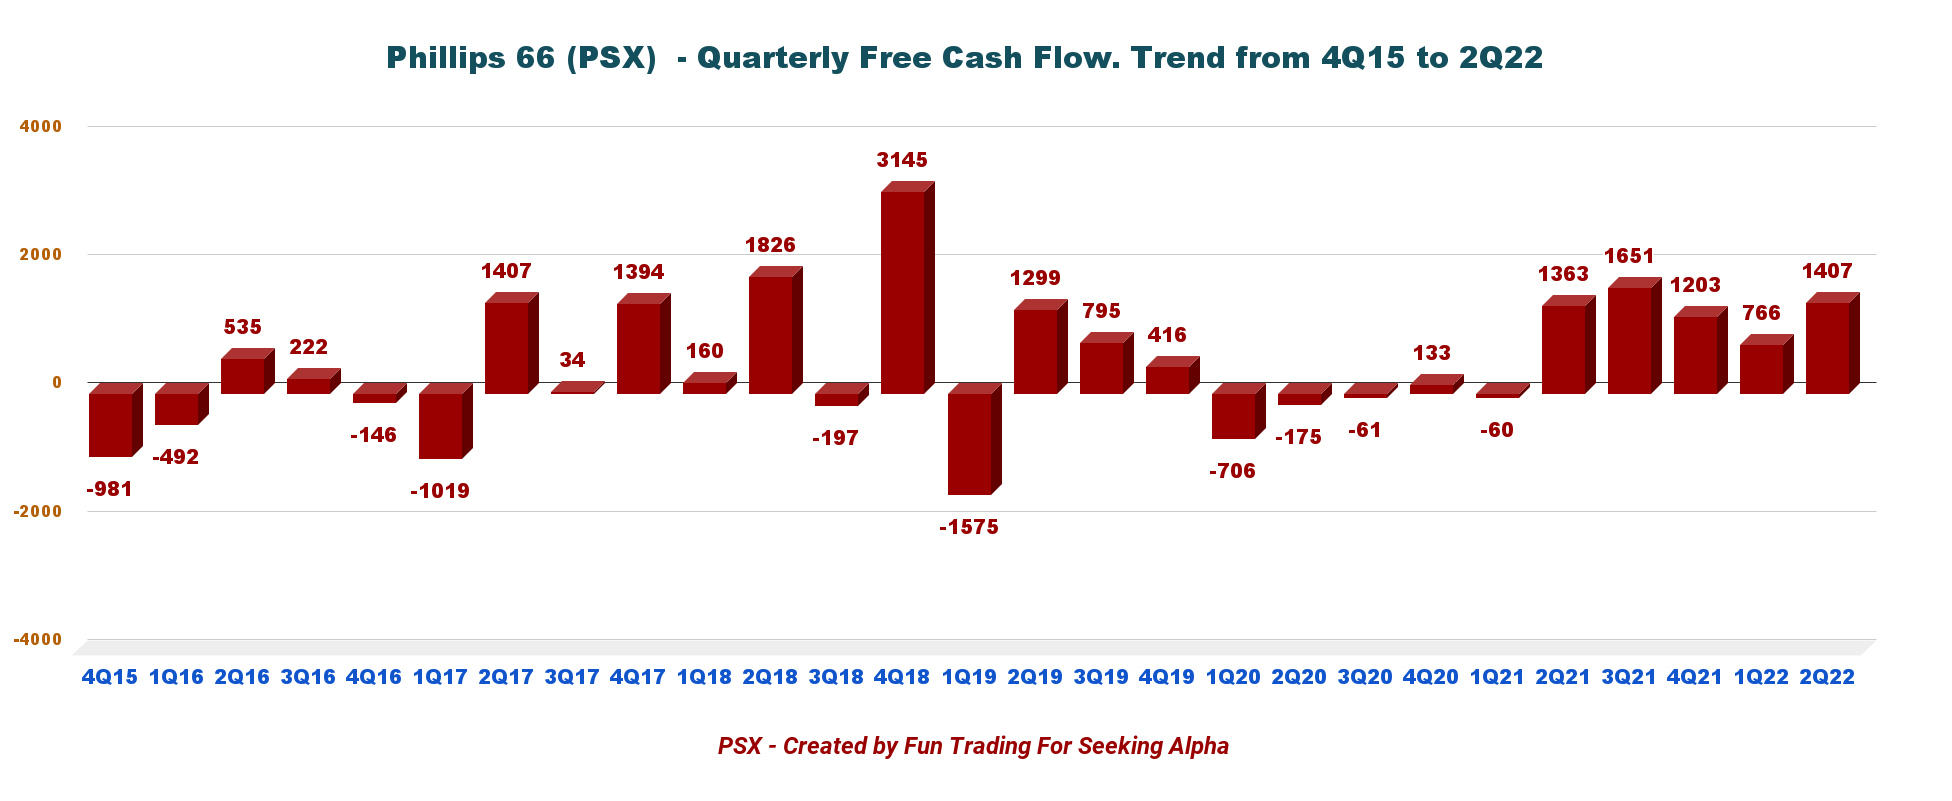
Note: Generic free cash flow is cash from operating activities minus CapEx.
FCF trailing twelve-month (“ttm”) was $5,027 million. The second quarter was $1,407 million.
The quarterly dividend is now $0.97 per share, or a yield of 4.66%. Also, PSX is repurchasing shares and bought $66 million worth of PSX shares in 2Q22. However, the shares outstanding diluted have increased significantly this quarter and reached 485.04 million, up 7.8% sequentially.
3 – Net debt (consolidated)
PSX Quarterly Cash versus Debt history (Fun Trading)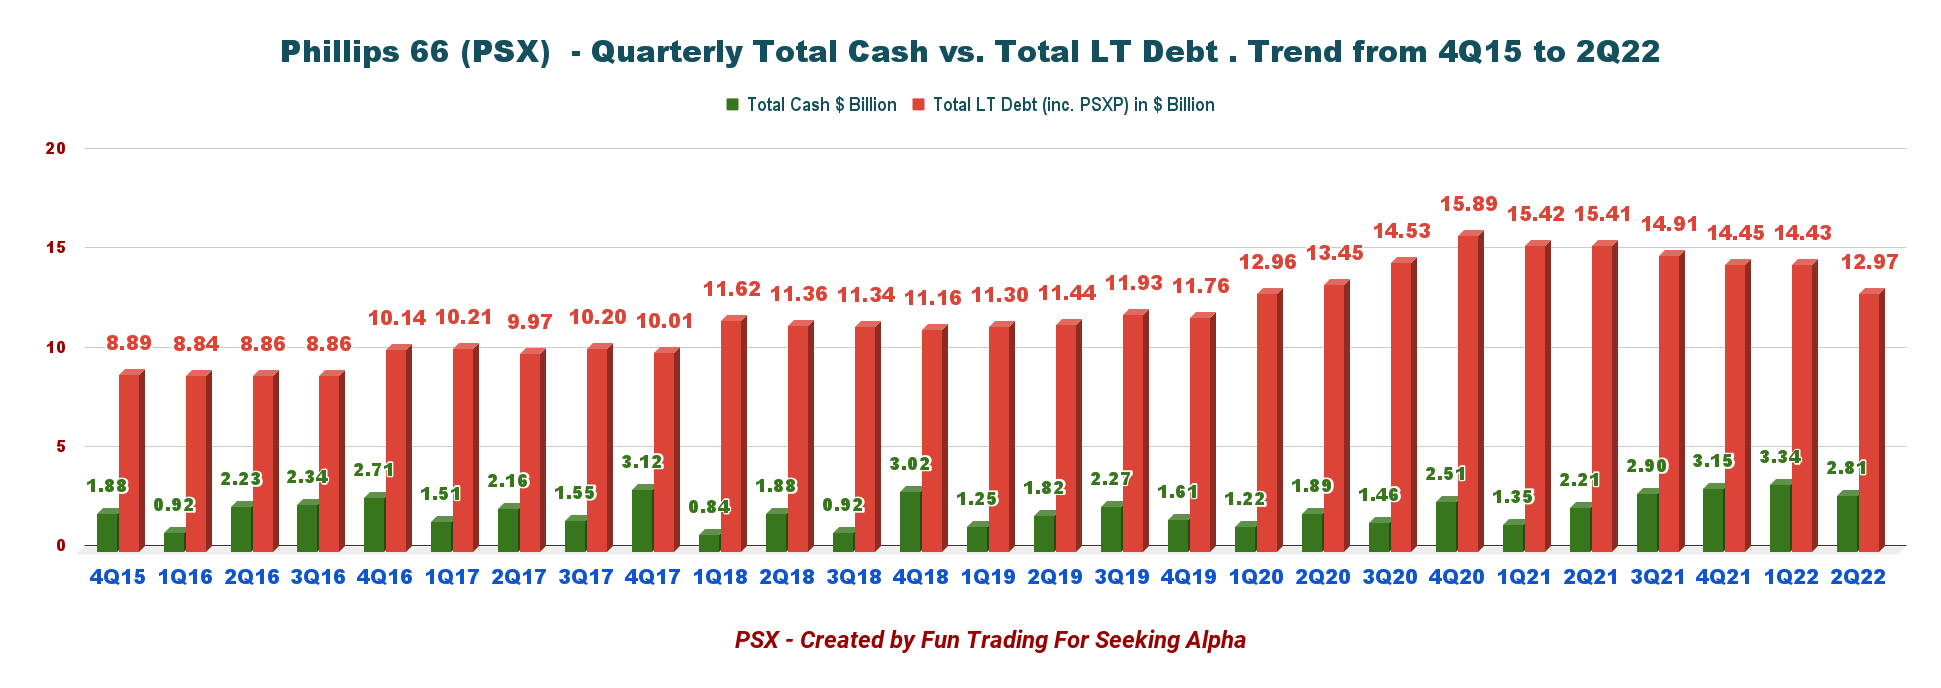
Consolidated debt was $12.969 billion, with a debt to capitalization of 35%. As of June 30, 2022, cash and cash equivalents were $2.809 billion.
The total liquidity of the company was $7.8 billion.
PSX Debt details (PSX Presentation)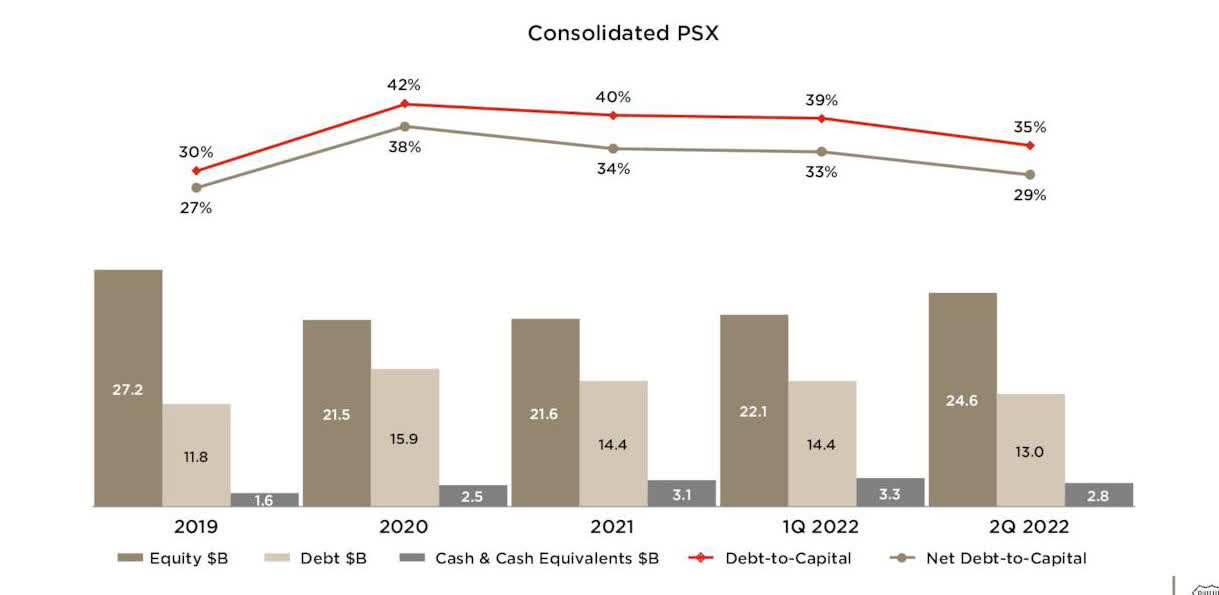
Technical Analysis (short term) and commentary
PSX TA Chart short-term (Fun Trading StockCharts)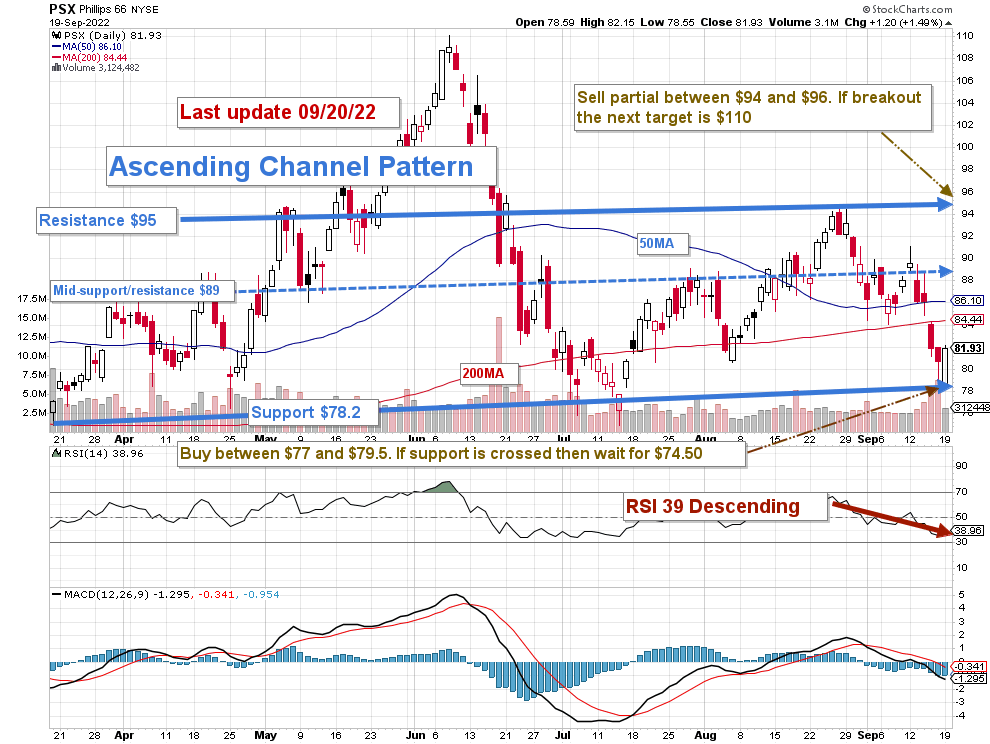
Note: The chart is adjusted from the dividend.
PSX forms an ascending channel pattern with resistance at $95 and support at $78.2.
I recommend trading short-term LIFO for about 40% of your total position and keeping your core position for a much higher target while enjoying a substantial dividend of 4.38%.
I recommend selling between $94 and $96 and accumulating again between $77 and $79.5 with potential lower support at $74.50.
Note: The LIFO method is prohibited under International Financial Reporting Standards (IFRS), though it is permitted in the United States by Generally Accepted Accounting Principles (GAAP). Therefore, only US traders can apply this method. Those who cannot trade LIFO can use an alternative by setting two different accounts for the same stock, one for the long-term and one for short-term trading.
Warning: The TA chart must be updated frequently to be relevant. It is what I am doing in my stock tracker. The chart above has a possible validity of about a week. Remember, the TA chart is a tool only to help you adopt the right strategy. It is not a way to foresee the future. No one and nothing can.
Author’s note: If you find value in this article and would like to encourage such continued efforts, please click the “Like” button below to vote for support. Thanks.
Be the first to comment