

Marc Dufresne
This is an article part of an ongoing primer series on great and undercovered companies at attractive valuations. These pieces will provide in-depth analysis of business models, financials and valuations. All figures in US dollars, unless otherwise noted.
Introduction
Patrick Industries (NASDAQ:PATK) is a US manufacturer and distributor of components for the following four industries: recreational vehicles (RVs), marine, manufactured housing (MH), and industrial. PATK was founded in 1959 to manufacture components for the MH industry, and until 2007 that was basically the only business of the company. In 2007, PATK acquired Adorn Holdings, an Indiana-based manufacturer and supplier of interior components (laminated wall paneling, cabinet doors and other interior components) for RVs, diversifying thus PATK’s revenues. Since then, PATK has become a textbook case study of massive wealth creation for shareholders through a very aggressive (and extremely well-executed) M&A policy that has diversified PATK’s revenue streams even more. The share price has recently fallen because PATK’s end markets were clear beneficiaries from Covid, due to the inability of many Americans to travel abroad. Actually, the stock price is below the levels it reached five years ago, even though PATK has kept compounding value during these years, being now a much more valuable company than back then.
The main point of the thesis can be summarized as follows:
- PATK’s end markets (RVs, powerboats, and MHs) are niche, cyclical markets, with stable oligopolistic structures, and no competition from abroad. In the case of the RV and powerboat industries, both end markets have delivered long and consistent track-records of solid value creation for shareholders.
- The manufacturing process of components is not highly automated, so economies of scale from higher production levels are modest, at best. On the other hand, the sheer number of different products manufactured by PATK makes OEMs reluctant to switch suppliers. OEMs operate with just-in-time inventories and lean cost structures, so any delays in the supply chain may have outsize effects on their profitability.
- PATK’s track record in M&A has been phenomenal, with a string of bolt-on acquisitions in adjacent products and entering new markets. Just for the audio products in the marine segment, management has indicated a further $3-5bn deal opportunity.
- PATK’s valuation is very compelling. At $57 per share, the company has an EV of roughly $2.5bn, which implies EV/NOA 2Q’22 and EV/NOI LTM multiples of 1.1x and 6.3x, respectively. [1] On a levered basis, PATK trades at 1.5x P/BV and a 3.8x P/E. Given that PATK’s average return on net operating assets (RNOA) has been around 18% over the last decade (ROE of 34.5%), and that it has been growing economic earnings (earnings after the cost of capital) at a healthy clip, the level of discount is too large to ignore it. [2] An 8% (EV) discount rate and a 2% growth rate in residual earnings, assuming much lower future RNOAs (13%), would yield a target price of $130, implying equity returns of 17% at perpetuity.
PATK’s history
As previously mentioned, PATK was founded in 1959 to manufacture components for the manufactured housing industry, became public in 1968, and until 2007 that was basically the only business of the company. The years from 2001 to 2007 were very difficult for PATK. For instance, in 2001 over half of the company’s sales came from MH, an industry that suffered a deep crisis during that period. In 2007, PATK acquired Adorn Holdings, an Indiana-based manufacturer and supplier of interior components (such as laminated wall paneling and cabinet doors) for RVs, diversifying thus PATK’s revenues. The acquisition also brought on board Todd Cleveland, who was Adorn’s CEO (he had been with Adorn for 17 years), and who would become PATK’s COO in 2007 and CEO in 2009. Since then, PATK has become a classic textbook case study of massive wealth creation for shareholders through a very aggressive, and extremely well executed, M&A policy, which has diversified PATK’s revenue streams in two additional verticals (marine and industrial).
PATK’s acquisitions over the last decade have been numerous, so I have decided to highlight the most relevant and recent milestones as follows:
- 2014 (June): PATK acquires Precision Painting, an Indiana-based business with three full service exterior full body painting operations that also offer interior refurbishing and painting for both OEMs and existing fleet owners. Purchase price was undisclosed, and Precision Painting’s ’14 revenues were $28M.
- 2014 (June): it acquires Foremost Fabricators, an Indiana-based fabricator and distributor of fabricated aluminium products, fiber reinforced polyester sheet and coil, and custom laminated products primarily used in the RV market. Purchase price was undisclosed, and Foremost’s ’14 revenues were $75M.
- 2015 (February): it acquires Better Way Partners, an Indiana-based manufacturer of fiberglass components primarily used in the RV, marine and transit vehicle markets. Purchase price was undisclosed, and Better Way’s revenues for 2015 were $50M.
- 2015 (September): it acquires North American Forest Products, a Michigan-based manufacturer of major manufacturer and distributor, primarily for the RV industry, of profile wraps, custom moldings, laminated panels and molding products, as well as panels, trusses, bow trusses, and industrial packaging materials. Purchase price was $85M, and North American’s LTM revenues were $165M.
- 2017 (May): it acquires Leisure Product Enterprises, a Florida-based company that designs, engineers, and manufactures CNC plugs, composite molds (open and closed), and CNC molds for fiberglass boat manufacturers. It also produces gelcoat and fiberglass parts and assemblies for both the marine and industrial markets. Purchase price was $73.5M, and LPE’s ’16 revenues were $75M.
- 2017 (November): it acquires Indiana Transport, an Indiana-based transportation and logistics service provider primarily to OEMs and dealers in the RV market (it utilizes independently contracted drivers to haul travel trailers, fifth wheels, gooseneck trailers and utility trailers from RV OEM plants to dealer lots across the country). In addition, over the last several years, Indiana Transport had expanded its service offerings to include the transportation of recreational watercraft. Indiana’s ’17 revenues were expected to be $100M, and purchase price was undisclosed.
- 2017 (November): it acquires LMI, a California-based designer, fabricator, and installer of specialty glass, mirror, bath and closet building products to residential housing and commercial high-rise builders, general contractors, retailers, and RV markets. Purchase price was 81M, and LMI’s ’17 revenues were $75M.
- 2018 (May): PATK acquires Dehco Inc., a distributor and manufacturer of parts and accessories primarily for the RV markets as well as the manufactured housing, marine and other industrial markets. Dehco’s primary products include flooring, kitchen and bath products, adhesives and sealants, electronics, appliances and accessories and LP tanks. The company operates one manufacturing facility in Indiana and four distribution centers in Indiana, Oregon, Pennsylvania and Alabama. Purchase price was 53M and Dehco’s ’17 revenues were $88M.
- 2018 (December): it acquires LaSalle Bristol an Indiana-based supplier of plumbing, flooring, tile, lighting, air handling, and building products to the manufactured housing, RV, and industrial markets. Purchase price was $54M, and Bristol’s LTM revenues were $230M. The company operates a nationwide network of 11 distribution centers, one manufacturing facility, and three combined manufacturing facilities and distribution centers.
- 2019: Andy Nemeth succeeds Todd Cleveland as CEO of the company. Prior to assuming the position of President in 2016, Nemeth was Executive Vice President of Finance, Secretary-Treasurer and CFO from 2004 to 2015, Vice President of Finance, CFO, and Secretary-Treasurer from 2003 to 2004, and Secretary-Treasurer and CFO from 2002 to 2003. Nemeth joined PATK in 1996.
- 2021 (May): it acquires Alpha Systems, an Indiana-based manufacturer and distributor of components to the RV, marine and housing industry. Alpha’s main products are adhesives and sealants, roofing membranes for RVs, roto/blow and injection molded products, butyl tape and shutters. Alpha’ LTM revenues were $158M; purchase price was undisclosed.
- 2021 (November): it acquires Wet Sounds, a designer, fabricator, engineer, and distributor of audio systems and accessories, including amplifiers, tower speakers, soundbars, and subwoofers. Wet Sounds sells both to OEMs and the aftermarket. Wet Sounds’ revenues in 2021 were $55M; purchase price was undisclosed.
- 2022 (February): it acquires Rockford Corporation, a manufacturer and distributor of premier, high-performance audio systems and components, primarily serving the powersports, marine, and automotive markets and aftermarkets. Rockford’s revenues in 2021 were $155M; purchase price was undisclosed.
After such a string of acquisitions, it is no wonder that PATK’s content per unit (the main KPI used by PATK’s management to monitor business performance) has steadily increased across its three main end markets:
Source: Patrick Industries filings and own elaboration. Data from the powerboat segment commence in 2017.
What can we learn about PATK’s acquisition strategy?
First, one common denominator is that PATK leaves the management team in place. Many of these businesses were private and family-owned, and they appear to see PATK as a natural pathway to monetization but at the same time keeping their involvement in the business. In turn, PATK brings to the table relationships with OEMs, distribution capabilities, and new capital to the business to grow.
Second, the transactions have been numerous and small in nature (bolt-on), reducing integration risk. Also, the profile of the acquisitions is not turnarounds, but businesses with a track-record of profitability.
Finally, PATK has still healthy opportunities for additional M&A. Although it already commands high market shares in the RV market (a metric not disclosed by the company), the marine segment will bring additional candidates. For instance, management held the following exchange with an analyst in the Q&A session of the acquisition of Rockford:
Just on the powersports market that’s a newer one for you guys. I guess what’s the scope of the opportunity as you see it there and how focused is the M&A pipeline going to be there?
The scope we estimate market is something north of $20 billion in terms of opportunity. The opportunity for us within that the audio space there’s probably $3 billion to $5 billion opportunity given the premium level product they may use and so we see good runway we see the opportunity to also think about from a pipeline standpoint, there’s players that have come to us that’s one of the things that’s inherent value strategically with these acquisitions as these guys are plugged in at the aftermarket. They see the products that are moving, and so we’ve had opportunities come to the table already. And for being thoughtful and how we approach this is an early step into this. And we’ll get further and further through the learning curve and better appreciating the marketplace in being ensuring that we’re picking the right partner. So, we feel good about what we can do there. And we also feel good about the opportunities organically with our manufacturing capabilities throughout the country in our metal forming, in our thermoplastics, thermoforming of plastics for different components in this. We see an inherent opportunity, as we think about plugging with brands through acquisition, an organic way to expand the presents be a variety of products. And again, using that same push and pull type mindset. We’ve got the ability to have this network take an array of products to the marketplace.
Understanding PATK’s business model through the lens of the 7 Powers
At this point it is interesting to explain why I think PATK is an excellent business and why it has not been recognized by the market so far.
PATK is a small B2B company, so as a consumer it is difficult (if not impossible) to make an assessment of their products and distribution capabilities. Additionally, the company operates in a niche industry where analyst coverage has been small (Bank of America recently launched coverage on the name). For these reasons, I think that a rigorous strategic analysis can shed some light on the nature of the business. I will use Helmer’s 7 Powers framework in order to answer the question: why is this a good business?
At the heart of Helmer’s framework, popularized in his 2016 book 7 Powers: The Foundations of Business Strategy, there is the concept of Power, defined as “the set of conditions creating the potential for persistent differential returns”. For Helmer, such returns are those obtained above the cost of capital, so his methodology links nicely with the valuation framework I will use later. It is worth mentioning that Helmer’s framework differs from Porter’s in that the former tries to answer the question of why this business is better than competitors (“differential returns”), whereas the latter focuses on the advantages and disadvantages of an overall industry. Although I will not use Porter’s in this thesis, some remarks on PATK’s end markets will be made later.
For something to be a Power, it needs to have both a benefit to the powerholder and a barrier to the challenger. According to Helmer, the 7 Powers is a comprehensive framework and encompasses all the possible competitive advantages that a business may have. A business does need to have all the 7 Powers to generate differential returns: actually, it is virtually impossible to come up with a business that displays the 7 Powers at the same time. If the business has just one of them in great quantities, shareholders should do well over time.
Helmer’s framework applied to PATK yields the following conclusions:
- Scale economies: “a business in which per unit cost declines as production volume increases.” PATK has some slight advantages over smaller competitors due to its logistics capabilities, and also when dealing with suppliers (purchasing economies). Additionally, the business may have modest learning economies. However, PATK’s business has a very low share of fixed costs, as the manufacturing process is largely manual, so scale economies due to production volumes are almost nonexistent.
- Network economies: “a business in which the value realized by a customer increases as the installed base increases.” PATK’s business does not have any network economies.
- Counter-positioning: “a newcomer adopts a new, superior business model which the incumbent does not mimic due to anticipated damage to their existing business.” PATK’s business is largely similar to its competitors’ (i.e., LCI Industries), so it does not exhibit any counter-positioning Power.
- Switching costs: “the value loss expected by a customer that would be incurred from switching to an alternate supplier for additional purchases.” Switching costs for PATK’s customers are high, due to several reasons. First, most products produced by PATK are low-priced items, so there is little incentive to switch. Second, OEMs operate with just-in-time inventories, so the risk of supply-chain disruption is high. Finally, OEMs likely find it more convenient to negotiate with one supplier in order to coordinate the entire supply chain. The following pictures capture the extent of PATK’s product portfolio in the RV segment (interested readers can find the rest of PATK’s extensive portfolio in the appendix of its corporate presentation):
Source: Patrick Industries, Corporate Presentation January’22, pp.26-27.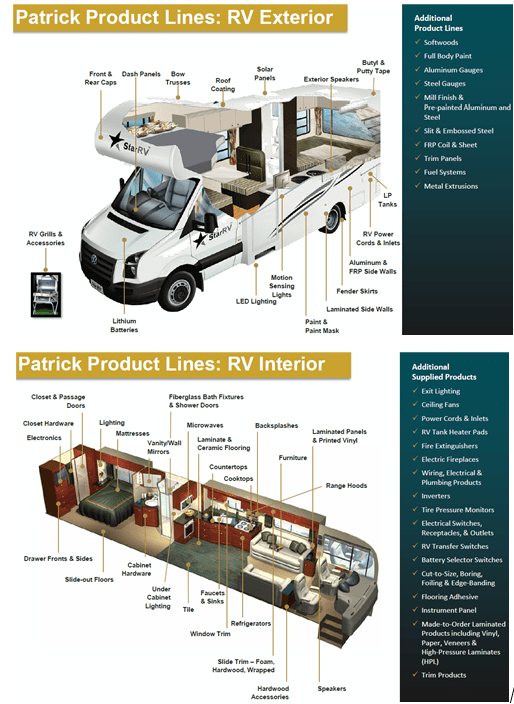
- Branding: “the durable attribution of higher value to an objectively identical offering that arises from historical information about the seller.” Most of PATK’s products do not have any brand (with the possible exception of some products in the marine segment) and are largely undifferentiated from competitors.
- Cornered resource: “preferential access at attractive terms to a coveted asset that can independently enhance value.” The business does not own material patents, preferential access to inputs or differential cost-saving manufacturing techniques.
- Process power: “embedded company organization and activity sets which enable lower costs and/or superior product, and which can be matched only by an extended commitment.” PATK has a proven business model in which acquisitions have been seamlessly integrated and profitability metrics have improved over time. Additionally, the management team tenure has been long, and its track record is strong.
Conclusions can be summarized as follows:
Source: Hamilton Helmer (2016), 7 Powers: The Foundations of Business Strategy, and own elaboration.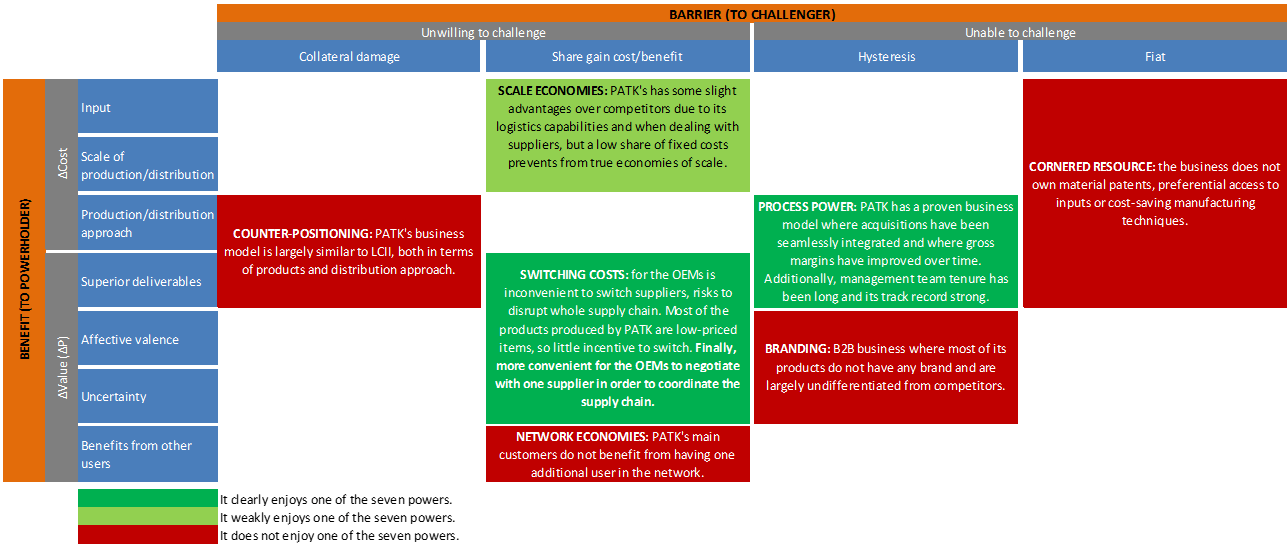
Regarding the industry, PATK operates in several industries, so it is difficult to make general observations about their attractiveness. I will focus on two industries, RV, and marine, and will only make some high-level comments that may add some value to the 7 Powers analysis conducted above.
It is well known that both industries are cyclical, as they deal with discretionary products with high-price tags. Both industries have benefitted from the pandemic with total sold units well above previous historical records, and with favorable long-term trends in demand. Customers (i.e., OEMs) are highly concentrated (for instance, as of the end of 2021, THOR had a market share of 40.8% in the towable market, whereas Forest River had 36.6%, Grand Design 10%) leaving both industries with rational players. Finally, these industries are manufacturing businesses with no competition from abroad, which I think is an often underappreciated positive attribute.
Valuation
After being seen as a clear pandemic beneficiary, PATK’s stock has fallen in tandem with the rest of the consumer discretionary sector. The stock price is back to around its 2017 through 2019 levels, although PATK is a larger and more diversified company now, as I have shown in the history section. In other words, PATK’s stock price has suffered a massive multiple contraction that does not mirror the strength of the business.
PATK’s historical financial statements are presented in detail at the end of the article. I have also reorganized the accounts to give a clear view of the operating and financial activities. In order to frame the inputs of the valuation, the following table gives a nice sketch of what the company has delivered since 2011:
Source: Patrick Industries filings and own elaboration.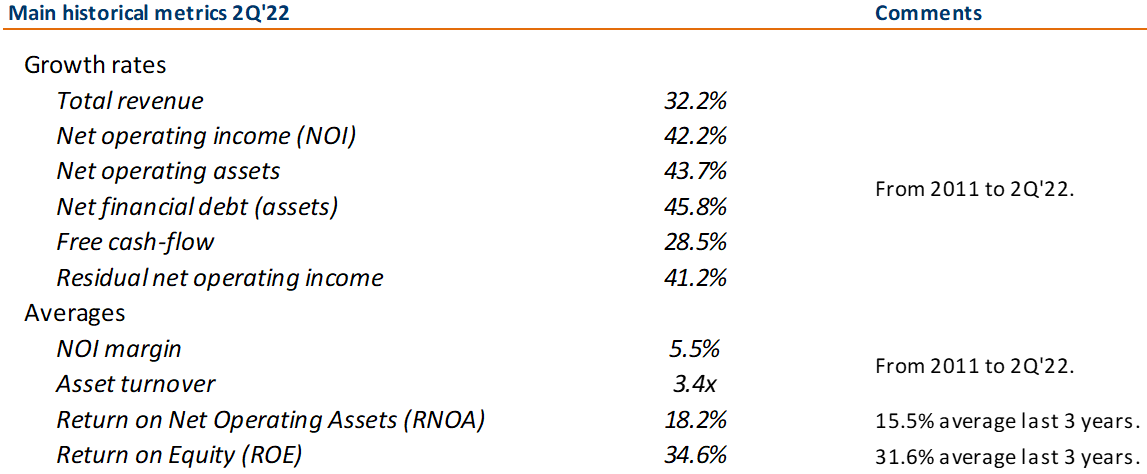
From 2011 until 2Q’22, PATK has grown revenues at 32% CAGR, whereas net operating assets have been growing at 44%. Although revenues have been greatly helped by the countless acquisitions described above, it is reassuring to see that NOAs have only grown slightly faster, suggesting that PATK has not overpaid for its acquisitions in general. Overall, the company has earned since 2011 an average RNOA of 18%, driven by a 5.5% margin and an asset turnover of 3.4x.
It is worth stressing again that the business has delivered consistent returns on capital over the last decade despite the cyclicality of its end markets. Even in 2019, which was a tough year for the RV industry, PATK generated a RNOA above its cost of capital (assuming an 8% threshold rate). On top of that, the stream of economic profits has also kept growing as more capital has been deployed into the business through acquisitions:
Source: PATK Industries filings and own elaboration. Numbers in millions. Rate of discount assumed: 8%.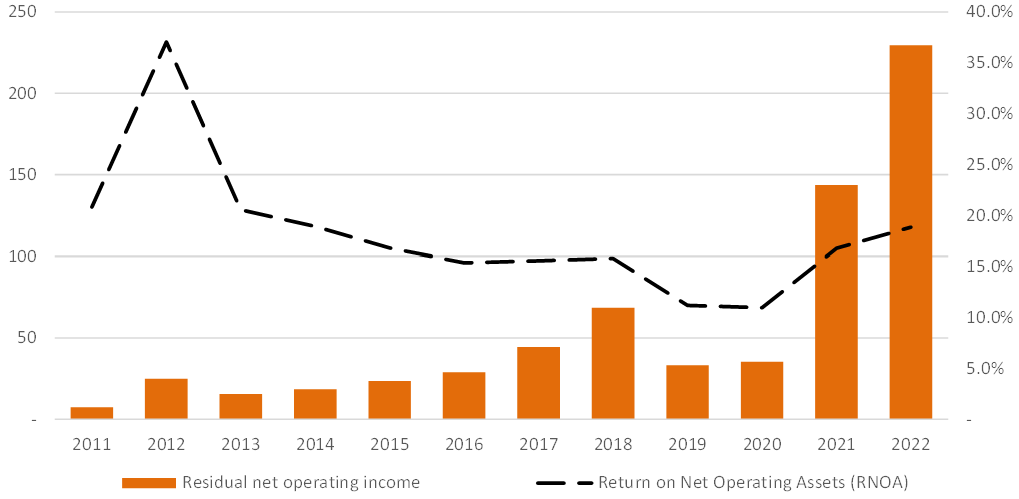
At this point, it is worth stressing that a chunk of recent profits will revert back to lower levels. But not all of it, as the market is implying. First, PATK has been investing over the last three years in automation and other production efficiency initiatives, and management has hinted that that is going to have a permanent effect on gross margins. For instance, the following exchange from the 1Q’22 earnings call is indicative of what we can expect going forward:
Is there a sense that you can maintain 20% gross margins at this point?
There is. And we do, Mike, and there’s a couple of pieces to that. And certainly, the flexibility and nimbleness of our production platform lends to that, which helps us maintain margin in up and down markets. But also, you asked a great question about the durability of some of this improvement we’ve seen. And while we certainly acknowledge there’s an element of absorption that comes along with increased production levels, we’ve got — as I mentioned, a little bit of headwinds from raw material input pricing as well as the freight in, and I think folks are feeling that generally across the board. But we think 100 to 125 basis points of that overall lift we see that resonates through both gross margin, operating margin is attributable to our productivity improvements which take a lot of different forms, but lend off the CapEx spending we made last year, which is why we’re focused on continuing that trend this year as mentioned, $100 million is our planning number for 2022. We think, again, that’s 100 to 125 basis points of durability in that margin lift.
Second, PATK’s portfolio has moved toward higher-end products (and aftermarket) after the acquisitions of Wet Sounds and Rockford, lifting margins (although depressing asset turnover). Finally, over the last three years, PATK has spent a lot on M&A ($343M in ’18, $56M in ’19, $306M in ’20 and $508M in ’21), so a large portion of recent profit increases comes from M&A, not just from a better macroeconomic environment.
PATK’s historical metrics can give us a valuation range for the business. For an (EV) discount rate of 8%, a growth rate in residual earnings of 2%, and a return on net operating assets of 13% (or $115M of economic profits annually) on PATK’s asset base of $2.3bn, the EV would be around $4.2bn, implying a 128% upside, or $130 per share. At that price, PATK would trade at 1.8x EV/NOA and 14x EV/NOI. It must be emphasized that I regard a 13% rate of return as a very conservative assumption over the long term, given PATK’s historical track record previously discussed.
On the other hand, if we assume economic profits of $70M (the average of 2017-’21), the target price would drop to $97 per share – which means that the margin of safety is ample:
Source: PATK Industries filings and own elaboration. Numbers in millions. Rate of discount assumed: 8%. Growth rate assumed: 2%.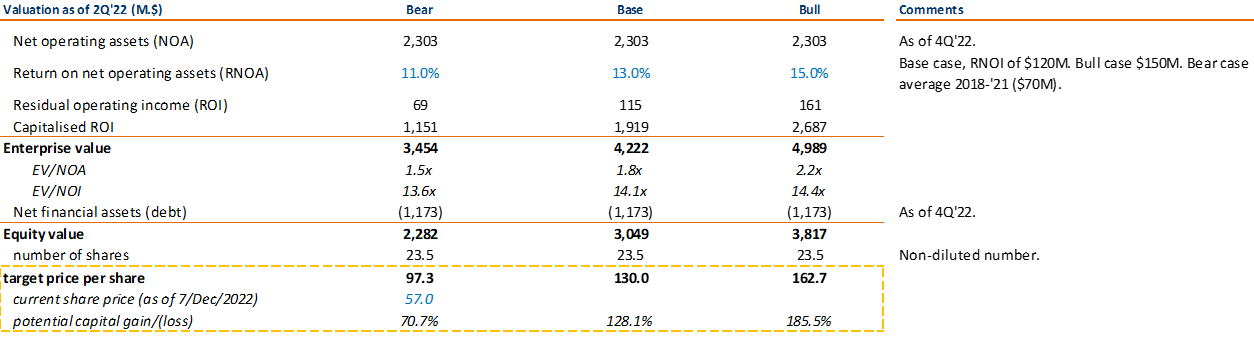
There is another useful way to frame the current valuation discount: in terms of internal rates of return. Given the current EV of $2.5bn. (EV/NOA of 1.1x), and assuming that our forward RNOAs are correct (11% for the bear case, 13% for the base case, and 15% for the bull case), future unlevered returns will annualize 10%, 12%, and 14%, respectively; which after taking into account the leverage of the company, will raise to 14%, 17%, and 21%, offering thus strong return prospects for long-term investors:
Source: PATK Industries filings and own elaboration. Numbers in millions. Growth rate assumed: 2%.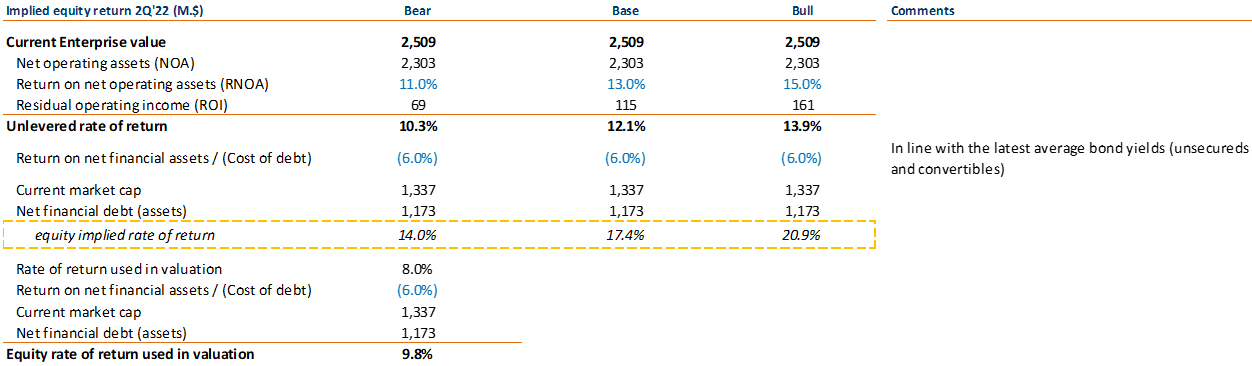
Downside risks
- Manufacturers in PATK’s main end markets have become increasingly consolidated over time, especially the RV industry. Although the relationship between OEMs and their suppliers is very close and has been good so far, further upstream acquisitions by THOR could erode PATK’s bargaining position.
- Labor is a huge chunk of total costs. Additional wage pressures could impact PATK’s profitability down the road.
- After such a string of acquisitions, PATK’s list of potential candidates is shorter, which could lead to bad capital allocation decisions by the management team.
- PATK’s financial leverage is higher than its competitors’ and could pressure the stock price if the downturn in PATK’s end markets is longer (and deeper) than expected.
Upside risks
- The economic cycle is not as bad as it is feared.
- Future share repurchases are carried out at current or more attractive levels.
- PATK is able to source additional acquisitions at attractive valuations.
Appendix I: Patrick Industries reorganized financial statements (2010-2021)
Reorganized income statement
Source: PATK Industries filings and own elaboration.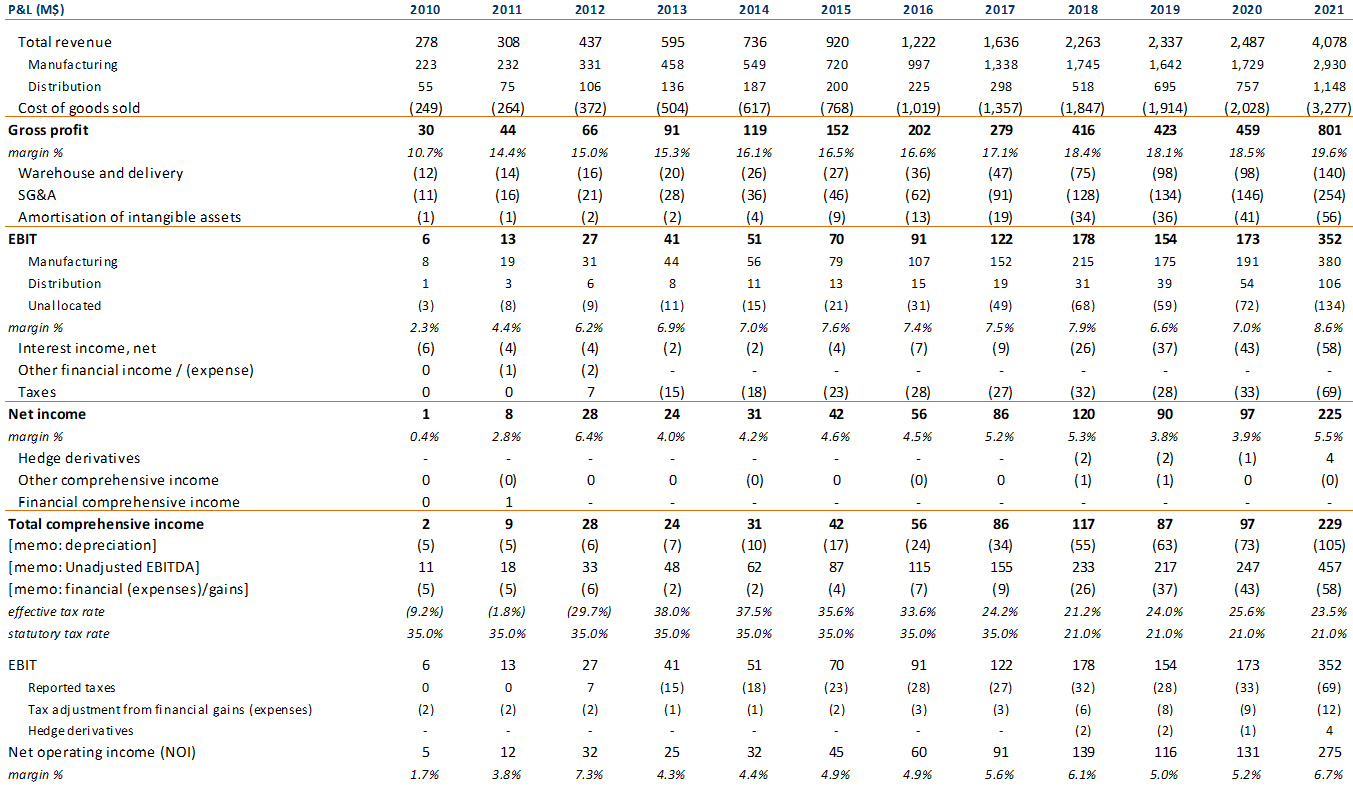
Reorganized balance sheet
Source: Patrick Industries filings and own elaboration.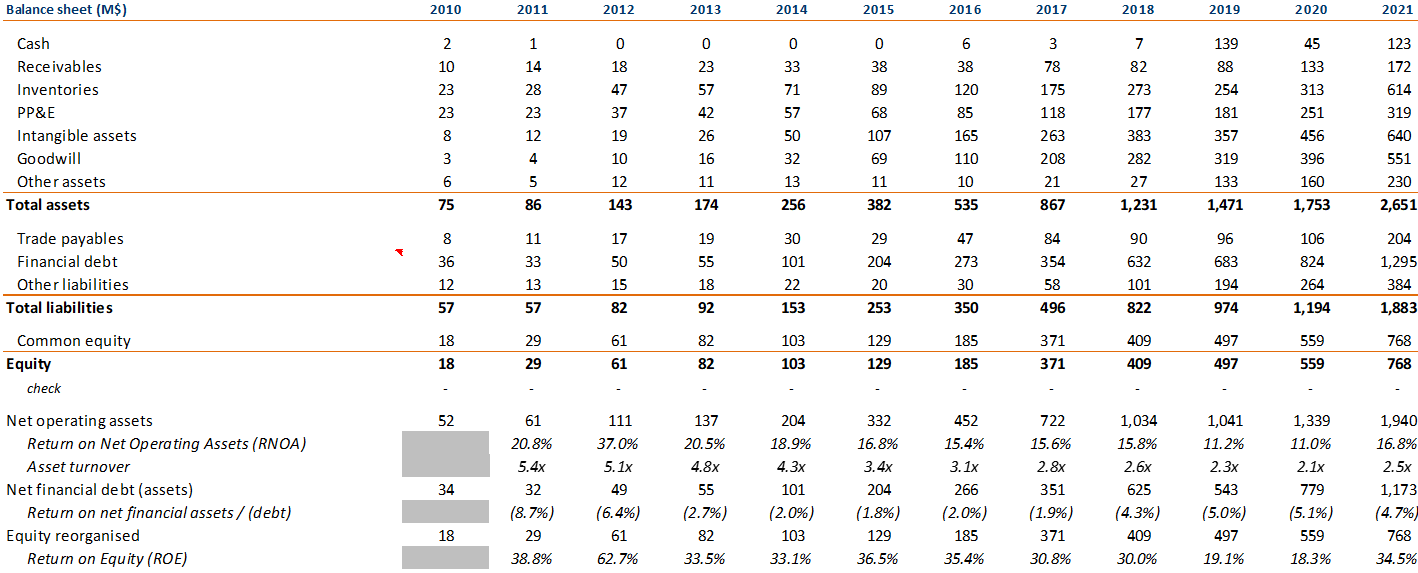
[1] EV/NOA: Enterprise value to net operating assets. EV/NOI: Enterprise value to net operating income. Net operating assets are computed as equity (including minority interests) plus net financial debt. Net operating income is computed as EBIT after statutory taxes, less other comprehensive income operating items (such as currency translation adjustments). EV/NOA and EV/NOI, are, in effect, the unlevered measures of P/BV, and P/E, respectively.
[2] Return on net operating assets (RNOA): net operating income divided by net operating assets.
Editor’s Note: This article was submitted as part of Seeking Alpha’s Top 2023 Pick competition, which runs through December 25. This competition is open to all users and contributors; click here to find out more and submit your article today!
Be the first to comment