

Natural Gas Price Outlook – Talking Points
- Natural gas price receives boost on cooler temperature outlook
- Inventory levels at historical averages as summer season approaches
- Prices recaptured a long-term trendline that could help accelerate upside
Natural gas is off to an optimistic start for May as the heating gas looks to extend its gains from the prior month when prices rose over 12%. While the United States is moving into its summer months, colder-than-average weather across portions of the country has helped fuel the demand side of the equation, lifting prices.
Now, colder weather is expected in the United States over the next 8 to 14 days, according to the National Weather Service’s (NWS) Climate Prediction Center. The cooldown will be concentrated across the northern plains extending into the northwest where an even higher probability for colder temperatures lurks. Elsewhere, Florida and the Pacific coastline will likely see above-average temperatures.
NOAA 8-14 Day Outlook Temperature Probability Map
Source: cpc.ncep.noaa.gov
The supply side for natural gas has stabilized throughout the spring months. According to the US Energy Information Administration’s (EIA) Weekly Natural Gas Storage Report for the week ending April 23, working gas inventory was 1,898 billion cubic feet (Bcf), a slight rise from the prior week’s 1,883 Bcf reading. The storage level represents a 302 reduction versus inventory from the same time period in 2020 – a rather insignificant variance.
That said, weather – mainly being the temperature – across North America will likely be the primary driver for natural gas prices in the coming weeks and months. Still, the next weekly storage report from the EIA could cause price movement. According to the DailyFX Economic Calendar, the natural gas stocks change for the week ending April 30 will cross the wires on May 6.
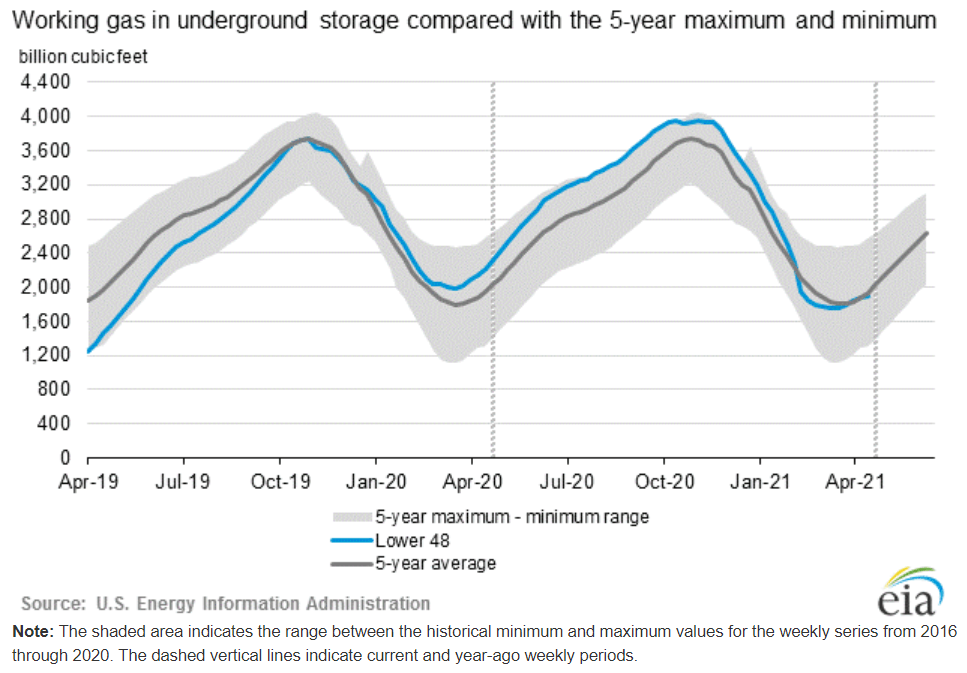
Source: ir.eia.gov/ngs/ngs.html
Natural Gas Technical Forecast
Natural gas reclaimed a trendline from last September, helping extend the heating commodity’s bullish energy seen throughout April trading. The trendline capture saw a bullish Simple Moving Average (SMA) crossover occur at the same time, with the 20-day SMA crossing above the 100-day, a bullish sign. Natural gas will now look for the trendline to offer support before moving higher. The 3.00 psychological level – just above current prices — will be key to holding the recent gains.
Natural Gas Daily Chart
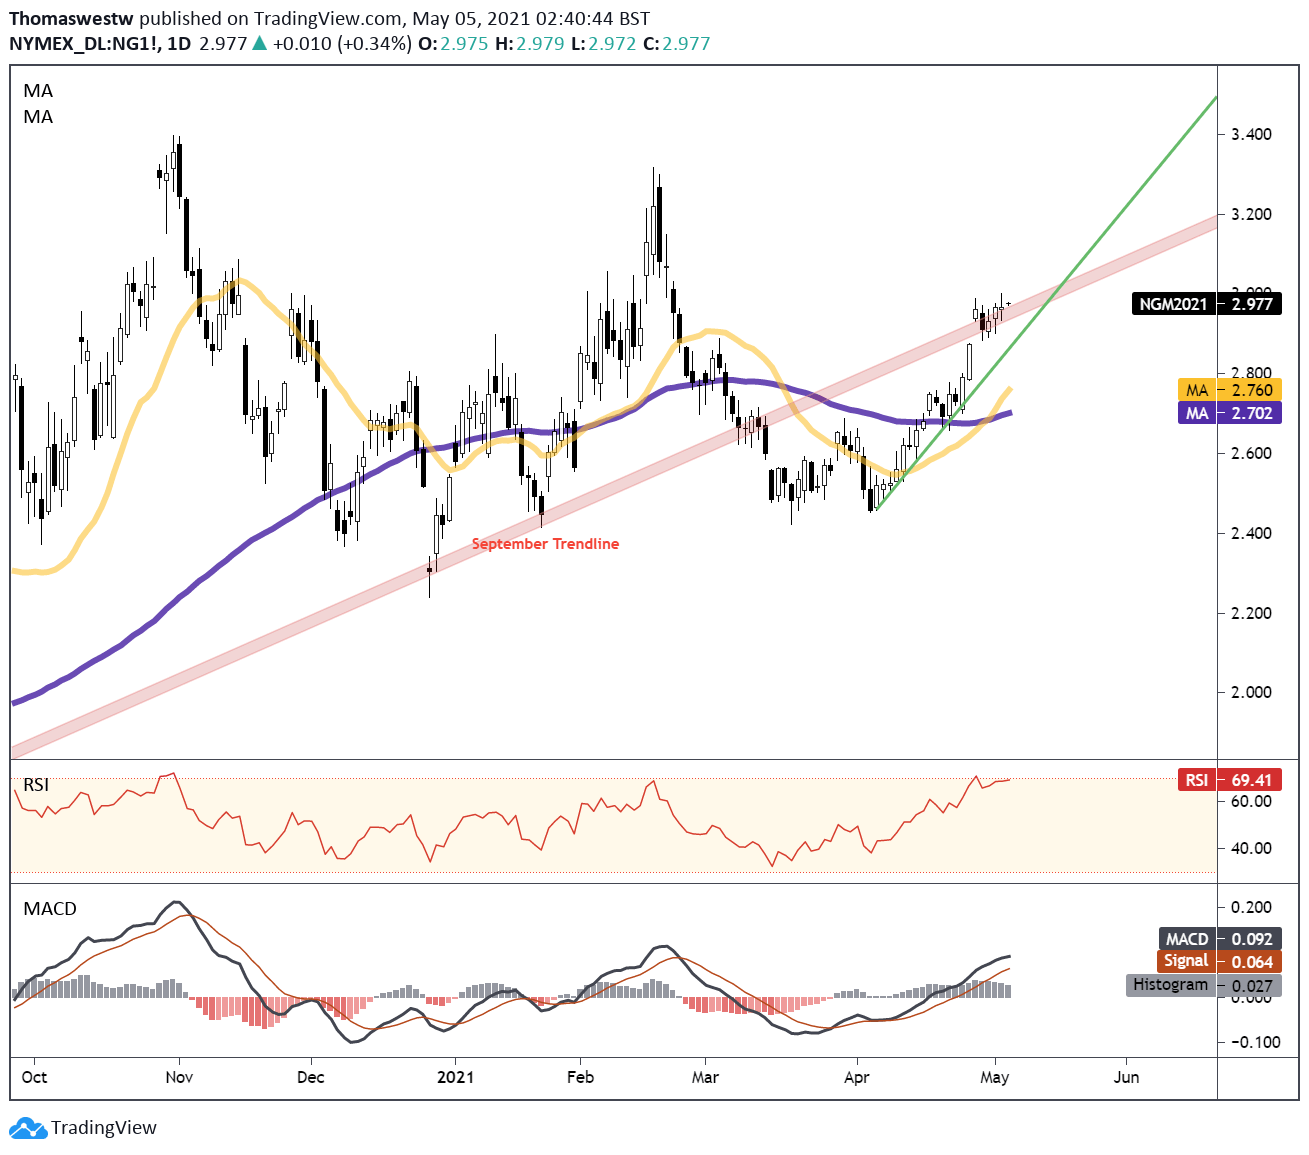
Chart created with TradingView
Natural Gas TRADING RESOURCES
— Written by Thomas Westwater, Analyst for DailyFX.com
To contact Thomas, use the comments section below or @FxWestwateron Twitter
Be the first to comment