

kanawatvector
INVESTMENT PERFORMANCE (%) as of June 30, 2022
|
Total Return |
Annualized Return |
|||||
|
Inception |
Quarter |
YTD |
1 Year |
3 Year |
Inception |
|
|
Palm Valley Capital Fund |
4/30/19 |
-0.74% |
1.18% |
0.14% |
7.96% |
7.77% |
|
S&P SmallCap 600 Index |
-14.13% |
-18.97% |
-16.88% |
7.23% |
6.19% |
|
|
Morningstar Small Cap Index |
-16.44% |
-21.61% |
-21.68% |
4.24% |
3.58% |
|
Performance data quoted represents past performance; past performance does not guarantee future results. The investment return and principal value of an investment will fluctuate so that an investor’s shares, when redeemed, may be worth more or less than their original cost. Current performance of the Fund may be higher or lower than the performance quoted. Performance of the Fund current to the most recent quarter- end can be obtained by calling 904-747-2345.
As of the most recent prospectus, the Fund’s gross expense ratio is 1.83% and the net expense ratio is 1.30%. Palm Valley Capital Management has contractually agreed to waive its management fees and reimburse Fund operating expenses through at least April 30, 2023.
The Jerome Gambit
“I’m playing chess while everyone else is playing checkers. That’s why I always lose.”
-Josh Stern, Author
Dear Fellow Shareholders,
Within a month of its October 2020 release, The Queen’s Gambit became Netflix’s most-watched miniseries ever. The show was set in the 1950s and 60s and followed a young woman’s ascension to the pinnacle of the chess world. In chess, a gambit is when a player sacrifices a pawn during the game’s opening to gain some advantage. The Queen’s Gambit is the most popular sacrifice and is designed to help win control of the powerful center squares of the board. Black can capture the undefended white pawn on c4 but will relinquish its controlling position on the d5 center square. They must decide whether to accept the Queen’s Gambit for an immediate slight lead in material (+1 pawn) or decline the gambit in the interest of their overall strategic position.

Luck plays no part in chess. The better player almost always wins. After four moves apiece for white and black, there are over 288 billion different potential positions on a chess board. Experienced players quickly find the best moves when the possibilities seem endless. Investing, on the other hand, can involve a great deal of luck, particularly in the short run. After four rounds of QE and its glorious afterglow, investors have seen one reliable move—buy the dip—because the Fed has had their backs. If the game was checkers, it’s been an effortless quadruple jump capture—jump diagonally and take, jump again and take, and take, and take again. Easy-peasy.
Investors’ faith in central banks is currently being tested by the highest U.S. inflation in over 40 years. The surging cost of living is causing hardship for many Americans, and the President has instructed the Fed to fix the problem. Although Fed members have promised to continue raising interest rates until inflation is under control, their goalposts for achieving success are unclear. Will they be satisfied by declining inflation, even if it remains elevated? While pricking the grand asset bubble via rate hikes may be a surefire way to temper inflation, the economic consequences of cratering asset prices could be severe.
The Fed, all too happy to collect accolades for helping to keep stocks, bonds, and real estate prices high, is now confronted with the harsh reality of raising rates in a slowing, highly leveraged economy. They’re praying for a soft landing. The Fed Gambit has been that inflation would cool before they had to meaningfully tighten monetary policy.
The Fed didn’t begin raising interest rates above zero until the Consumer Price Index hit 8%—the slowest response ever. The CPI reached a multidecade high of 8.6% in May, prompting the languid Fed to upsize its June rate increase from 50 to 75 basis points in a last-minute attempt for political cover. At the press conference, Chairman Jerome Powell said future 75 basis point hikes would be unusual, that he sees no signs of a recession, and that inflation is mostly Russia’s fault. He’s shifted from buying time (“inflation is transitory”) to the blame game (“we can’t control it”). Within a week of the Fed’s June meeting, bond yields began to collapse, as the market started planning for a Fed pivot. Equities rallied as investors’ zest for low rates outweighed fears of an economic downturn.

Believe it or not, there is a Jerome Gambit in chess, which has been dubbed “unsound,” “extremely aggressive,” and according to the popular YouTube channel ChessVibes, it’s one of the 7 worst openings. Commented Chess Vibes founder Nelson Lopez, who is a chess master, “I do not recommend the Jerome Gambit, although to be completely honest with you guys, I have played this myself from time to time, and it is kind of fun.” The Jerome Gambit: it’s all fun and games until someone loses control of an economy.
If we avoid a recession in the U.S., will it be for the right reasons? More debt, QE, and mal investment are not the ticket to sustainable investment performance, in our opinion. For speculators with a short time horizon, that may not matter. For long-term investors aiming to avoid substantial impairments to their portfolios, it may be all that matters. There are many investors who would interpret one declining CPI print as a reason to rush back into stocks, since an end to rate increases could be on the horizon. For better or worse, we’ve drawn our line in the sand: Palm Valley will only deploy capital when we believe a stock meets our double-digit required return threshold using normalized assumptions for operating performance.
Source: Bloomberg
We believe there is confusion regarding the severity of current market conditions. Undoubtedly, cryptocurrencies, SPACs, and other investment baubles have been smashed. Stock prices are well off their highs, with technology and small cap stocks suffering the steepest declines.
However, in our opinion, the all-time high prices achieved last year reflected an unprecedented asset bubble, which was fueled by near zero interest rates and record government spending. Although we are grateful for lower equity prices as we search for undervalued names, we do not believe the drawdowns experienced so far have created extensive small cap opportunities. Although there seem to be pockets of value forming, most small cap valuations remain above historical norms. Furthermore, for certain industries, like banks and retailers, trailing profitability is much higher than pre-pandemic levels. We think this is creating the appearance of value where there is none, since we anticipate lower earnings for many of these firms.
Currently, two-thirds of the nonfinancial members in the Russell 2000 Index are either unprofitable or trade above 20x EV/EBIT. We use 20x EBIT (operating profit) as an arbitrary cutoff for an exorbitant valuation, although this doesn’t necessarily apply to high growth businesses. We don’t typically invest in younger, rapid growth companies due to the difficulty in discerning their normalized earnings power. We like growth, but we won’t pay up for it, and usually you must.
We prefer to play in the sub 10x EV/EBIT sandbox, where normalized EBIT is used as our guidepost. Naturally, it’s more labor-intensive to gauge normalized earnings than to use trailing profits, so others’ shortcuts can lead to opportunities for enterprising investors. Although it varies depending on capital intensity, tax rates, and leverage, a stock trading at a double-digit EBIT multiple is typically also selling for more than 15x normalized free cash flow. We often value businesses at a mid-teens unlevered free cash flow multiple. Since we require a discount to our estimated fair value before buying, we’re usually targeting companies that are trading below 10x their normalized operating profit.
Source: Bloomberg; Russell 2000 nonfinancials; dates 12/31 except Mar’ 09, Mar ’20, and Jun ’22
Today, the percentage of small caps selling for less than 10x trailing EBIT (16.8%) is greater than most periods over the last ten years. The proportion is not quite as high as during the pandemic’s onset, and it’s far less than we saw in 2008 and 2009, but on the surface, it appears to be a promising sign for value investors. Valuations are heading in the right direction. Prices have fallen, with most small caps down over 20% from their 2021 peaks. Earnings, on the other hand, are extremely strong for profitable companies. In fact, the median EBIT growth since 2019 for small caps in the sub 10x EV/EBIT bucket is an astonishing 194%. If a company has nearly tripled its profits over two years, we would certainly want to assess the sustainability of its earnings.
Source: Bloomberg; Russell 2000 firms classified as Consumer Discretionary w/10 years of data
Industries with a large presence in the “cheap” bucket include homebuilders, building materials, recreational vehicles, retailers, energy, shipping, transportation, chemicals, and steel. These are highly cyclical businesses benefitting from favorable conditions. In some cases, such as the energy industry, you could argue that newfound spending discipline and global supply constraints could extend the duration of their upcycle. For other industries, like retail, it’s not difficult to draw a direct line between stimulus payments and asset bubbles and their strong operating performance. Mature consumer discretionary businesses in the Russell 2000 reported over twice the profits in the last twelve months versus the comparable period two years earlier.
Banks in the Russell 2000 Index have a median P/E of only 10x, which significantly flatters overall value index multiples. Prior to 2021, 2019 was the strongest year ever for small cap bank profitability. The median bank P/E using dated 2019 earnings is 15x. The average bank is trading at a 50% premium to book value, and very few are selling for less than their tangible equity. Book value for the lenders is tethered not only to bonds they own that have been bruised in 2022, but also to their large commercial real estate (CRE) loan books, which have not yet experienced significant losses this cycle. CRE loans account for 244% of the shareholders’ equity of small domestically chartered banks (below the top 25), according to the Federal Reserve, versus only 57% for large lenders. Including residential, real estate loans represent 361% of small banks’ equity. Should higher interest rates cause real estate values to wobble, small cap banks could be vulnerable.
Source: Bloomberg; Forward P/E based on Consensus Mean Estimates
There are those making the case for small caps by referencing their P/E ratios versus large caps. The chart below seems convincing, showing the ratio of small to large company estimated earnings at its lowest point since the tech bubble imploded. Using trailing instead of estimated earnings exhibits the same trends. However, basing a bull case for small stocks on this relative relationship is wrong, in our opinion.
First, large companies, as represented by the S&P 500, have been trading near their highest valuations in history outside of the tech bubble. Second, SmallCap 600 earnings are skewed by financials, which account for 35% of index earnings versus 23% for the S&P 500. This, combined with the profitability requirement for inclusion into the SmallCap 600, means moneymaking companies are overrepresented compared to the small cap universe at large. Third, earnings of profitable small caps have been on a tear, with SmallCap 600 earnings per share (EPS) up 300% from their 2007 pre-credit crisis peak versus a 120% rise in EPS for large caps (S&P 500) over the same period. Profits received a booster shot from 2018 tax reform, plummeted during the onset of COVID, and surged to new heights in the wake of Uncle Sam’s mega stimulus.
Trailing EPS for the SmallCap 600 are currently 80% above the pre-COVID peak. That leap from what was considered a very strong economy is not sustainable, in our view. Despite robust earnings, the median P/E for SmallCap 600 index members is still a generous 18x, and 21x for nonfinancials. That’s far from cheap even if current earnings were normalized.
Source: Bloomberg; Consensus Mean EPS Estimates
Lastly, forward earnings estimates are unreliable, especially during periods of economic volatility. It took five years for actual SmallCap 600 earnings to catch up to the consensus forward estimates from January 2008, and EPS growth prior to that time was far more tepid than recent growth, as you can see in the chart above. Additionally, the EPS we’re showing excludes abnormal losses. In other words, we’re being generous, since including all the bad stuff (which is concentrated in a small minority of firms) would reduce aggregate trailing EPS by 20%!
To summarize: we don’t use relative valuation as a basis for investment, and we believe the earnings of many small caps are likely to decline from current inflated levels.
Kermit the Frog once sang that it’s not easy being green. That goes for anyone managing money in 2022. For the quarter ending June 30, 2022, the Palm Valley Capital Fund lost 0.74% compared to a 14.13% drop for the S&P SmallCap 600 Index and a 16.44% decline for the Morningstar Small Cap Index. Year-to-date, the Palm Valley Capital Fund gained 1.18%, while the SmallCap 600 fell 18.97% and the Morningstar Small Cap Index dropped 21.61%. We attribute the Fund’s outperformance to our equity-only returns, which were -3.22% for the quarter and +7.28% year-to-date, as well as our significant allocation to cash equivalents (equity-only figures exclude cash holdings and fund expenses). The Fund began the quarter with 80% of the portfolio held in cash, and it ended the period with 75.8%. Our cash position is now predominantly short-term U.S. Treasuries, for which yields have meaningfully improved this year.
The Fund’s absolute return strategy has held up well so far in 2022 amidst difficult market conditions. While we believe that our style of investing will achieve our objectives over a full market cycle, we expect routine bouts of relative underperformance, such as we experienced during 2021. Nonetheless, we are pleased with the Fund’s risk-adjusted performance since inception.
We anticipate questions from investors as to why we didn’t invest more during the second quarter, when small caps (Russell 2000), at one point, were down 32% from their 2021 highs. Internally, our level of portfolio activity picked up significantly. We started five new positions and increased our weightings in several existing holdings. We can see a clear path to further investments if market declines continue.

Nevertheless, small caps didn’t sell off enough to create compelling opportunities across the board, in our opinion. The market simply unwound its undeserved gains from 2021, sending it back to levels that were previously all-time highs. Certain sectors were disproportionately impacted by the Q2 selloff, such as consumer discretionary, and that’s where we focused much of our attention. Yet, we were hoping for more. We intend to remain patient, since we believe that market turbulence will eventually produce enough high-quality bargains to fill the Fund. For now, the majority of our positions have below average weightings, reflecting our view of the size of the discount, risk of each investment, and its role in the portfolio.
The five new positions bought in the second quarter were Carter’s (CRI), Oil Dri (ODC), Hooker Furnishings (HOFT), Lassonde Industries (OTC:LSDAF), and Nathan’s Famous (NATH).
Carter’s is a former Fund holding that is the leading marketer of infant and children’s apparel in the United States. Like other consumer discretionary companies, Carter’s is not immune to declines in consumer spending. However, we believe its business is less volatile than most since its products are priced moderately (below $11 per unit) and need to be replaced frequently as children grow out of their clothes.
Although Carter’s reported better than expected results during the quarter, its shares fell sharply along with most consumer discretionary stocks. While Carter’s 2022 earnings expectations may eventually be reduced due to a slowdown in consumer spending, we believe its share price is attractive relative to our normalized free cash flow estimate. Given the company’s strong balance sheet and history of generating free cash flow in a variety of environments, we are comfortable owning Carter’s throughout the economic cycle. We are also fond of its strategy of returning free cash flow to shareholders through its dividend (4.4% yield) and aggressive buyback program.

We have followed Oil-Dri Corporation for over twenty-five years. Founded in 1969, the firm is a manufacturer of sorbent products sourced from its clay reserves. Oil-Dri has mining and manufacturing facilities in Mississippi, Georgia, Illinois, and California. The company’s assets are difficult to replicate and have long lives, with a 40-year supply of proven and probable clay reserves. Examples of its products include cat litter, animal health solutions, agricultural chemical carriers, absorbents for sports fields and industrial cleanup, and filtration absorbents for edible oils.
Although Oil-Dri’s revenue growth has been impressive over the past year, its profit margins have declined due to higher energy, packaging, labor, and transportation costs. As a result, Oil-Dri’s stock fell below our calculated valuation. As price increases are implemented, we expect sales and profit margins to increase in upcoming quarters. In the meantime, Oil-Dri should continue to pay an attractive dividend (4.5% yield), buy back stock, and reinvest its cash flow into higher growth categories, such as animal health.
Hooker Furnishings is a top five player in the U.S. furniture market and sells to a variety of retailers ranging from Macy’s to Wayfair to independents. The company designs, markets, and imports wooden, metal, leather, fabric-upholstered, and outdoor furniture, and it also domestically manufactures custom leather and fabric-upholstered residential furniture.

Hooker was founded in 1924 in Martinsville, Virginia, and has adapted to changing conditions in the U.S. furniture industry by shifting most production overseas. As a result, Hooker is now a relatively asset light company and does not have the operating risk associated with retail stores.
Since 2019, the business has been negatively impacted by tariffs, supply chain issues, and excessive returns in one distribution channel, which have offset tailwinds from a strong housing market. Trailing margins are below normalized, in our view. Management believes they have addressed problems confined to one underperforming segment, which will lead to improved results going forward. Of course, Hooker will now potentially have to deal with softer demand as the housing market and economy begin to cool. Operating income remained positive throughout the last recession and bursting of the housing bubble, which is a testament to the variable cost nature of Hooker’s business model. Average five-year free cash flow is $29 million against a market cap of less than $200 million. Hooker has no debt and is selling for less than its net tangible assets. The firm pays a dividend yield of around 5%.

Lassonde Industries is the Fund’s most recent purchase. Lassonde is the largest producer of fruit juices and drinks in Canada and one of the top two producers of private label shelf-stable fruit juices and drinks in the U.S. The firm also makes fruit-based snacks, cranberry sauce, and cider-based beverages. Their SunRype “fruit to go” vegan, gluten free snack is like a Fruit Roll-up for grownups. Financial results are generally steady, with high single digit operating margins and consistent cash generation. Recent performance has been negatively affected by inflation, causing margins to compress. Management has pledged to increase investments in the upcoming year, which will have an adverse impact on 2022 results but will reduce future expenses. That’s our kind of setup. The shares have sold off 56% from their 2018 all-time high and are down 39% from the 2021 peak. The stock is trading for 8x Lassonde’s five-year average free cash flow.
Nathan’s Famous needs no introduction to most readers. The brand sponsors the Coney Island Fourth of July Hot Dog Eating Contest airing on ESPN that made Joey Chestnut a household name. The vast majority of the company’s income is derived from a long-term royalty agreement with John Morrell, a division of Smithfield Foods. Smithfield pays Nathan’s 10.8% of its Nathan’s branded hot dog sales to retailers. This income stream has been growing, while the other parts of the company’s business, including sales to restaurants and Nathan’s own franchise operations, have experienced challenges. The John Morrell royalty deal extends through 2032, which we believe provides enormous stability to Nathan’s earnings. We began acquiring shares late in the quarter, but the stock ran up, possibly over positive associations with the upcoming July 4th holiday. We currently have only a small position.

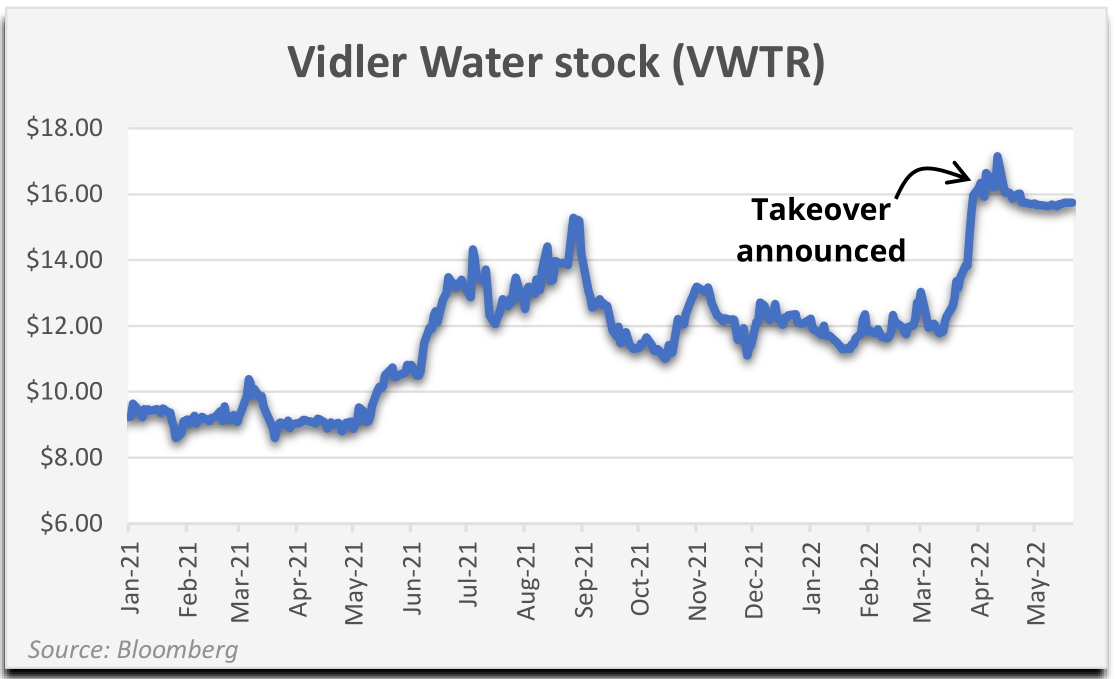
We sold two Fund positions during the quarter: Coterra Energy (CTRA) and Vidler Water. As a result of surging oil and natural gas prices, Coterra reached our valuation, and we exited the position in April. Vidler Water was acquired by homebuilder D.R. Horton (DHI) during the second quarter for $15.75 per share, a modest 19% premium to the 90-day volume weighted average price. D.R. Horton can use Vidler’s water rights to satisfy government requirements to have water resources available before it breaks ground on new housing developments in Nevada. The takeover price was below our valuation, but D.R. Horton was the only real buyer who stepped up to the plate for Vidler’s assets. The deal appears to have leaked early, since the stock surged in the weeks before the announcement. We sold half the position immediately after the deal news when the stock traded at a premium to the takeover price and waited for the acquisition to close to exit the remainder. We initially purchased Vidler in May 2021.
The top three contributors to the Fund’s second quarter performance were WH Group (OTCPK:WHGLY), Crawford & Co. (CRD.B, CRD.A) and Oil Dri. The shares of Oil Dri, our recent purchase, may have appreciated because natural gas prices declined toward quarter end. Natural gas is a key cost input for the firm. WH Group and Crawford have been underperformers in the portfolio for most of the period we’ve owned them. WH Group’s recent operating performance has been solid, and the shares may have benefited from a favorable change in sentiment on stocks associated with China. The long sleepy shares of Crawford & Co. rose modestly during the quarter. The insurance claims management provider’s first quarter results, while not great, were better than expected. We see considerable room for Crawford to improve its margins, which lag peers.
The top four detractors from the Fund’s second quarter performance were the Sprott Physical Silver Trust (PSLV), Osisko Gold Royalties (OR), and a third-place tie between the Sprott Physical Gold Trust (PHYS) and Miller Industries (MLR). We started buying Miller last quarter. Its stock has slid consistently for more than a year and now sits beneath its pandemic lows. The tow truck manufacturer’s sales and backlog are strong, but inflation has crimped earnings. Management said supply chain challenges are decreasing in 2022, and they believe it is possible for margins to approach normalized levels by the end of the year. The stock is trading for around 6x our estimate of normalized operating profit and below Miller’s tangible book value.

Even though gold fell in Q2, it has performed well relative to most assets in 2022, and why shouldn’t it? Inflation has been raging and there is substantial economic uncertainty. Investors’ confidence in the Fed is also beginning to disintegrate. Still, the combination of initial Fed rate increases and a risk-off mood has pressured the poor man’s gold, making the Fund’s investment in silver our most impactful loser for the quarter. No matter how far the Fed takes its rate increases and QT, we expect they’ll ultimately revert to the same easy monetary policies that were significant contributors to the current outbreak in inflation.
Once this unambiguous capitulation by the Fed on its faux hawkishness is exposed, we believe precious metals will respond favorably. Even so, in the interim, we are prepared for volatility in our silver position as speculators adopt various inflation narratives or try to steer prices through the dominant paper market for precious metals. We increased the Fund’s metals exposure toward the end of the second quarter.
Hollywood kicked off the summer with two highly anticipated blockbusters in Top Gun: Maverick and Jurassic World Dominion. Steven Spielberg’s original Jurassic Park from 1993 was heralded for its visual effects, which still look convincing by today’s standards. According to the effects supervisor, the most difficult scene to film was not of a massive animatronic dinosaur, but the vibrating water glass when T-Rex was stomping on the loose nearby. You know the one. A sign of impending doom. Like sitting ducks in a stopped car, Dr. Alan Grant (Sam Neill) warned Ian Malcolm (Jeff Goldblum), “Keep absolutely still.”

There’s a lot in common between central banks believing they can permanently control an economy and scientists believing they can resurrect and contain dinosaurs. It never turns out well. Yet, the lessons are short-lived. There’s always a new Jurassic Park featuring upgraded facilities sure to never be overrun by the gargantuan reptiles. Similarly, despite its signature role in fomenting the major asset bubbles this century, the Fed’s toolkit and authority continue to expand.
Like the rippling water glass and distant thud of colossal footsteps, there were ominous signs that something destructive was approaching last year. The Fed said everything was under control and inflation would quickly dissipate. Keep absolutely still. Their gambit failed. Now, like a hungry T-Rex, inflation is gobbling up chunks of the U.S. economy indiscriminately. The bond market’s corrective feedback mechanism may work to help curb inflation, but not without significantly impacting large sectors like housing. If inflation has peaked, it’s not because of the Fed’s shrewdness. The Fed and politicians’ attempted management of the economy has been extremely sloppy. The central planning chickens have come home to roost.
While there is widespread concern among many investors, there is not outright panic. Not yet at least. Now is the time for absolute return investors to remain calm and choose our spots carefully. Although certain highly speculative parts of the Fed’s Jurassic playground have been ripped to pieces, widespread capitulation hasn’t occurred. Equity valuations remain above average, while corporate profits seem unlikely to remain on their soaring trajectory. As you’re hunting for treasures in the market jungle, please remember one more thing a Fed-triggered stock market has in common with dinosaur territory:
Damage from fat tails happens a lot more than expected.

Thank you for your investment.
Sincerely,
Jayme Wiggins, Eric Cinnamond
Definitions:
Basis point: One hundredth of a percentage point (0.01%).
Book Value: Shareholders’ equity, total assets minus total liabilities.
CPI (Consumer Price Index): A measure that examines the weighted average of prices of a basket of consumer goods and services.
EBIT: Earnings Before Interest and Taxes (i.e., operating income).
EBITA: Earnings Before Interest, Taxes, and Amortization of Acquired Intangible Assets.
Enterprise Value: Market Cap plus total debt minus cash and equivalents, adjusting for noncontrolling interests.
EPS (Earnings per share): Net income divided by shares outstanding.
Forward P/E: Market capitalization divided by earnings per share estimates for one year ahead.
Free Cash Flow: Cash from Operating Activities minus Capital Expenditures.
P/E Ratio: A stock’s price divided by its earnings per share.
Price–to-Book Ratio: A stock’s price divided by its book value, or shareholders’ equity, per share.
Quantitative Easing (QE): Monetary policy where a central bank purchases government bonds or other financial assets to create liquidity in an economy.
Quantitative Tightening (QT): Monetary policy where a central bank sells government bonds or other financial assets to reduce liquidity in an economy.
Russell 2000: The Russell 2000 Index is an American small-cap stock market index based on the market capitalizations of the bottom 2,000 companies in the Russell 3000 Index.
Shiller P/E (CAPE): The cyclically adjusted price-to-earnings ratio is a valuation measure usually applied to the US S&P 500. It is defined as price divided by the average of ten years of earnings, adjusted for inflation.
SPAC (Special Purpose Acquisition Company): A publicly traded company created to acquire an existing publicly traded company.
Tangible book value: Shareholders’ equity, or total assets excluding goodwill and other intangibles minus total liabilities.
Trailing twelve months (TTM): Typically used in relation to the last year’s financial performance.
Unlevered free cash flow: Free cash flow available to a business before paying its financial obligations such as interest on borrowings.
Volume weighted average price (VWAP): Calculated by adding the total dollars traded for every transaction and dividing by the total shares traded.
Editor’s Note: The summary bullets for this article were chosen by Seeking Alpha editors.
Be the first to comment