

Oil-Fired Heating, And Not In A Good Way Mario Tama/Getty Images News
DISCLAIMER: This note is intended for US recipients only and, in particular, is not directed at, nor intended to be relied upon by any UK recipients. Any information or analysis in this note is not an offer to sell or the solicitation of an offer to buy any securities. Nothing in this note is intended to be investment advice and nor should it be relied upon to make investment decisions. Cestrian Capital Research, Inc., its employees, agents or affiliates, including the author of this note, or related persons, may have a position in any stocks, security, or financial instrument referenced in this note. Any opinions, analyses, or probabilities expressed in this note are those of the author as of the note’s date of publication and are subject to change without notice. Companies referenced in this note or their employees or affiliates may be customers of Cestrian Capital Research, Inc. Cestrian Capital Research, Inc. values both its independence and transparency and does not believe that this presents a material potential conflict of interest or impacts the content of its research or publications.
A Quick And Dirty Note On The Black Stuff
The reason oil is such an interesting commodity is because its price – particularly the futures pricing – speaks volumes about what’s going on in the world right now. More than the S&P, more than the Nasdaq, more than crypto. As a carrier tone into which the rest of the world’s signals are multiplexed, there’s no finer domain than oil. This is, of course, because literally everything is made of oil. OK, not everything-everything, but even if you like your breakfast to comprise avo-on-toast with a side of pumpkin latte? Still a whole buncha oil sat on your breakfast table right there. And because everything is made of oil, butterfly wings flapping in Riyadh can cause Wave 2 tsunamis in Connecticut, just as a tremor in the Permian can cause a Richter Scale event in Germany.
First up, let’s deal with what’s happening in the United States Oil Fund (NYSEARCA:USO) on a standalone basis. We can just chart this out and consider some next directions for the name, and think about some price targets and risk management strategies. No problem. But then let’s go on to see what other information this particular mux might be bringing to us.
Open a full page version of this chart, here – and allow us to walk you through it.
USO Chart (TrendSpider, Cestrian Analysis)
From the deep dark days of the COVID lows the fund puts in a 5-wave up cycle which completed in early June, right around the time that the S&P500 (SPY) and the Nasdaq-100 (QQQ) found their 2022 lows. The long energy, short equities trade of H1 2022 has truly been one of the all-time great rotations. We salute Big Money for its genius here. In late 2021 it was clear that many growth names would get hit; any sensible investor got busy rebalancing toward value – that turned out to be a useless strategy. Unless you were long energy in H1 2022, and/or short stocks, you were toast, simple.
The picture has gotten more complicated as the second half of the year has progressed. We called a short XLE strategy successfully in our Growth Investor Pro service and later wrote it up here. We felt at the time that this was a short-term play because oil and energy would in our view reverse the losses and go on to make new-for-22 highs. So far that has not happened.
Now, if USO simply follows a regular Fibonacci chart pattern, we may expect it to reverse upwards at maybe the 0.382 retrace of that post-COVID crisis move up – that’s a couple dollars down from here – or maybe at the 0.5 ($54), the 0.618 ($45) or the 0.786 ($33) retracement levels. The price will tell you when it’s ready to reverse and you will have the opportunity to go long at that point, with a stop or a hedge placed just below the nearest Fib retracement level below where you go long. So far, so 101.
The question is, why is oil in decline? Because it ran up? Sure, that can be enough. But vs. all history, USO is still at a low level. (Full page version, here.)
USO Chart (TrendSpider, Cestrian Analysis)
So it’s hardly gotten carried away with itself.
Of interest is the fact that USO has come down to the level it hit right before the Russian invasion of Ukraine in February. See the aircraft indicators on the chart at the top.
Wheat (here we use the ETF, WEAT) has also given up its Ukraine-invasion spike and returned to trend. Full page chart, here.
WEAT Chart (TrendSpider, Cestrian Analysis)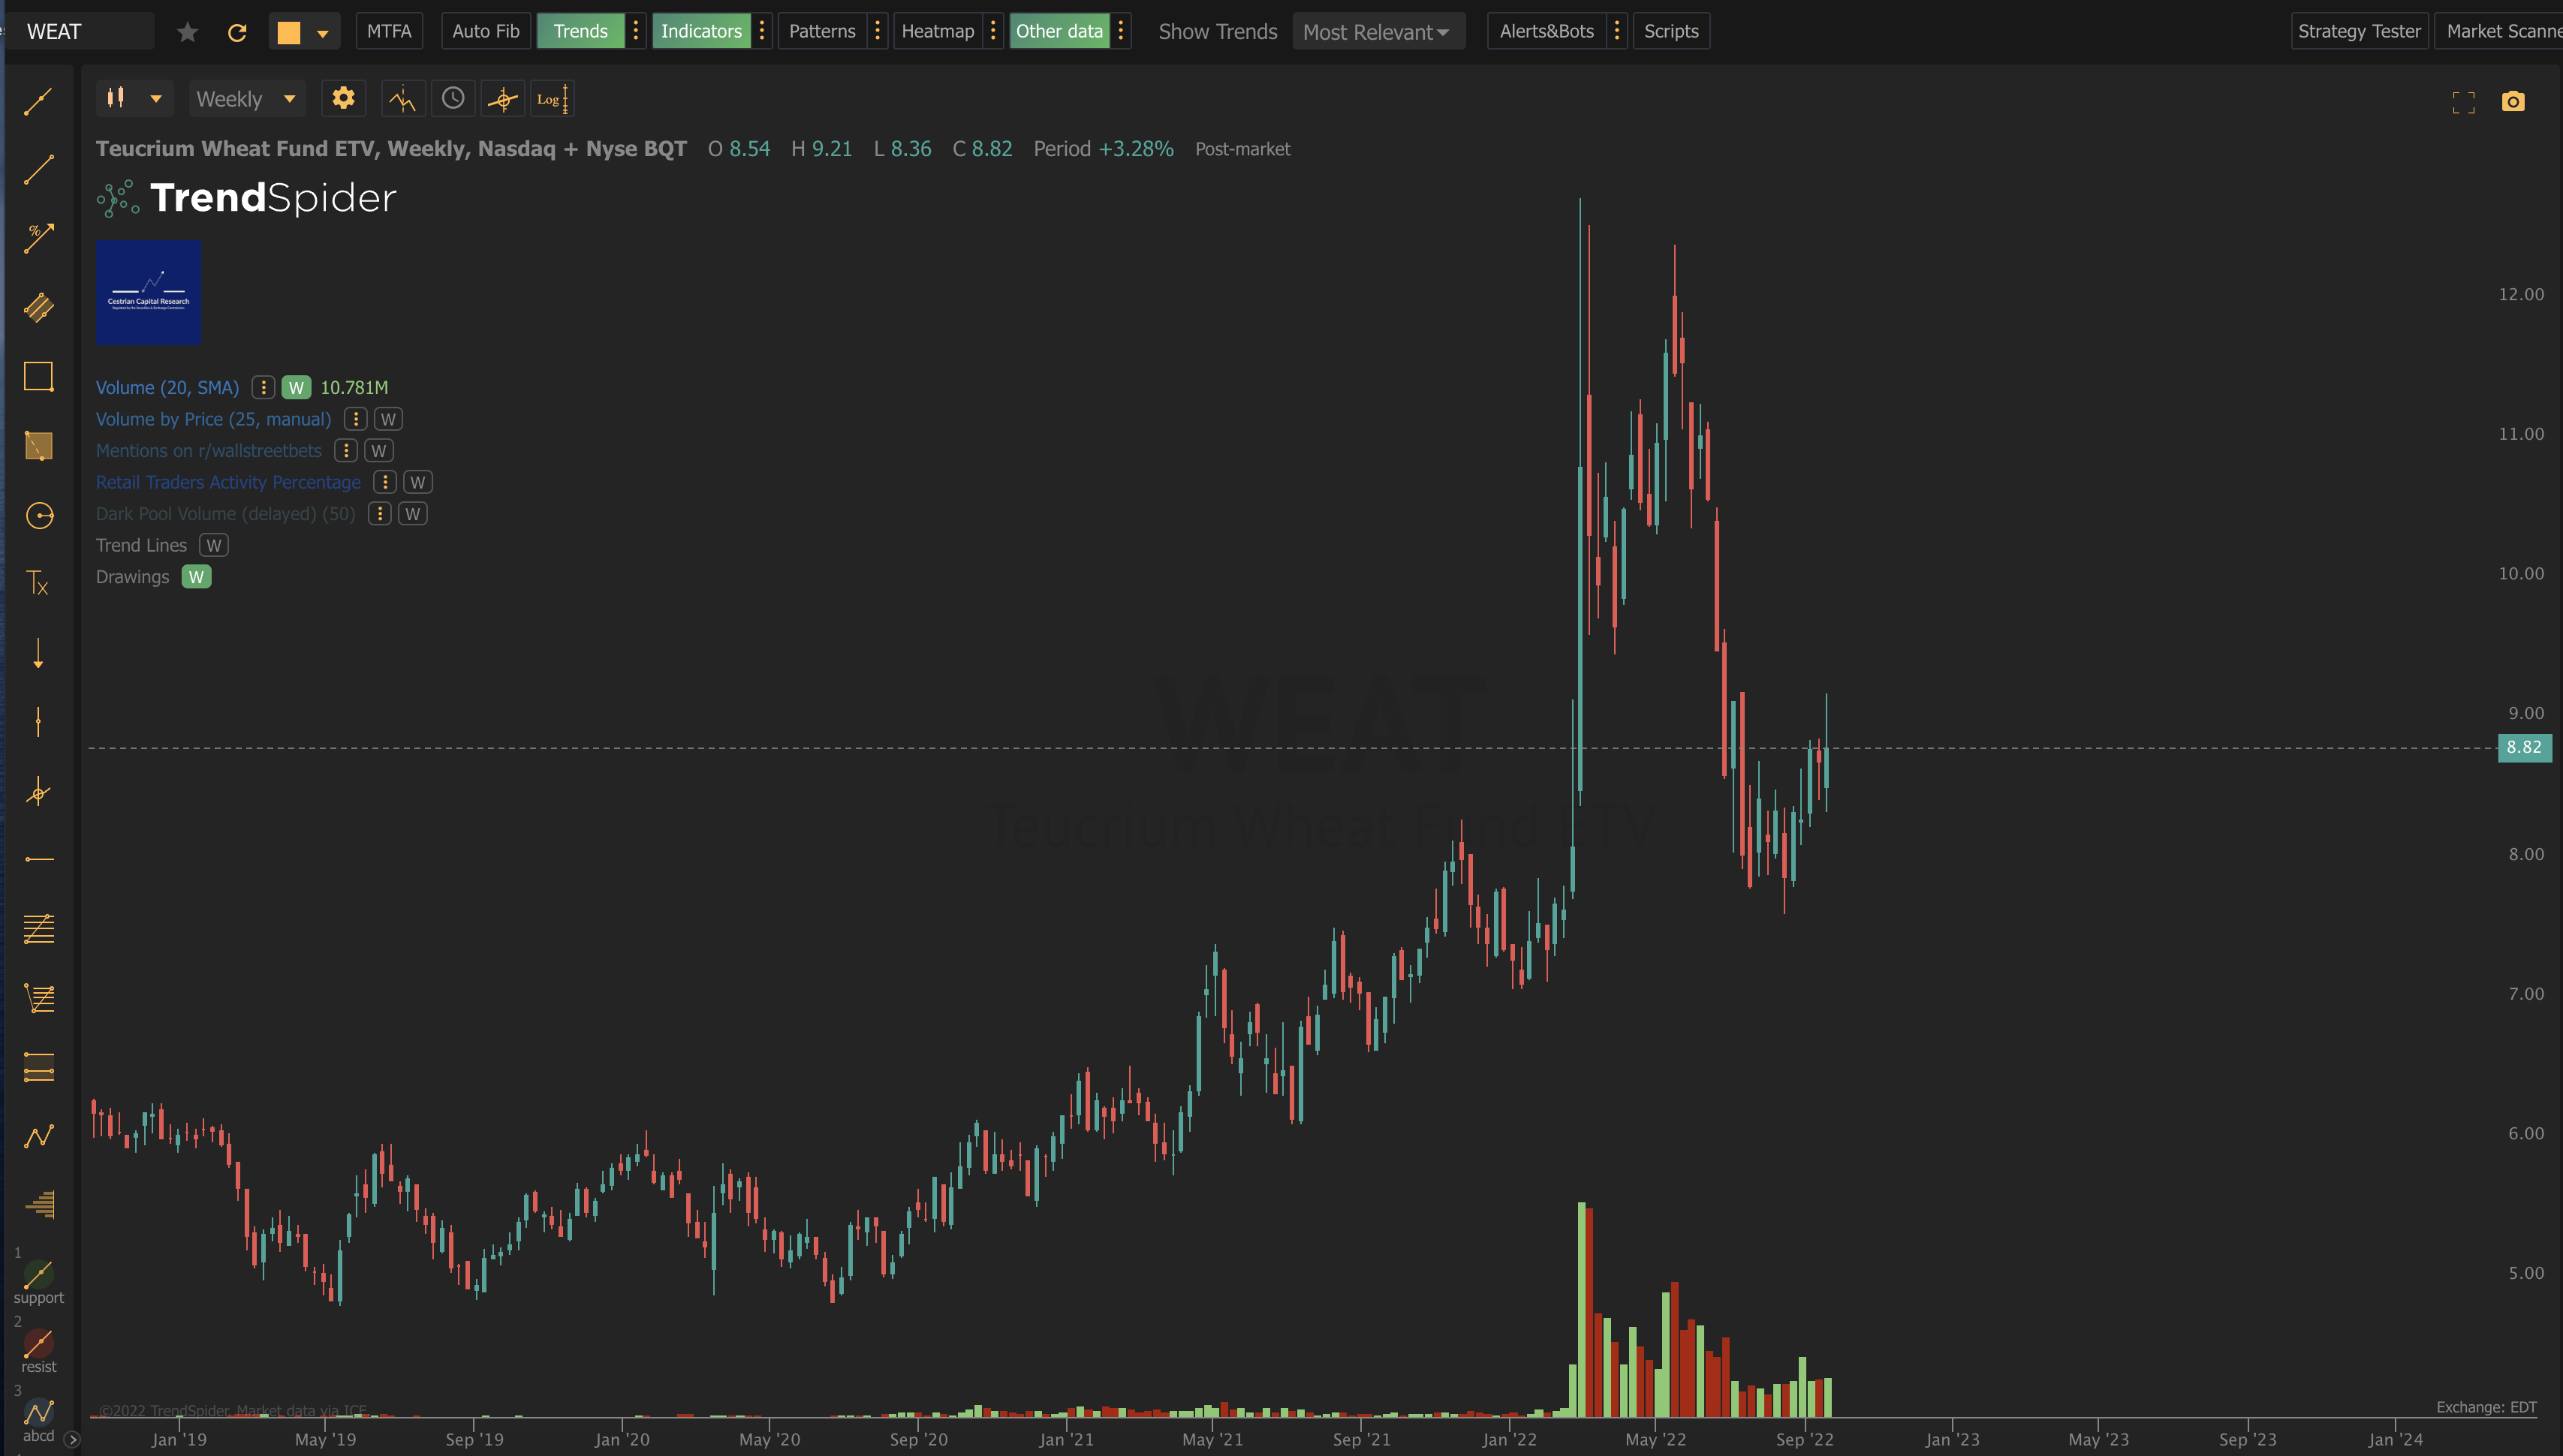
This at a time when the situation in Ukraine holds a less certain outcome than has been the case from inception.
USO in our view is signaling either:
- An impending US recession that would materially hit demand for oil, and/or
- A flood of supply of oil coming into the market from existing non-sanctioned suppliers to materially hit the price, and/or
- A structural change in the current sanctions such that the oil price comes down across the board as a result of increased volumes available once more.
For what it’s worth we do not believe in the US-is-doomed narrative. As non US natives we have seen the US dig itself out of its own problems only to succeed again too many times to believe this America-is-done rhetoric that is washing about the place (from all political persuasions it might be added). There’s truth still to the America of Hollywood – originally the America of de Tocqueville – and we don’t think a crushing recession is due anytime soon.
Increased supply from OPEC and co? Why would they? Now is a time to press the advantage with the US, when Russia sanctions are causing pain at home and pressure on the American consumer is translating to pressure on American politicians. So no, we don’t buy that either.
We do think there may be shifting sands in the Ukraine invasion and if true we do think that can increase the supply of non-sanctioned oil. Not back to 2021 levels, since whatever happens next in Ukraine it’s hard to imagine a straightaway resumption of trading flows with Russia – but at a level higher than now. There’s pressure from China upon Russia – and again China is a short-term beneficiary of discount oil from Russia, so their self interest has frontiers beyond the immediate, extending toward their trade with hard-hit Europe – and that pressure can be more effective than Western sanctions, in our view.
For this reason we rate USO at Hold. In the larger degree the fund is way down the scale, and oil is hardly going away as a core part of the economy. Even Lululemon yoga pants are made of oil. We may see more short-term weakness if the Ukraine situation improves, but we see no real reason for a vertiginous drop from here. We think risk assets will recover before too long and with that the recession specter may recede and the downward pressure on USO go with it.
If you’re minded to play short in the short term, you could do so looking to the next Fibonacci level down – that would mean shorting here with a view to profit-taking around $55 (and don’t forget to protect your downside with a buy-stop a little above here) – for what it’s worth we think there are better uses of capital in today’s market, like positioning for a rebound in risk assets. So – Hold on USO for us.
Cestrian Capital Research, Inc – 23 September 2022.
Be the first to comment