

CreativaStudio/E+ via Getty Images
In this analysis of Overstock.com, Inc. (NASDAQ:OSTK), we covered the company following its poor quarterly earnings in 2022 which were down by 33.23% YoY in Q3 2022 and below are our revenue projections for the company. Firstly, we compared the top 10 US e-commerce companies by market share and Overstock based on revenue growth performance in Q3 2022, analyst consensus difference, stock price change and revenue guidance for Q4 2022. Moreover, we analyzed the e-commerce industry growth in terms of total sales and compared it with retail sales. Finally, we analyzed Overstock’s revenue growth based on active customers and revenue per customer growth and updated our forecast for the company.
Poor Performance Compared to Competitors
|
Company |
Revenue Market Share (Q3 2022) |
Revenue YoY Growth % (Q3 2022) |
Analyst Consensus Difference (Q3 2022) |
Stock Price Change (Q4 2022) |
Guidance (Q4 2022) |
|
Amazon (AMZN) |
30.89% |
10.73% |
-0.29% |
-17.34% |
5.0% |
|
eBay (EBAY) |
0.89% |
-4.84% |
2.51% |
22.36% |
-2.5% |
|
Etsy (ETSY) |
0.22% |
11.66% |
5.40% |
20.15% |
3.0% |
|
Wayfair (W) |
1.07% |
-9.01% |
1.08% |
-1.63% |
-7.5% |
|
Qurate (QRTEA) |
1.03% |
-12.72% |
-5.13% |
12.94% |
N/A |
|
Chewy (CHWY) |
0.95% |
14.46% |
2.94% |
34.11% |
10.5% |
|
Overstock |
0.17% |
-33.23% |
-2.66% |
-20.49% |
N/A |
|
Stitch Fix (SFIX) |
0.17% |
-21.61% |
-0.86% |
-21.27% |
-19.7% |
|
1-800-Flowers (FLWS) |
0.11% |
-1.87% |
2.65% |
47.30% |
-5.0% |
|
Revolve (RVLV) |
0.10% |
10.08% |
4.27% |
2.63% |
3.0% |
|
Average |
3.56% |
-3.64% |
0.99% |
7.88% |
-1.7% |
Source: Company Data, Seeking Alpha, Khaveen Investments
In the table above, we compiled the top 10 US e-commerce companies based on revenue market share to compare their performance in terms of revenue growth, analyst consensus difference and stock price change. Moreover, we then compared their outlook based on their Q4 guidance.
As seen above, 4 companies within the top 10 had positive revenue growth rates YoY except for Overstock, eBay, Stitch Fix and 1-800-Flowers. Moreover, 6 companies beat analyst revenue consensus except for Overstock, Amazon, Qurate and Stitch Fix. While Overstock’s revenue declined by 33%, its stock price had only decreased by 20.5% in Q4 and the company did not provide guidance. Overstock performed the worst among the top 10 companies with the lowest growth rate of -33% while its competitor Wayfair also contracted.
Besides Overstock, its competitor Wayfair also underperformed in Q3 2022. In our previous analysis on Wayfair, we highlighted the decline in…
PCE growth for Furnishings and durable household equipment had declined in Q1 and Q2 2022 at -4.9% and -4.8% YoY but had improved slightly in Q3 2022 at -1.7%.
Thus, we believe the decline in consumer spending on home furnishing could be a factor in Overstock’s underperformance.
E-Commerce Industry Showing Signs of Bouncing Back
US Census Bureau, Khaveen Investments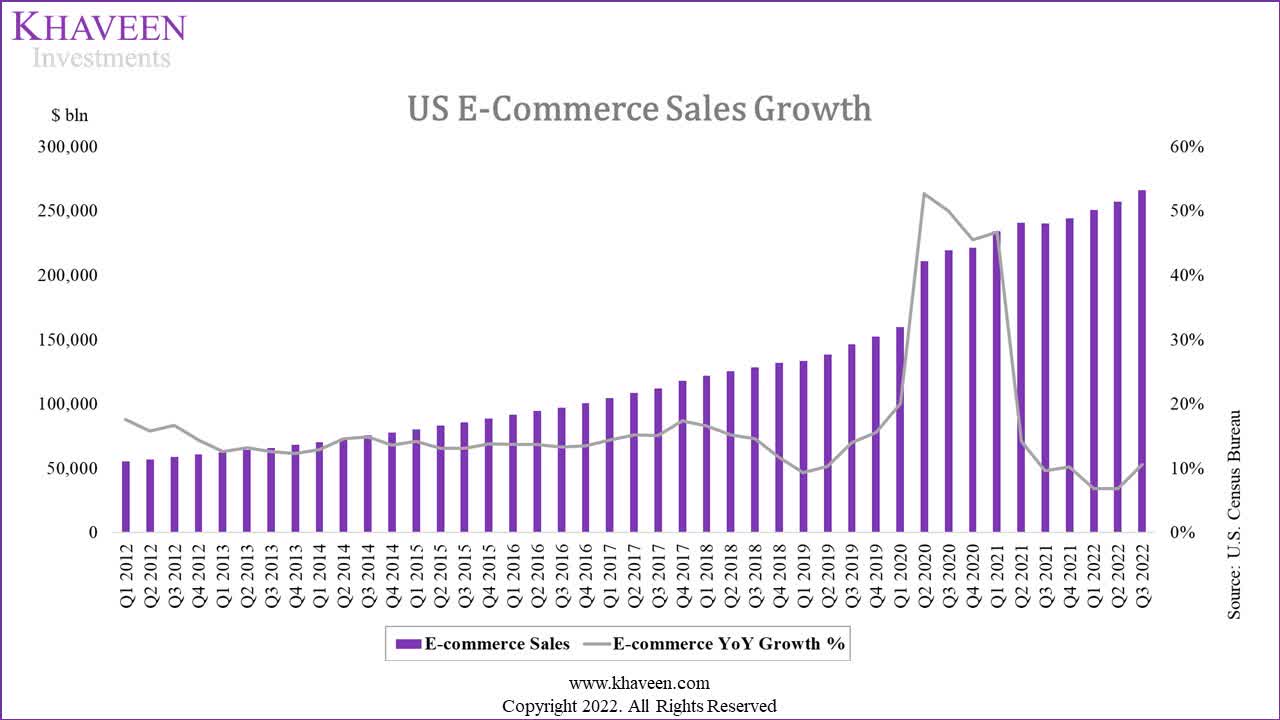
|
Retail Sales ($ mln) |
Q1 2021 |
Q2 2021 |
Q3 2021 |
Q4 2021 |
Q1 2022 |
Q2 2022 |
Q3 2022 |
|
Retail Sales |
1,575,288 |
1,659,350 |
1,642,648 |
1,684,796 |
1,745,338 |
1,780,176 |
1,790,616 |
|
YoY Growth % |
17.00% |
28.61% |
12.80% |
14.88% |
10.79% |
7.28% |
9.01% |
|
E-commerce Sales |
234,440 |
240,911 |
240,368 |
244,144 |
250,424 |
257,283 |
265,947 |
|
E-commerce YoY Growth % |
46.66% |
14.17% |
9.62% |
10.26% |
6.82% |
6.80% |
10.64% |
|
E-commerce as % of Retail Sales % |
14.88% |
14.52% |
14.63% |
14.49% |
14.35% |
14.45% |
14.85% |
Source: US Census Bureau, Khaveen Investments
Based on the chart, the US e-commerce sales growth had surged in 2020 during the pandemic as consumers shifted to online purchases but had slowed down since Q2 2021 with the reopening of physical retail stores. In Q3 2022, the e-commerce total sales grew by 10.64% YoY which was the highest growth rate since Q3 2021. In comparison, the top 10 e-commerce companies had a negative average growth of -3.64% in the period. This is among the top 10 companies, Amazon has the largest share (30.89%) and grew strongly by 10.7% in the period while Wayfair, the second highest, only has a market share of 1%.
In terms of total retail sales, the US total retail sales grew by 9.01% YoY in Q3 2022. Globally, the SDG Group forecasts retail sales to grow by 4.8% in 2023. According to Fitch Ratings,
post-pandemic budget shifts toward services are expected to continue following the strong volume of goods purchased in the past few years.
Moreover, the e-commerce industry could also be faced with several headwinds for the year.
While macroeconomic indicators point to a still-healthy consumer, metrics such as savings, employment, and real wage growth are likely to moderate from currently strong levels.
US Census Bureau, Khaveen Investments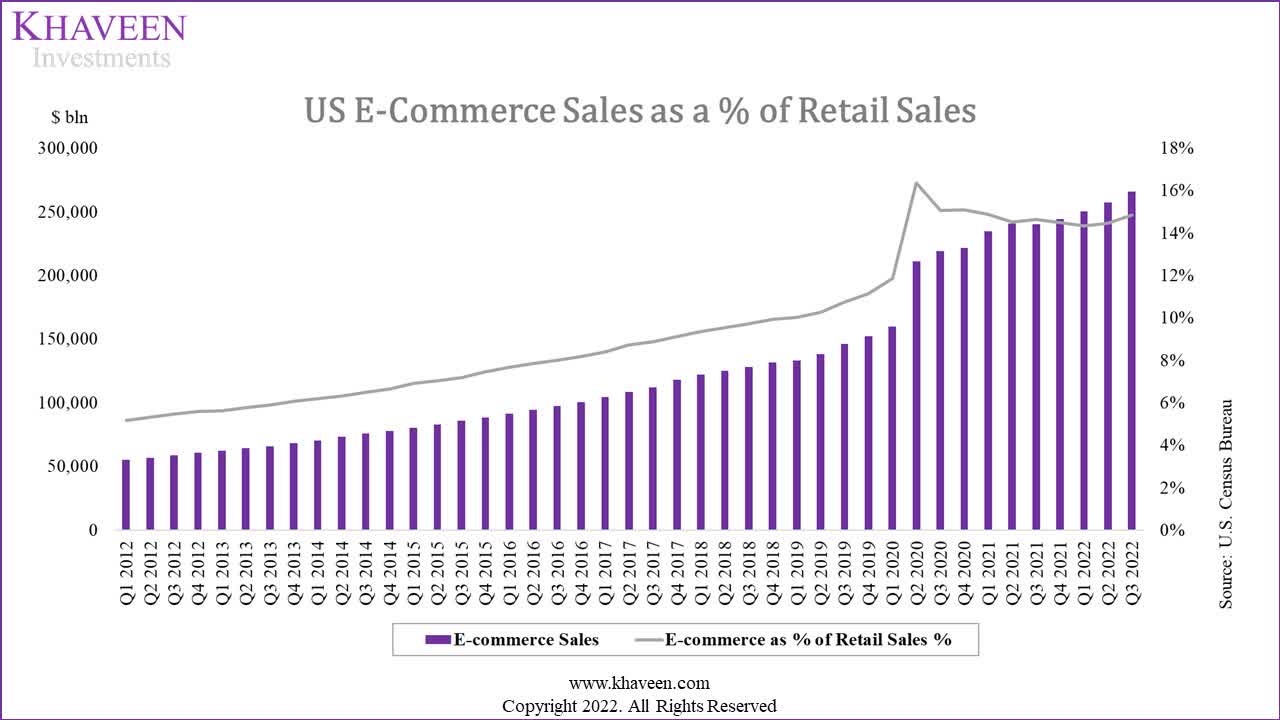
The total e-commerce sales as a % of total retail sales increased to 14.85% in Q3 2022 as e-commerce sales growth outpaced retail sales and were the highest since Q1 2021. Thus, we believe this indicates a potential recovery in the e-commerce industry with its accelerating growth in Q3 2022. According to Google Mobility Report, mobility trends for the retail & recreation category were only 8% below the baseline (pre-pandemic) levels and had plateaued, indicating the shift back from consumers towards physical retail to be nearly completed. Furthermore, based on our previous analyses, we expect the growth of e-commerce sales to continue outpacing retail sales due to several factors which are:
- Rising global internet penetration rate
- Rising smartphone ownership and usage
- Growth in consumer retail spending
- Shifting consumer behavior toward e-commerce
|
Global Internet Retail Sales Forecast ($ bln) |
2022F |
2023F |
2024F |
2025F |
2026F |
|
Total Retail Sales |
29,104 |
30,501 |
31,764 |
33,079 |
34,448 |
|
Growth % |
5.0% |
4.8% |
4.1% |
4.1% |
4.1% |
|
Retail E-commerce Sales |
5,733 |
6,344 |
6,956 |
7,608 |
8,268 |
|
Growth % |
10.0% |
10.7% |
9.6% |
9.4% |
8.7% |
|
Penetration Rate |
19.7% |
20.8% |
21.9% |
23.0% |
24.0% |
Source: eMarketer, SDG Group, Khaveen Investments
In the table above, we updated our forecast of the global internet retail industry sales based on data from eMarketer which projected the internet retail sales penetration rate to reach 24% by 2026. We forecasted the total retail sales in 2023 based on the market forecast of 4.8% by SDG Group and a 4.1% average growth rate beyond that. Overall, we see internet retail sales growing by 10.7% in 2023 and a 4-year forward average of 9.6%.
Declining Customer Base and Slowdown in Spending per Customer
|
Overstock Revenue ($ mln) |
2019 |
2020 |
2021 |
2022F |
Average |
|
Customers |
5.1 |
9.2 |
8.1 |
5.7 |
|
|
Growth % |
80.4% |
-12.0% |
-29.3% |
13.0% |
|
|
Revenue per Customer |
281 |
271 |
340 |
355 |
|
|
Growth % |
-3.7% |
25.5% |
4.3% |
8.7% |
|
|
Revenue |
1,435 |
2,494 |
2,756 |
2,033 |
|
|
Growth % |
73.8% |
10.5% |
-26.3% |
19.4% |
Source: Overstock, Khaveen Investments
Based on the table above, we prorated Overstock’s active customers in 2022 from its Q1 to Q3 growth to derive 5.7 mln customers in Q4 2022. Furthermore, we prorated its revenue from Q1 to Q3 2022 to obtain our full-year revenue forecast of $2,033 mln and calculated its revenue per customer of $355 in 2022.
As seen in the table, the company had strong growth in 2020 during the pandemic supported by active customer growth despite a slight decline in revenue per customer. Thus, its customer growth had been its key revenue growth driver. However, since 2021, its customer growth had been negative and we forecasted its decline to accelerate in full-year 2022 while its revenue per customer grew positively in 2021 and 2022. This is as the company highlighted its AOV increase due to a favorable mix of its home products.
Our AOV during this highly inflationary time was primarily driven by the mix within our home product assortment. – Adrianne Lee, Chief Financial Officer
Thus, we believe its customer growth had been its key driver of revenue as it supported its strong growth surge in 2020 but revenue growth had slowed down from 2021 onwards as customer growth slowed down and contracted.
According to management, it highlighted its active customers decline due to weak consumer sentiment, consumer shift towards services and its strategy to exit non-home products.
First, consumer sentiment toward discretionary spending has been weak this year due to high inflation and consumer staples. The impact of this has been compounded by difficult comparisons from pandemic-related shopping behavior last year. Second, consumers shifted spending to experiences and services. And third, our strategy to exit non-home products. – Adrianne Lee, Chief Financial Officer
|
Overstock Revenue Forecast ($ mln) |
2019 |
2020 |
2021 |
2022F |
2023F |
2024F |
2025F |
|
Customers |
5.1 |
9.2 |
8.1 |
5.7 |
5.9 |
6.1 |
6.4 |
|
Growth % |
80.4% |
-12.0% |
-29.3% |
3.6% |
3.5% |
3.4% |
|
|
Customer Increase |
4.1 |
-1.1 |
-2.4 |
0.2 |
0.2 |
0.2 |
|
|
Revenue per Customer |
281 |
271 |
340 |
355 |
386.0 |
419.7 |
456.3 |
|
Growth % |
-3.7% |
25.5% |
4.3% |
8.7% |
8.7% |
8.7% |
|
|
Revenue |
1,435 |
2,494 |
2,756 |
2,033 |
2,290 |
2,578 |
2,898 |
|
Growth % |
73.8% |
10.5% |
-26.3% |
12.7% |
12.6% |
12.4% |
Source: Overstock, Khaveen Investments
We forecasted the company’s customers through 2025 based on a 3-year average customer increase of 0.2 mln per year and its revenue per customer growth based on its 3-year average growth of 8.7%. This results in a total revenue growth forecast of a 3-year forward average of 12.6% as we expect the trend in home furnishing spending to recover in 2023 onwards.
Risk: Negative Customer Satisfaction
|
Company |
NPS Score |
|
Wayfair |
-48 |
|
Overstock |
-2 |
|
Home Depot (HD) |
24 |
|
Lowe’s (LOW) |
9 |
|
Bed Bath & Beyond (BBBY) |
-58 |
|
Average |
-14.6 |
Source: Comparably, Khaveen Investments
We compared the NPS scores of the company and its competitors in the table above. Based on the table, Overstock has a negative NPS score of -2 which indicates its low customer satisfaction rating but is still higher than the average of its competitors due to the low scores of Wayfair and Bed Bath & Beyond. Thus, we believe this could pose a risk to its revenue growth outlook.
Verdict
Khaveen Investments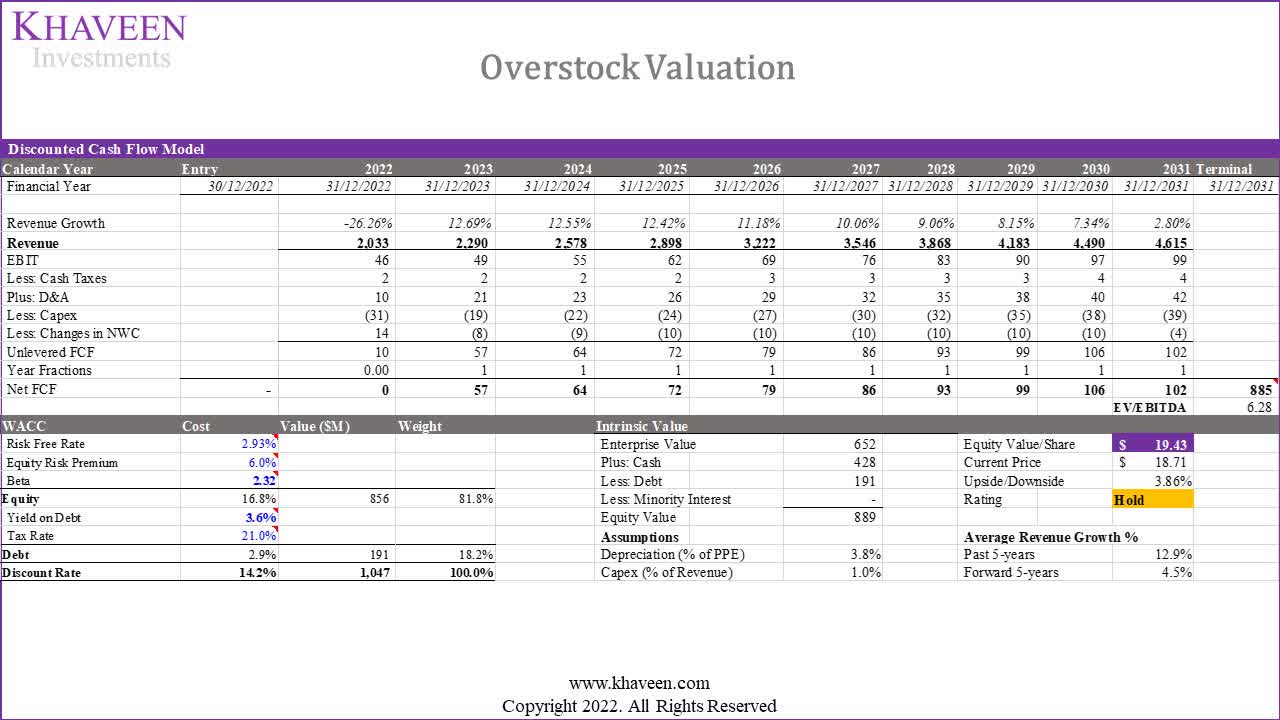
All in all, Overstock performed the worst among the top US e-commerce companies with the lowest growth rate of -33% in Q3 2022 and we believe one factor could be due to the decline in the home furnishing market as its competitor Wayfair also contracted. However, the e-commerce industry had positive growth in Q3 2022 and strengthened compared to the previous quarter. We see the global internet retail industry growing by 10.7% in 2023 and a 4-year forward average of 9.6%.
Furthermore, we determined the company’s revenue contraction in 2022 to be driven by its declining customer base despite positive revenue per customer growth. We updated our revenue growth forecast of a 3-year forward average of 12.6% as we expect the home furnishing market to recover but still below its 5-year average of 12.9%. Based on that, we updated our valuation with a DCF analysis with our revised revenue growth forecasts and terminal value based on the home furnishing average EV/EBITDA of 6.28x. We obtained a price target of $19.43 with a limited upside of 3.86% and rated the company as a Hold.
Be the first to comment