

Michael Vi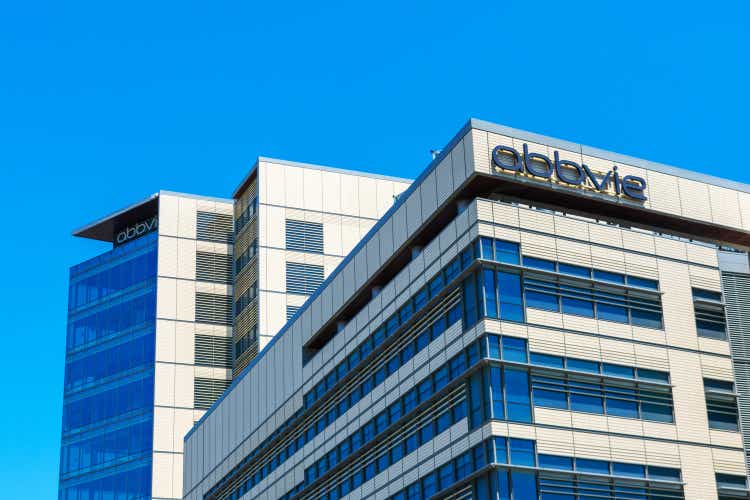
AbbVie (NYSE:ABBV) investors are having a good year, despite the stock’s 18.5% decline from the 2022 high closing price on April 18th. Over the past 12 months, ABBV has returned a total of 36.6% vs. 20.6% for the drug manufacturer industry group (as tracked by Morningstar) and -9.9% for the S&P 500 (SPY). As an additional point of comparison, the Healthcare Select SPDR ETF (XLV), in which ABBV is the 4th largest holding, has returned a total of -2.6% over the past year.
Seeking Alpha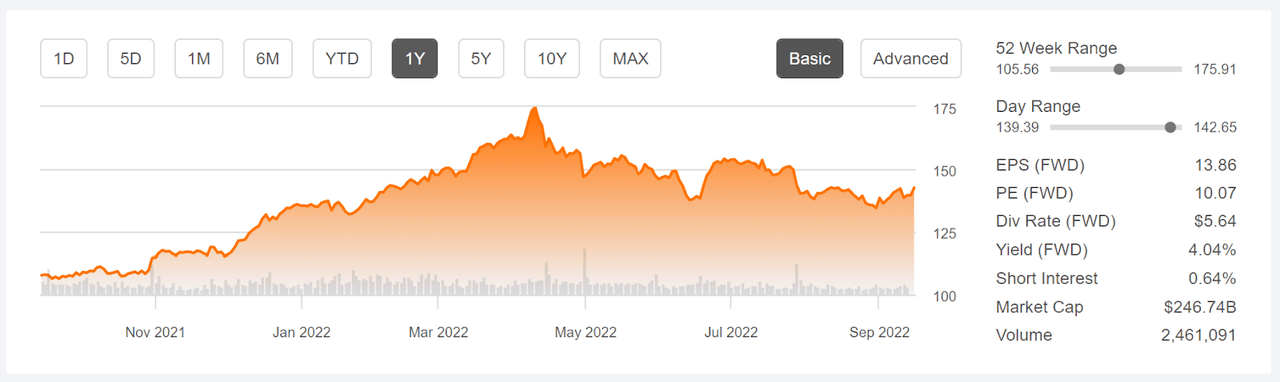
12-Month price history and basic statistics for ABBV (Source: Seeking Alpha)
As is typical for drug manufacturers, ABBV’s prospects are determined by the company’s pipeline of drugs in development and on the products that are coming off patent or for which biosimilars have been, or are expected to be, released to market. ABBV’s Humira, a global blockbuster, comes off patent in 2023, and there are a number of biosimilar drugs expected to compete with Humira in the U.S. There are already biosimilars in the markets outside of the U.S. For the Q2 results, reported on July 29th, Humira sales continue be huge. Skyrizi and Rinvoq, ABBV’s 2 other top sellers, also delivered robust revenue growth.
Seeking Alpha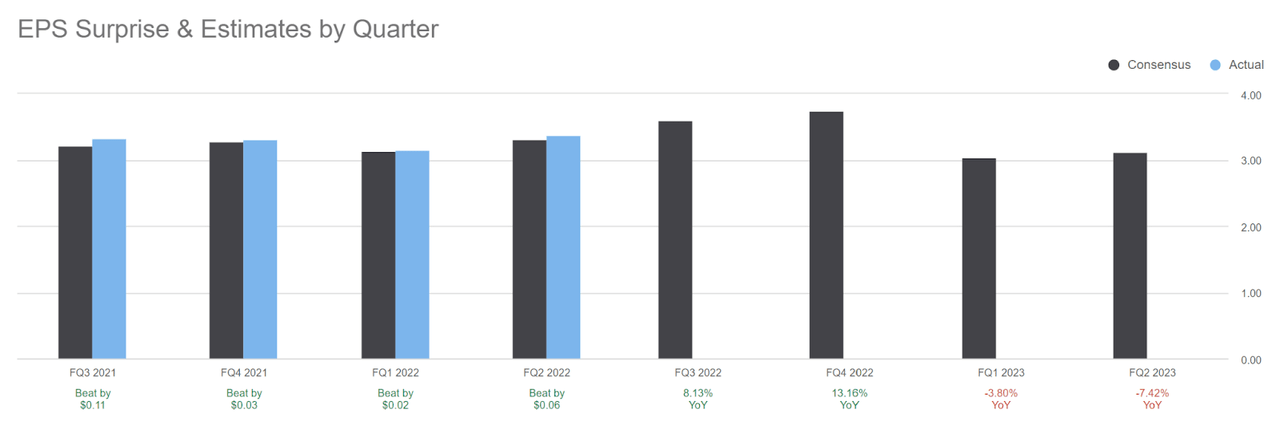
Consensus estimates and actual quarterly EPS for ABBV (Source: Seeking Alpha)
Looking ahead to 2023 and beyond, the consensus outlook is for ABBV to grow EPS at an anemic +0.64% per year over the next 3 to 5 years. The declining growth is primarily due to the challenges associated with replacing the declining revenues from Humira in the next several years. ABBV has a well-diversified portfolio of drugs, across 4 major business segments: immunology, oncology, neuroscience, and aesthetics. Humira, part of the immunology portfolio, is far and away the dominant revenue source for the company, however. Humira net revenues for Q2 were $5.4B of the company’s worldwide net revenues of $14.6B.
Income investors may favor ABBV because of the company’s substantial dividend and the high dividend growth rate. The forward dividend yield is 4.04% and the trailing 3- and 5-year dividend growth rates are 9.9% and 17.5% per year, respectively.
I last wrote about ABBV on February 14, 2022, 7 months ago, at which time I maintained a buy rating. Since the close on February 14th, ABBV has returned +1.4% (including dividends) vs. -10.4% for the S&P 500. At that time, the Wall Street consensus rating for ABBV was a buy, but the recent substantial gains in the shares left only 3% in potential price appreciation to reach the 12-month consensus price target. The company had also turned in an extended run of quarter-to-quarter earnings gains. Along with looking at fundamentals and the Wall Street consensus outlook, I also rely on a probabilistic price return outlook that is calculated using the prices of call and put options on a stock, the market-implied outlook. In mid-February, the market-implied outlook for ABBV to mid-June was bullish and the outlook to mid-January of 2023 was slightly bullish. Even though the Wall Street consensus outlook was for very little price appreciation over the next year, I was convinced to maintain my buy rating on ABBV because of the bullish market-implied outlooks.
For readers who are unfamiliar with the market-implied outlook, a brief explanation is needed. The price of an option on a stock is largely determined by the market’s consensus estimate of the probability that the stock price will rise above (call option) or fall below (put option) a specific level (the option strike price) between now and when the option expires. By analyzing the prices of call and put options at a range of strike prices, all with the same expiration date, it is possible to calculate a probabilistic price forecast that reconciles the options prices. This is the market-implied outlook. For a deeper explanation and background, I recommend this monograph published by the CFA Institute.
With 2 additional quarters of reported revenues and earnings since my last post, I have calculated updated market-implied outlooks for ABBV and I have compared these with the current Wall Street consensus outlooks in updating my rating.
Wall Street Consensus Outlook for ABBV
ETrade calculates the Wall Street consensus outlook for ABBV using the views of the 13 ranked analysts who have published ratings and price targets over the past 3 months. The consensus rating is a buy, as it has been for all of the past year, and the consensus 12-month price target is 11.8% above the current share price. The 12-month price target has risen 8.3% over the past 7 months, going from $148.29 to $160.54.
ETrade
Wall Street analyst consensus rating and 12-month price target for ABBV (Source: ETrade)
Seeking Alpha’s version of the Wall Street consensus outlook is calculated by aggregating price targets and ratings from 24 analysts who have published their views over the past 90 days. The consensus rating is a buy and the consensus 12-month price target is 10.4% above the current share price.
Seeking Alpha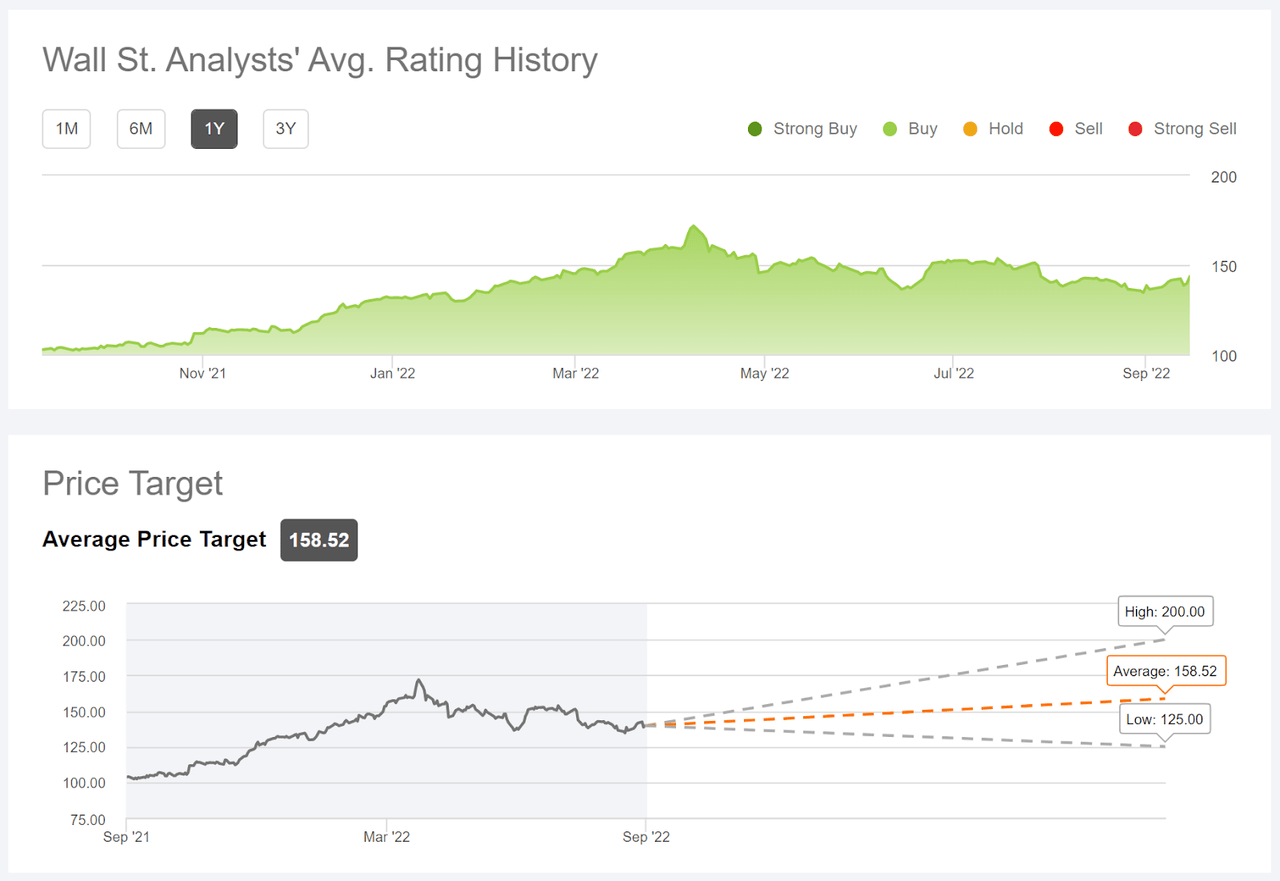
Wall Street analyst consensus rating and 12-month price target for ABBV (Source: Seeking Alpha)
Adding ABBV’s forward dividend yield of 4.04%, the Wall Street consensus for expected total return is 15.1% over the next year (averaging the two results for the consensus price target). This is a substantial increase compared to the same figure back in February. The expected 15.1% over the next 12 months is moderately higher than the trailing 5-year annualized total return of 12.75% per year.
Market-Implied Outlook for ABBV
I have calculated the market-implied outlook for ABBV for the 4.2-month period from now until January 20, 2023 and for the 9-month period from now until June 16, 2023, using the prices of call and put options that expire on these dates. I selected these two dates to provide a view to the start and middle of 2023, as well as because the options expiring in January and June tend to be among the most liquid.
The standard presentation of the market-implied outlook is a probability distribution of price return, with probability on the vertical axis and return on the horizontal.
Geoff Considine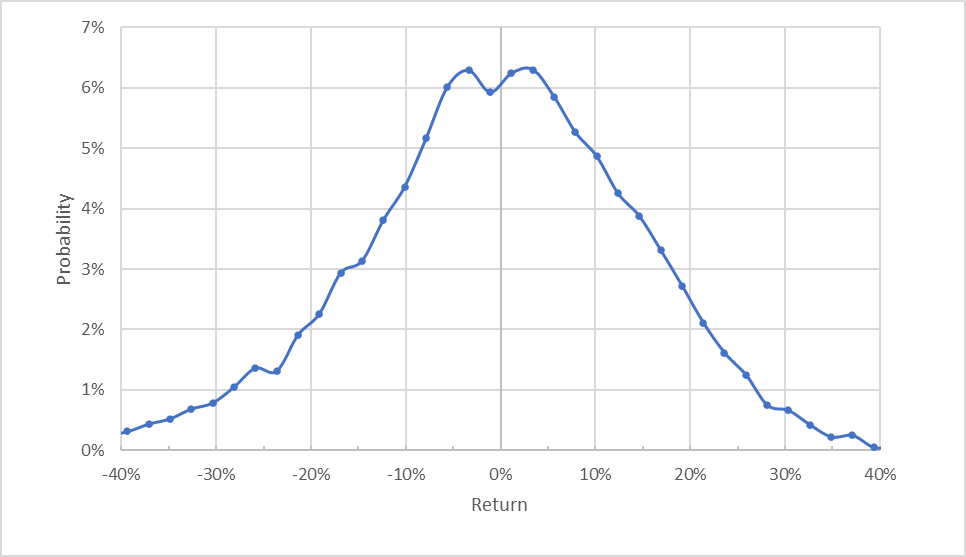
Market-implied price return probabilities for ABBV for the 4.2-month period from now until January 20, 2023 (Source: Author’s calculations using options quotes from ETrade)
The outlook for the next 4.2 months is generally symmetric, with comparable probabilities of positive and negative returns. The expected volatility calculated from this distribution is 26.8% (annualized), which is slightly higher than the value I calculated in March, 25%. The current volatility is quite low for an individual stock, indicating that the prevailing view in the options market is that the probability of substantial negative moves is fairly low as compared to other stocks.
To make it easier to compare the relative probabilities of positive and negative returns, I rotate the negative return side of the distribution about the vertical axis (see chart below).
Geoff Considine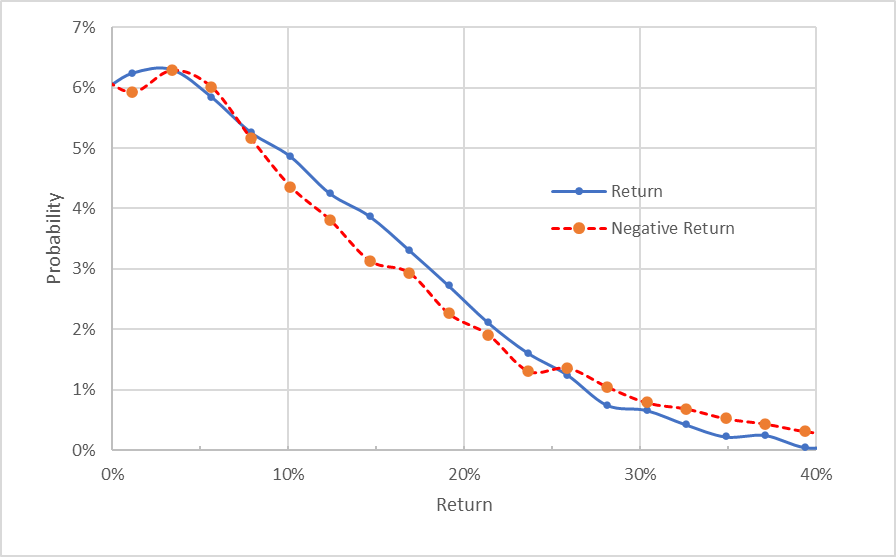
Market-implied price return probabilities for ABBV for the 4.2-month period from now until January 20, 2023. The negative return side of the distribution has been rotated about the vertical axis (Source: Author’s calculations using options quotes from ETrade)
This view shows that the probabilities of positive returns tend to be slightly higher than the probabilities of negative returns, across a range of the most-probable outcomes (the solid blue line is mostly above the dashed red line over the left ⅔ of the chart above). This is a bullish tilt to the market-implied outlook for the next 4.2 months. This outlook is qualitatively quite similar to the 4-month outlook back in March.
Theory indicates that the market-implied outlook is expected to have a negative bias because investors, in aggregate, are risk averse and thus tend to pay more than fair value for downside protection. There is no way to measure the magnitude of this bias, or whether it is even present, however. The expectation of a negative bias reinforces the bullish interpretation of this outlook.
The market-implied outlook for the next 9 months is quite similar to the shorter-term outlook, with a modest tilt in probabilities to favor positive returns. As in the previous case, this looks more bullish given the expectation of a negative bias in the market-implied outlook. The expected volatility calculated from this distribution is 27.8% (annualized), quite close to the 27% expected volatility for the 11.2-month outlook from my March analysis. The 9-month outlook to June 16, 2023 is more bullish than the 11.2-month outlook from March.
Geoff Considine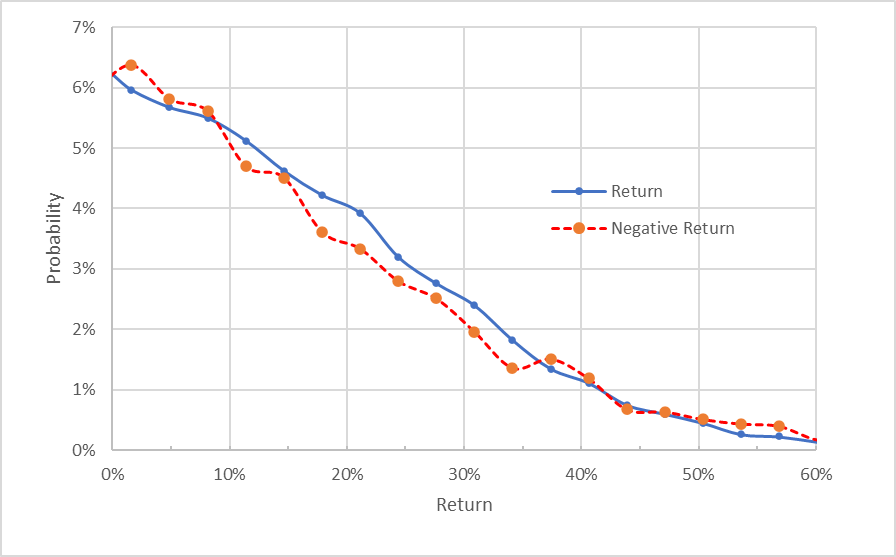
Market-implied price return probabilities for ABBV for the 9-month period from now until June 16, 2023. The negative return side of the distribution has been rotated about the vertical axis (Source: Author’s calculations using options quotes from ETrade)
The market-implied outlooks to early- and mid-2023 are both bullish, with expected volatility of 27%-28%. The current 4.2-month outlook is very similar to the 4-month outlook calculated in March. The current 9-month outlook is similar, but somewhat more bullish, than the 11.2-month outlook calculated in March. The options market appears to have become somewhat more optimistic with regards to ABBV’s prospects over the past 7 months.
Summary
ABBV has delivered solid earnings growth in recent years, substantially thanks to Humira, although Skyrizi and Rinvoq have also pulled their weight. The major concern with future earnings is the extent to which the expected decline in Humira sales, starting in 2023, will be offset with growth from other products. For 2022, Humira has continued to a large amount of income, although Humira sales outside of the U.S. have fallen as biosimilar drugs are increasingly available. The Wall Street consensus rating for ABBV continues to be a buy, and the consensus 12-month price target has risen over the past year, now implying an expected total return of 15.1% over the next year. As a rule of thumb for a buy rating, I want to see an expected 12-month total return that is at least ½ the expected volatility (27%-28%). Taking the consensus price target at face value, ABBV meets this criterion. The market-implied outlooks for the next 4.2 months and for the next 9 months are both bullish. While the expected decline in Humira sales is, of course, a concern, I am maintaining my buy rating on ABBV.
Be the first to comment