

Gold Price Talking Points
The price of gold clears the March low ($1890) as it trades to a fresh monthly low ($1882), and the precious metal may face a further decline over the coming days if the former resistance zone around the November high ($1877) fails to offer support.
Gold Price Outlook Mired by Failure to Defend March Low
The price of gold trades below the 50-Day SMA ($1940) for the first time since February despite the recent selloff in the US stock market, and it seems as though the deterioration in risk appetite will do little to shore up bullion as the Federal Reserve is widely expected to deliver a series of rate hikes over the coming months.
Source: CME
The CME FedWatch Tool reflects nearly 100% probability for a 50bp Fed rate hike on May 4 as the Federal Open Market Committee (FOMC) shows a greater willingness to normalize monetary policy at a faster pace, and developments coming out of the US may keep the price of gold under pressure as the update to the US Personal Consumption Expenditure (PCE) Price Index is anticipated to show a slowdown in inflation.
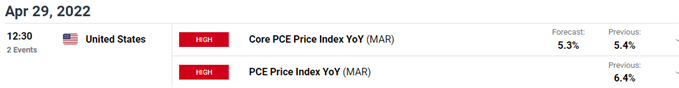
The core PCE, the Fed’s preferred gauge for price growth, is expected to narrow to 5.3% from 5.4% per annum in February, which would mark the first downtick since August, and the ongoing efforts by major central banks to tame inflation may continue to curb the appeal of gold as the FOMC “expects to begin reducing its holdings of Treasury securities and agency debt and agency mortgage-backed securities at a coming meeting.”
With that said, bullion may face headwinds ahead of the next Fed rate decision as market participants brace for higher US interest rates, and failure to defend the March low ($1890) raises the scope for a further decline in the price of gold as it trades below the 50-Day SMA ($1940) for the first time since February.
Gold Price Daily Chart
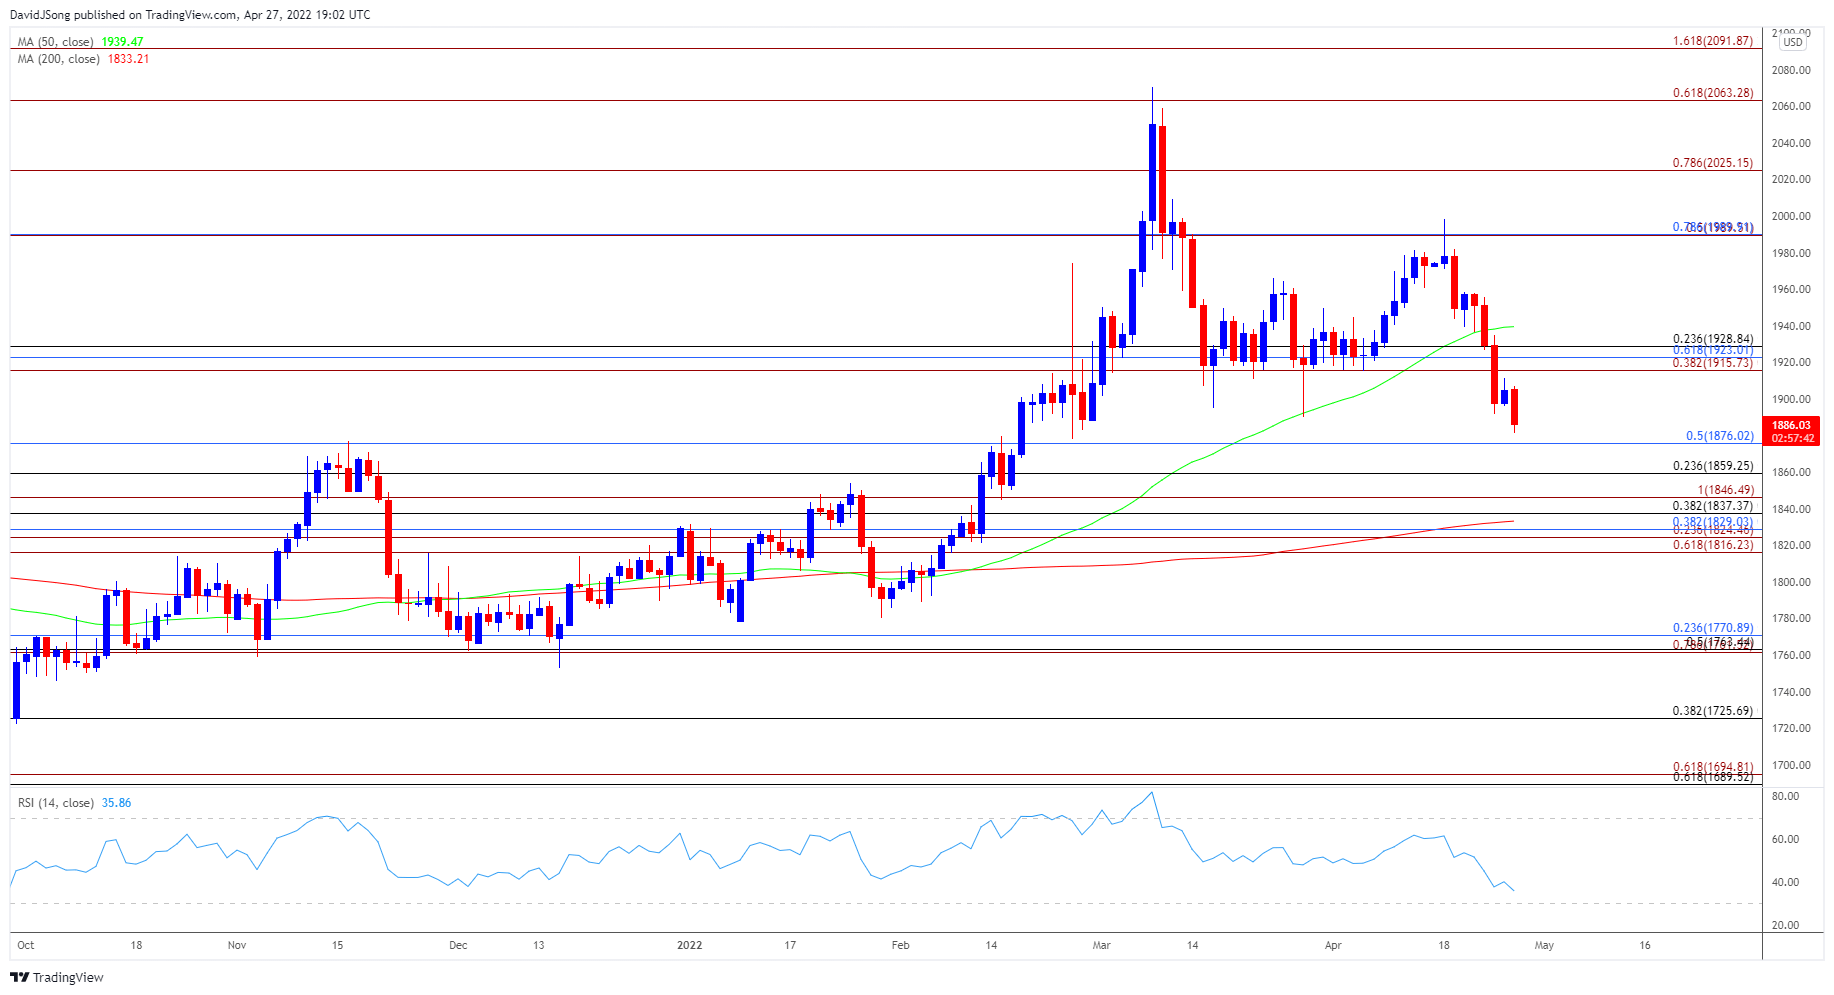
Source: Trading View
- The price of gold has reversed course after failing to test the record high ($2075), with the decline from the yearly high ($2070) generating a sell signal in the Relative Strength Index (RSI) as the oscillator fell back below 70.
- The price of gold clears the March low ($1890) as it trades below the 50-Day SMA ($1940) for the first time since February, with the precious metal coming up against the former resistance zone around the November high ($1877).
- A break/close below the $1876 (50% retracement) region opens up the $1859 (23.6% retracement) area, with the next zone of interest coming in around $1837 (38.2% retracement) to $1847 (100% expansion).
- Need a move back above the Fibonacci overlap around $1916 (38.2% expansion) to $1929 (23.6% retracement) to bring the topside targets back on the radar, with a move above the 50-Day SMA ($1940) opening up the $1990 (78.6% retracement) area.
Recommended by David Song
Traits of Successful Traders
— Written by David Song, Currency Strategist
Follow me on Twitter at @DavidJSong
Be the first to comment