

Morsa Images/DigitalVision via Getty Images
Introduction
We review our Otis Worldwide Corporation (NYSE:OTIS) investment case three months after our last review on September 2.
While Otis’ share price has risen sharply since troughing in late September, including a 22% gain since Q3 results were released on October 21, they remain 7% lower than a year ago:
|
Otis Share Price (Last 1 Year) 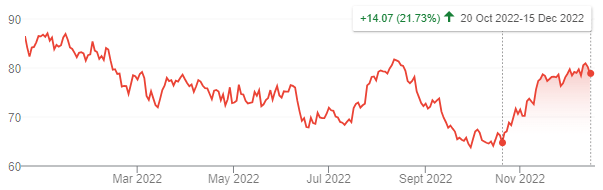 Source: Google Finance (15-Dec-22). |
We initiated our Buy rating on Otis in July 2020. Shares have gained 44% (including dividends) in the 2.5 years since.
Our investment case is broadly on track. Adjusted EPS is expected to grow of 3-5% in dollars in 2022, despite macro headwinds including a slowdown in China, elevated inflation and a stronger U.S. dollar – these have also moderated in recent weeks. Group EBIT margin is expected to expand 30 bps this year. Service revenues are expected to grow 6.0-6.5% organically, helped by structural drivers. New Equipment revenues will decline because of China, but show growing orders in the rest of the world. The European market looks solid despite the region’s larger macro headwinds. Otis shares are trading at 25.8x 2021 EPS and a 1.5% Dividend Yield. Our forecasts indicate a total return of 63% (17.9% annualized) by 2025 year-end. Buy.
Otis Buy Case Recap
Otis is the largest player by sales in the global elevator and escalator industry. We believe Otis and its peers to be high-quality businesses, thanks to the structural growth in demand from urbanization and connected services, recurring Maintenance and Modernization services (which generate most of the profits, except in China), a highly consolidated competitive landscape, and a capital-light manufacturing model that sources components from a network of suppliers.
Otis is different from its main competitor Kone (OTCPK:KNYJY) (also Buy-rated) in important ways:
- Much lower exposure to China (20% of 2021 Net Sales, vs. Kone’s 35%)
- Lower exposure to New Equipment (45% vs. 53%)
- More explicit EBIT margin expansion targets
- Ongoing program to lower its effective tax rate
- More optimized capital structure, with net debt and buybacks
|
Otis EBIT & Net Sales Breakdown (2021) 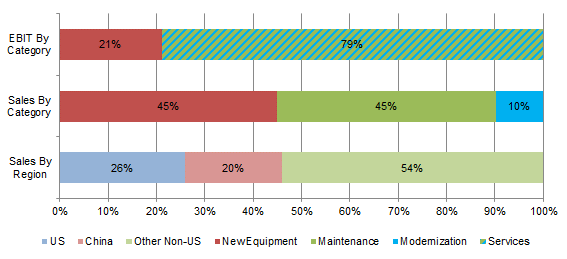 Source: Otis 10-K filing (2021). |
These differences, especially the lower exposure to the slowing Chinese construction market, mean Otis now has much better medium-term earnings growth potential than Kone.
Otis targets a 10%+ EPS CAGR in the medium term, as set out at its investor day in February, including:
- An organic sales CAGR in the low-to-mid single-digits
- An average Adjusted EBIT margin expansion of 40 bps annually
- A reduction in effective tax rate from 28.5% in 2021 to 25.0-27.0%
Both organic sales growth and EBIT margin expansion are expected to be driven by the Service segment.
|
Otis Medium-Term Outlook 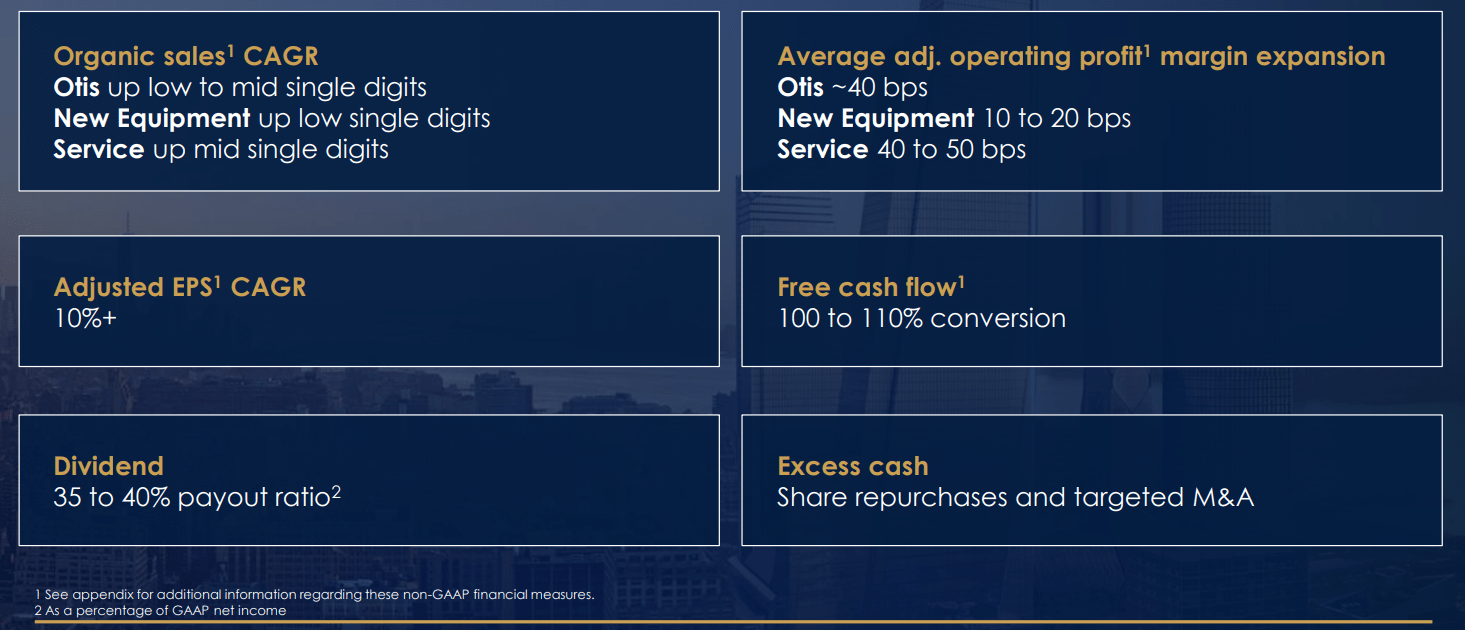 Source: Otis investor day presentation (Feb-22). |
In addition, Otis aims to return most of the Free Cash Flow (“FCF”) generated to shareholders in dividends and buybacks.
Otis operational performance has been broadly on target in 2022, despite macro headwinds.
Otis 2022 Outlook Summary
Otis’ latest 2022 outlook, as announced at Q3 results on October 26, is shown below alongside historical financials:
|
Otis Key Financials (2020-22E) 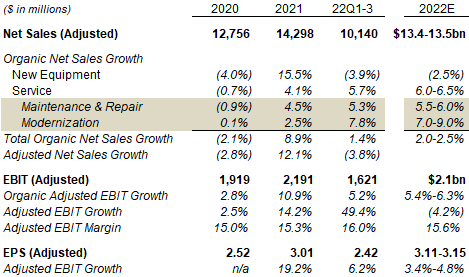 Source: Otis company filings. |
Excluding the loss of earnings from Russia (following its invasion of Ukraine), which rebased 2021 Adjusted EPS from $3.01 to $2.95, Adjusted EPS growth is expected to be 5-7% in 2022.
The latest outlook represents a small overall downward revision from the version released at Q2 2022 results, largely attributed to China. The main drivers are worse-than-before New Equipment sales, New Equipment EBIT margin and Service EBIT margin, partially offset by better-than-before Service sales and a large buyback:
|
Otis 2022 Financial Outlook (Current vs. Previous) 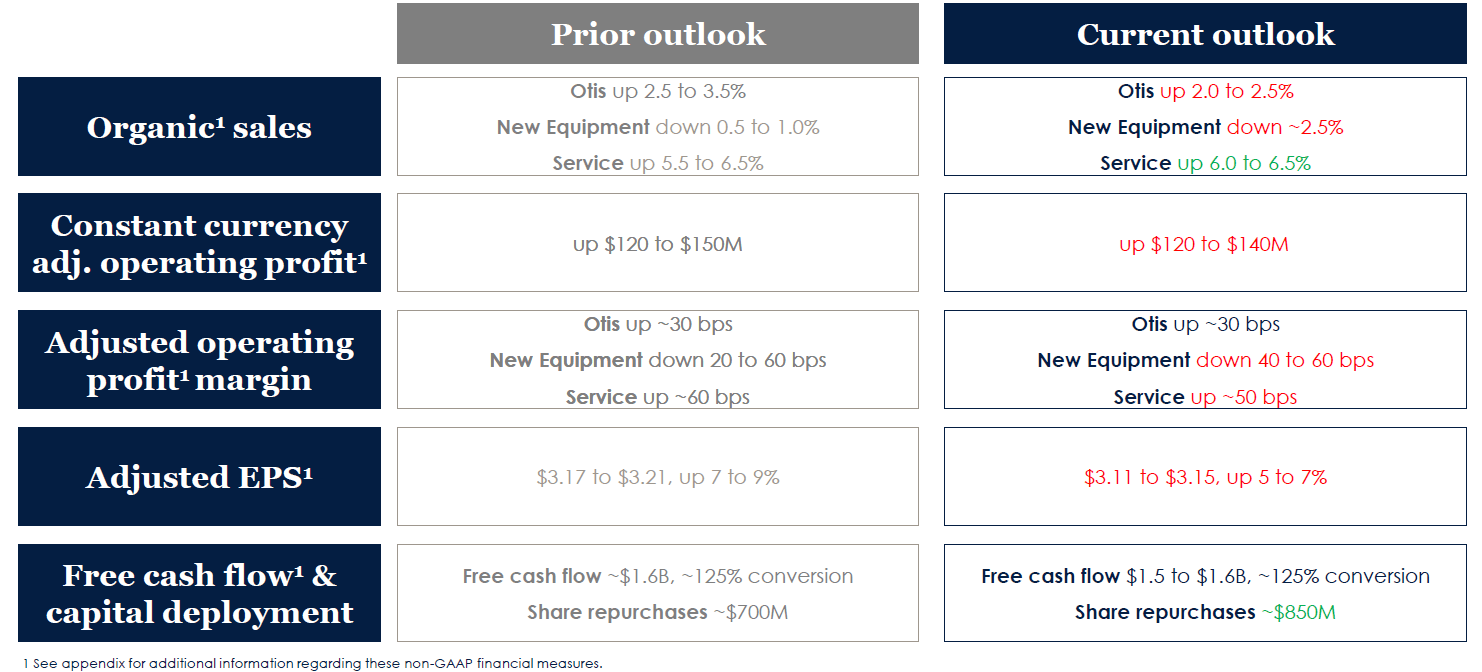 Source: Otis results presentation (Q3 2022). |
We believe the full-year outlook to be reasonable. Q3 year-to-date results have shown organic sales growth of 1.4% and organic Adjusted EBIT growth of $85m, slightly below what is implied by the full-year outlook:
|
Otis Adjusted P&L (Q3 YTD 2022 vs. Prior Year) 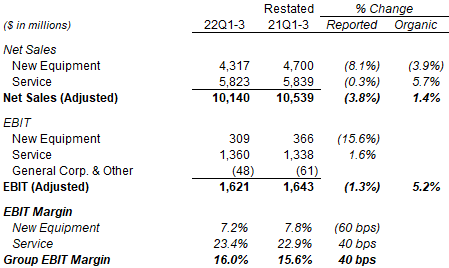 Source: Otis results release (Q3 2022). NB. Contribution from Russia excluded from both periods. |
Q3-only results showed slightly worse organic sales growth but a better Adjusted EBIT growth than Q1-3:
|
Otis Adjusted P&L (Q3 2022 vs. Prior Year) 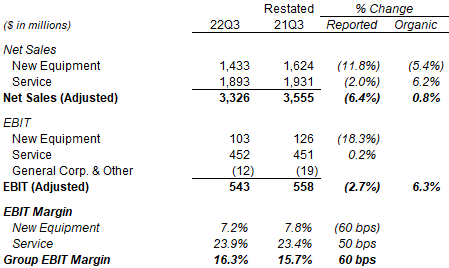 Source: Otis results release (Q3 2022). NB. Contribution from Russia excluded from both periods. |
The outlook implies a strong Q4 finish to 2022. This is not guaranteed but the size of disappointment is likely to be limited, given the outlook was issued in late October and little activity was likely during the Christmas period.
We discuss several areas of Otis’ performance in more detail below.
One-Off Macro Headwinds in 2022
While Otis’ Adjusted EPS growth is expected to fall short of its 10% medium-term target, it is in spite of macro headwinds including elevated inflation (the commodities part is worth $0.18), a stronger dollar ($0.29) and a slowdown in China (not quantified), offset by the buyout of Otis’ Spanish subsidiary (Zardoya), a lower tax rate and buybacks:
|
Otis Adjusted EPS Bridge (2022E vs. Prior Year) 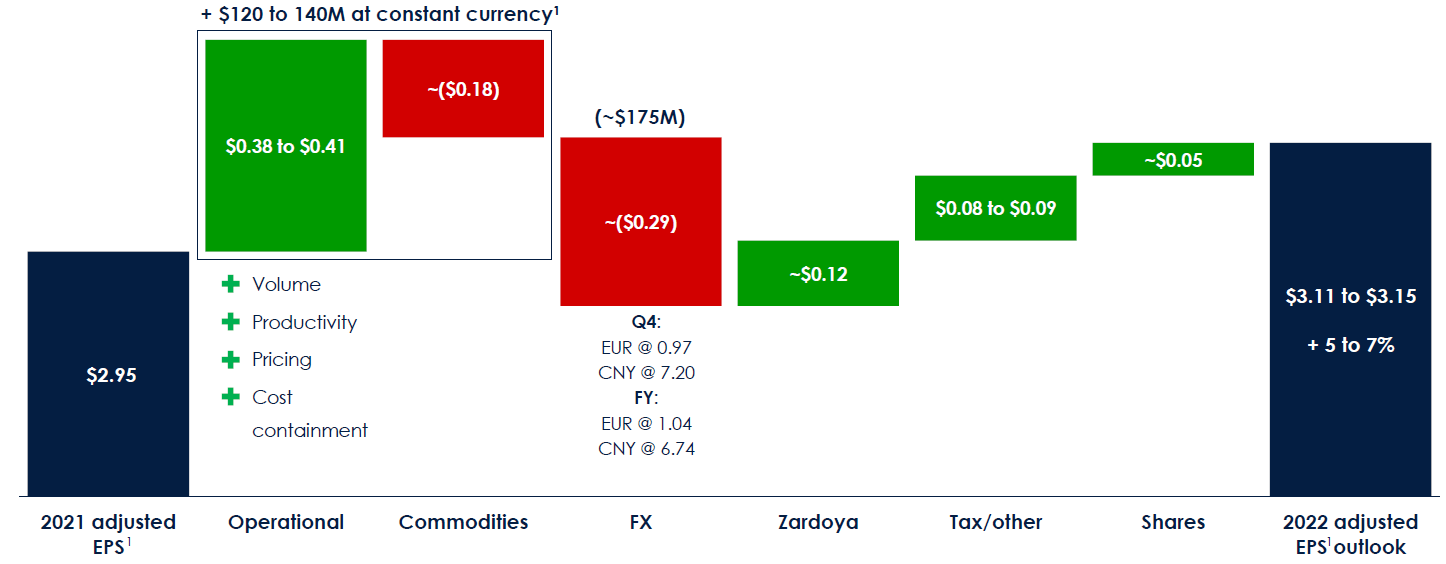 Source: Otis results presentation (Q3 2022). |
We believe these macro headwinds are mostly one-off in nature. Elevated inflation in 2022 can mostly be attributed to supply chain disruptions from COVID-19 and Russia’s invasion of Ukraine (especially in relation to energy), and has shown signs of moderating in recent months. The strengthening of the dollar is related to these factors and has also started to recede, with the USD/EUR rate declining by nearly 10% since peaking in late September.
Structural Drivers Behind Service Revenues
Service revenues are expected to grow 6.0-6.5% organically this year, having grown by 5.7% organically during Q1-3.
Within Service revenues, Maintenance & Repair revenues grew 5.3% organically in Q1-3, helped by structural drivers:
- The number of maintenance units was up 3.8% year-on-year as of Q3, with all regions growing but the highest growth in China at mid-teens plus and Asia-Pacific at mid-teens overall
- Maintenance pricing was up 3 ppt on a like-for-like basis as of Q3, strongest in developed, mature markets. Management stated that Otis has “inflationary clauses, most of them tied to labor, especially in Europe and North America”. The largest price renewals tend to take place in Q1 each year, which is why 2022 inflation has not yet been fully reflected in pricing to date, and more price increases can be expected at the start of 2023.
- Repair volume was up high-single-digits, helped by the 7m units globally that are over 20 years old
Modernization revenues, the other part of Service revenues, grew 7.8% organically in Q1-3, driven by the same aging base of units globally. Modernization revenue growth has accelerated to 10.3% on an organic basis as of Q3.
New Equipment Down, Only Due to China
New Equipment revenues are expected to decline in 2022, but only due to China. They are expected to fall by 2.5% organically, with low-to-mid-single-digit growth in EMEA, stability in the Americas, but a decline of 6% in Asia:
|
Otis 2022 New Equipment Organic Sales Outlook (Current vs. Previous) 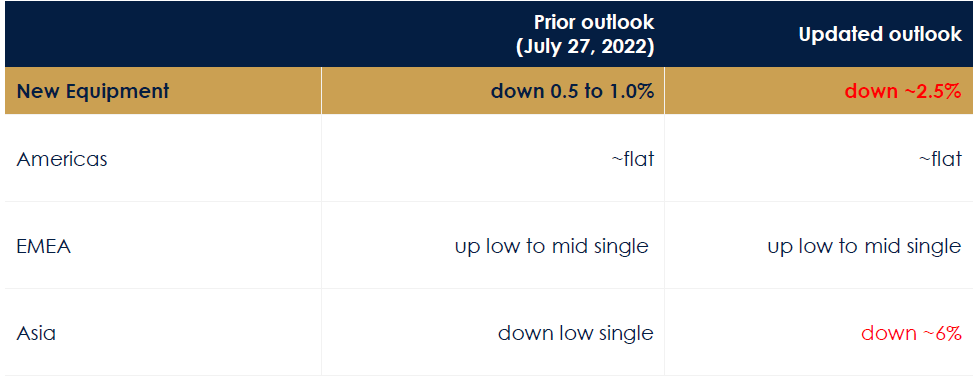 Source: Otis results presentation (Q3 2022). |
Within Asia, Otis expects its sales in China to decline organically by 10% (compared to a 15% decline for the whole market), offset by growth in the rest of the region.
New Equipment orders show a similar story, with 12-month rolling orders growing 7.6% year-on-year globally (in constant currency), including 23.0% in Americas and 10.3% in EMEA; Asia shows a 1.0% decline, again due to China:
|
Otis New Equipment Orders (Q3 2022) 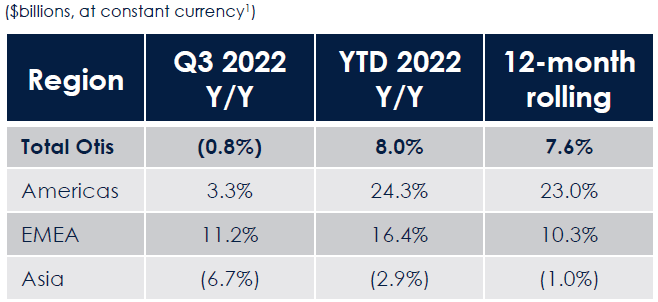 Source: Otis results presentation (Q3 2022). |
Q3 orders were down 0.8% year-on-year globally (again at constant currency). However, excluding China, Q3 orders were up 7.4% globally, “with growth in all regions” including Asia ex-China up 10% (driven by South Korea and India).
The environment in China appears to have improved since November, with the government announcing a number of policies to support the property sector in mid-November, and abandoning significant parts of its “Zero COVID” restrictions in December. These can help Otis’ revenue growth in China to recover sooner.
European Market Still Looks Solid
The European market looks solid despite the region’s larger macro headwinds.
Otis CEO Judith Marks was reassuring when asked about a potential European construction slowdown on the Q3 call:
“On the general macroeconomics in Europe, so far, I got to tell you, especially on the New Equipment side, it looks good in 2022. Orders are up this quarter, 11%, 10.3% for the 12-month roll. We’re watching the headwinds, but building permits are still holding. So, we haven’t seen that change (that the analyst was asked about)”
Marks was also confident about Otis’ ability to raise Maintenance pricing with inflationary clauses in Europe, highlighting the region as having the highest potential for repricing.
Valuation – Are Otis Shares Overvalued?
At $78.82, with respect to 2021, Otis shares are trading at a 25.8x P/E and a 4.1% FCF Yield; relative to the mid-point of the 2022 outlook, the P/E is 25.3x and the FCF Yield is likely to be above 4%, as FCF (management definition) is expected to be similar but dividends to non-controlling interests should be much lower after the Zardoya buyout:
|
Otis Earnings, Cashflows & Valuation (2019-22E) 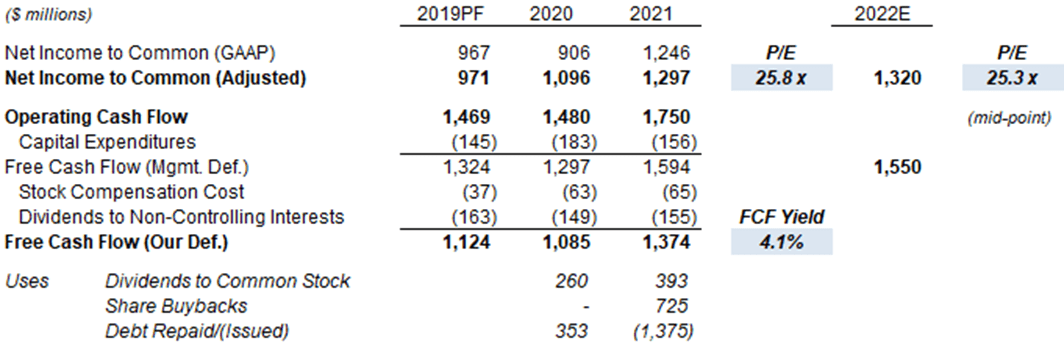 Source: Otis company filings. |
Otis pays a dividend of $0.29 per share (raised 21% in April), or $1.16 annualized, equivalent to a 1.5% Dividend Yield. Management targets a Payout Ratio of 35-40% (relative to GAAP Net Income, but this is similar to Adjusted).
Share buybacks are now expected to be $850m for the full-year, after Otis completed the original $700m target early in Q3. The $850m figure is equivalent to 2.5% of the current market capitalization.
We expect buybacks to increase over time. Otis also spent $500m to pay down debt in H1 but none in Q3. Net Debt / EBITDA is expected to be “just over 2x” at year-end, where 2x has been described by management as “a good number” at the investor day in February, meaning that all future FCF will likely to be spent on dividends and buybacks.
Otis Stock Forecasts
We keep most of the assumptions in our forecasts unchanged, except updating 2025 EPS and share count in line with latest management guidance. We now assume:
- 2022 EPS of $3.13 (was $3.19)
- 2022 share count of 420.2m
- 2023 Net Income growth of 10.5%
- From 2024, Net Income growth of 8.0%
- From 2023, share count to fall by 2.0% each year
- From 2023, dividends to be based on a Payout Ratio of 35%
- 2025 year-end P/E multiple of 29.0x
Our new 2025 EPS estimate of $4.29 is 2% lower than before ($4.37):
|
Otis Illustrative Return Forecasts 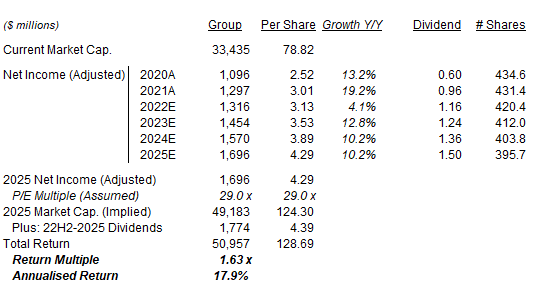 Source: Librarian Capital estimates. |
With shares at $78.82, we expect an exit price of $124 and a total return of 63% (17.9% annualized) by 2025 year-end.
Is Otis Stock A Buy? Conclusion
We reiterate our Buy rating on Otis Worldwide Corporation stock.
Be the first to comment