

supersizer/E+ via Getty Images
Investment Summary
Following its Q3 FY22‘ numbers I’ve reiterated the buy thesis on Option Care Health, Inc. (NASDAQ:OPCH). My previous analysis identified numerous equity premia to harvest within this name, shares have traded in sideways consolidation whilst backing and filling to the current OPCH market cap. Strong fundamental momentum continued for OPCH this quarter – particularly in return on investments and FCF growth. With this in mind, shares look fairly priced at $51, a 24% re-rating from our previous valuation. Portfolio testing of OPCH into an equity risk budget is also supportive of including the stock into cross-asset portfolios. Here I discuss each of the above in more detail. Net-net, we continue to see OPCH as a buy, with uncorrelated alpha available to add into equity portfolios.
OPCH Q3 earnings indicative of full-year trends
The company’s 3rd quarter numbers were strong with upsides versus consensus at the top and bottom lines, prompting management to raise full-year guidance. Quarterly revenue grew 14.5% YoY to $1.02 Billion (“Bn”). It was the first >$1Bn quarter for OPCH, and top-line growth continues to outpace quarterly market growth forecasts of 3.34% [8.6% annualized] for the global home infusion therapy sector.
Assuming these rates, the company presumably gained market share at this above-market growth rate, along with EPS growth of 5% YoY and TTM ROIC of 10.81%. Management talked of a 120bps or $12mm headwind from cost-inflation, and foresee a further $10-$12mm per quarter impact from inflationary pressure. As such, Q3 gross margin tightened 140bps YoY to just 21.4%. This would be a figure to keep a close eye on looking ahead. Despite this, operating income spiked 14.8% YoY to $60.7mm, and this pulled down vertically to a 500bps YoY gain in earnings to $0.21 per share. OPCH also grew CFFO 18.3% YoY to $87.14mm. The cash flow to net income ratio is 2.2x suggesting there’s a high degree of cash backing OPCH’s valuation.
Exhibit 1. OPCH Quarterly gross profit margin 140bps behind Q3 FY21′
Data: OPCH Q3 FY22 10-Q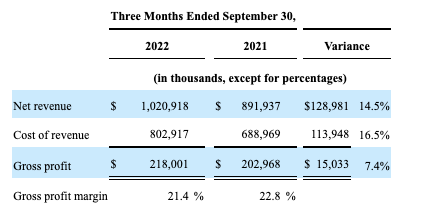
Question is how did OPCH supplement the downside in quarterly gross profit with income from its investments? As seen in Exhibit 2, OPCH has been steadily growing return on invested capital (“ROIC”) since FY16. After two cyclical lows the company now delivered a TTM ROIC of 10.81% last quarter, marginally behind its WACC of 11.96%. Whilst this produces an economic loss of $23.85mm, numbers are improving substantially here over the last 3 quarters to date.
A few important trends are therefore noted from the chart below. In the periods where FCF has pushed lower, or there’s been an outflow of FCF, OPCH has managed to tick its return on investments higher. This happened between Q2 FY17′-Q3 FY18′ and several times across FY20′-date. This tells me OPCH investing wisely and moving capital into segments of immediate cash return. In the same vein, the overall trend in FCF and ROIC has been married quite closely, with equally close dispersion. This illustrates to me success of the company’s capital budgeting cycle and brings fundamental momentum into the investment debate.
Exhibit 2. Favourable coupling between FCF and ROIC indicating success of OPCH’s capital budgeting cycle.
Data: HB Insights, OPCH SEC Filings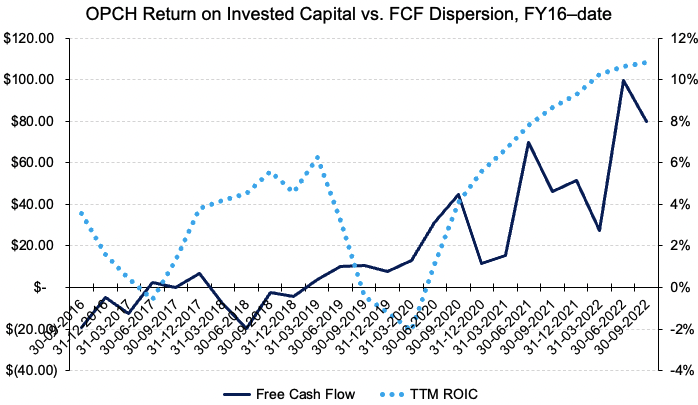
Valuation
Looking at earnings and FCF as drivers of valuation, there’s mixed data on at what price OPCH should fairly trade. The market has OPCH priced at 29.3x TTM FCF at its current market cap. As seen in Exhibit 3, our FY22 FCF estimates of $1.39 per share suggest it should be valued at ~$74.85, indicating FCF expectations might yet to be priced in. Coupled with double-digit ROIC outlined above, I believe this is a key factor driving equity returns in OPCH moving down the line.
Exhibit 3. FCF upside may yet to be reflected into OPCH share price
Image: HB Insights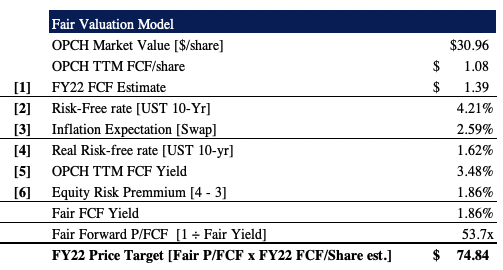
Meanwhile, as observed in Exhibit 4, the lack of forward earnings upside in FY22 looks to have been well appreciated by the market. Considering our next 12 months (“NTM”) EPS estimates for OPCH, shares look to be slightly overpriced and should be trading at ~31x earnings vs. market consensus of 39x forward earnings. This would price the stock fairly at $28.46. I advocate to use TTM earnings in this kind of valuation as the trailing earnings have already priced in the combination of historical and expected data up until that point, thus providing a more accurate base to work from. Alas, the TTM earnings yield for OPCH is weak at 3.2%, and when paying 31.3x P/E this drops to 0.10% for the investor. These are factors for consideration.
Exhibit 4. Using EPS estimates then it may be that shares are less attractive. Earnings yield of 3.2% and paying 31x P/E this squashes to 0.10%.
Data & Image: HB Insights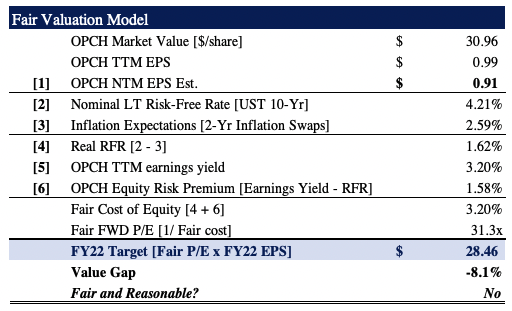
Given the variance between the two outcomes taking the arithmetic mean is appropriate, a price objective of $51.65, or ~66% upside from the current share price.
Equity portfolio allocation
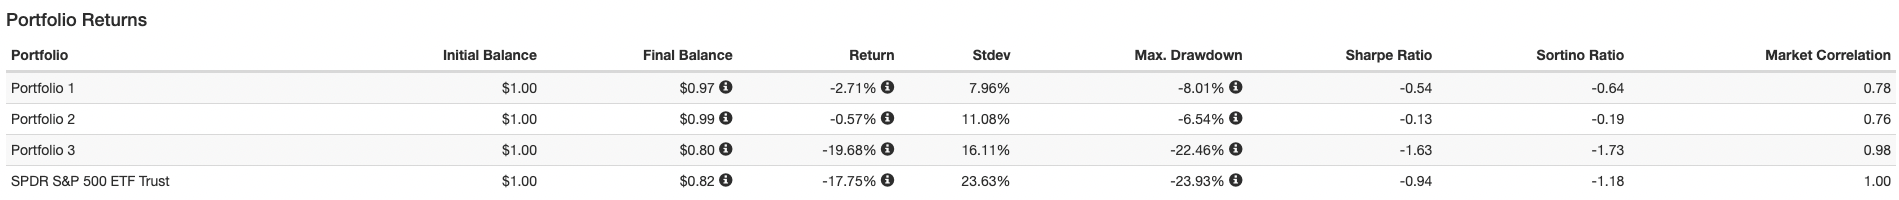
Given the upside in valuation it’s appropriate to understand OPCH’s allocation within an equity risk bucket. In FY22 balanced portfolio’s continue to outperform traditional setups, such as 60/40 [seen in Portfolio 3 below] and the SPX benchmark. Equities have also underperformed as a strategic allocation and therefore it’s essential to gauge how OPCH would fit in tactically.
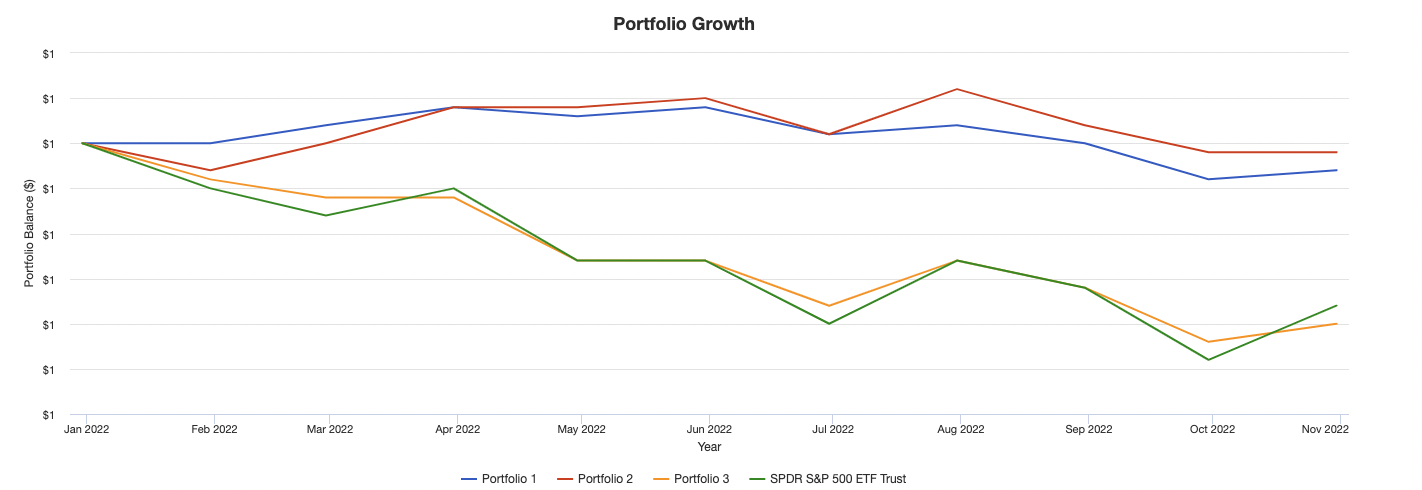
As seen in the charts below, inclusion of OPCH into a balanced portfolio on equal weight [16.66%, 50% equity risk budget] outpaced the 60/40 setup and SPX benchmark from Jan-October this year. Since the June bounce in equities, holding OPCH within the equity bucket on equal weight produced outsized return above the balanced portfolio benchmark and with an equity market beta of 0.76, max drawdown of 6.54% and standard deviation of ~11.1%. With OPCH weighted at total weight of 1.66% [5.2% of equity budget] results are similar, with slight changes to beta and drawdown.
For diversified portfolios, this suggests adding OPCH to the equity risk budget with a weight of 1.66%-16.66% has potential to improve portfolio returns without adding to equity beta or drawdown.
Exhibit 5. Portfolio testing, equity risk allocation and tactical weighting examination [weight shown 50% of equity risk budget]
Data: HB Insights, Portfoliovizualiser Data: HB Insights, Portfoliovizualiser Data: HB Insights, Portfoliovizualiser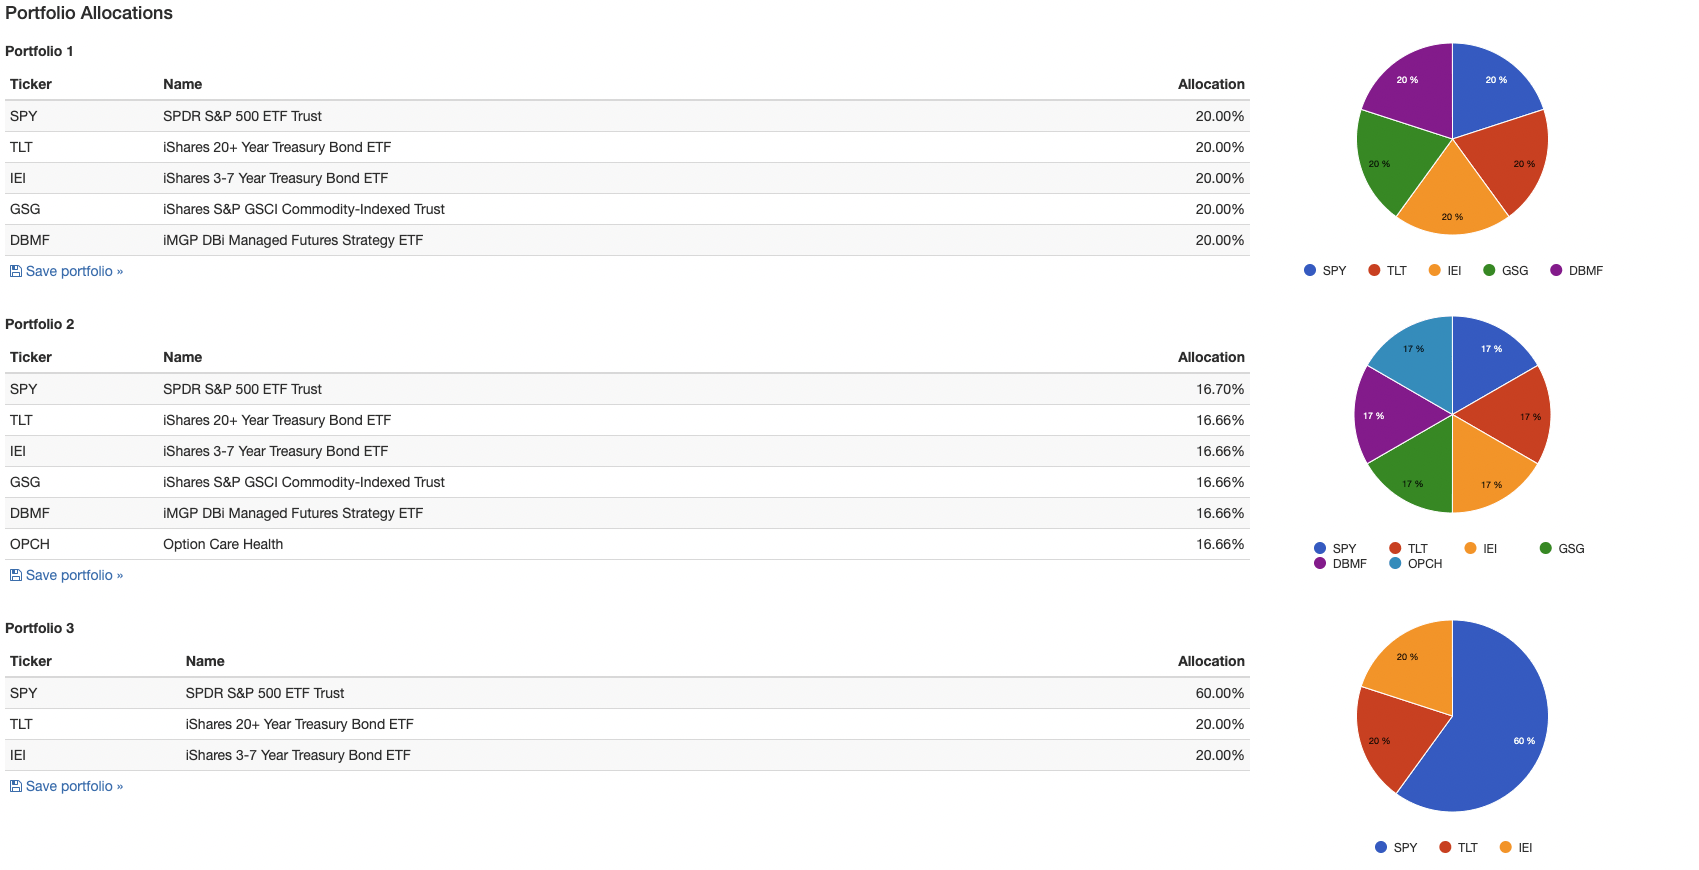
Net-net, the case for including OPCH into cross-asset portfolios remains. My estimates suggest there’s upside from FCF yet to be priced into the stock and this implies an alpha opportunity. Coupled with fundamentals, backtesting of OPCH YTD into a balanced portfolio setup is supportive of inclusion of the stock into equity risk budget’s looking ahead. Rate buy , $51 per share valuation.
Be the first to comment