

Crude Oil Technical Forecast Following Cyclical Pattern
After an impressive start to 2021, the oil forecast for the second quarter of the year is lacking an overly optimistic tone given a weaker picture for demand and stronger growth in rival supply, as was presented by OPEC’s outlook for the next two quarters.

Recommended by Daniela Sabin Hathorn
Download the full Oil 2Q Forecast!
Looking to the US Energy Information Administration (EIA) for guidance, their forecast sees declining crude oil prices and a more balanced oil market, which reflects global supply surpassing demand during the second half of 2021. Although the EIA expects inventories to fall by 1.2 million b/d in the first half of 2021, increases in global oil supply will contribute to inventories rising by almost 0.4 million b/d in the second half of 2021. As the chart below shows, their forecast based on confidence intervals is that WTI oil prices are likely to stay between $50 and $78 per barrel with a slight declining tendency.
WTI Crude Oil Price Forecast
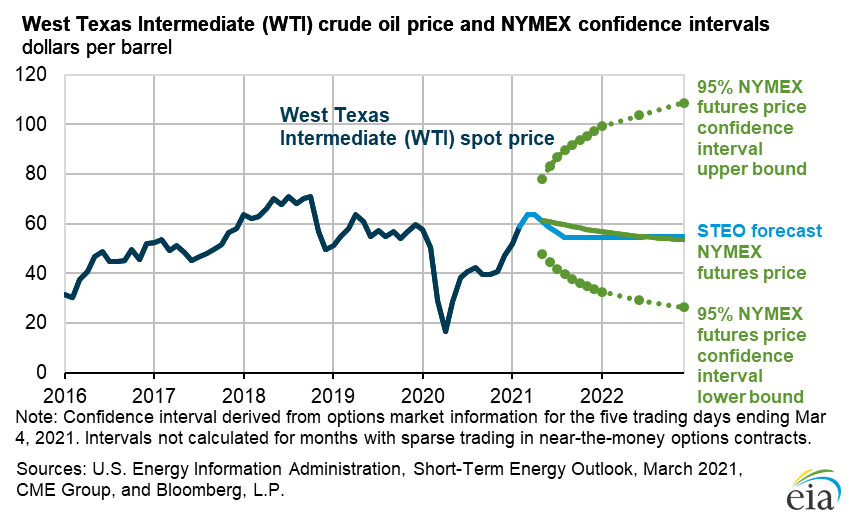
Source: EIA
Looking at the US crude oil weekly chart, recent price action seems to have followed similar patterns displayed back when the price was around current levels a few years ago. Since May 2019, WTI crude oil has faced three major pullbacks until the Covid-19 meltdown in 2020. In all three of these instances, its price retraced between 19% and 25%, coming in close to the 2016/17 horizontal mean-reversion line at 48.85.
Following this theme, the recent pullback to end the first quarter may extend further before we see a reversal on the back of bullish momentum building on lower, more attractive prices. A pullback on average like the three seen up until March 2020 could witness current price fall back towards the 51.80 mark. This falls in line with the 76.4% Fibonacci retracement from the Covid-19 induced meltdown and recent support.
WTI Crude Oil Price – Weekly Timeframe (October 2017 – March 2021)
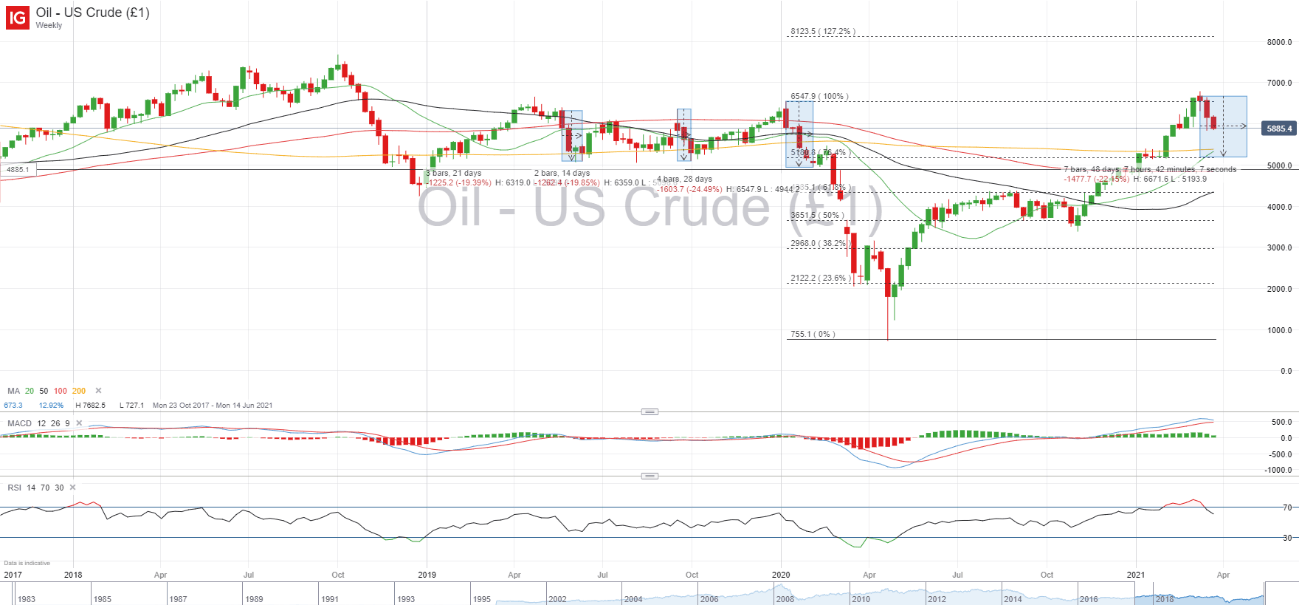
Source: IG, Chart prepared by Daniela Sabin Hathorn
Zooming in to a daily timeframe, bearish momentum seems to have subdued slightly in the final week of March, but risk continues to be tilted to the downside, as do momentum indicators like the MACD and the stochastic oscillator. The fall below the ascending trendline from the November 2020 lows is also a cause for concern for short-term oil bulls. This plays well into the wider correction suggested by the weekly chart, at which point 51.75 looks like a strong area of support, followed by the 48.85 horizontal line.

Recommended by Daniela Sabin Hathorn
How to Trade Oil
WTI Crude Oil Price – Daily Timeframe (August 2020 – March 2021)
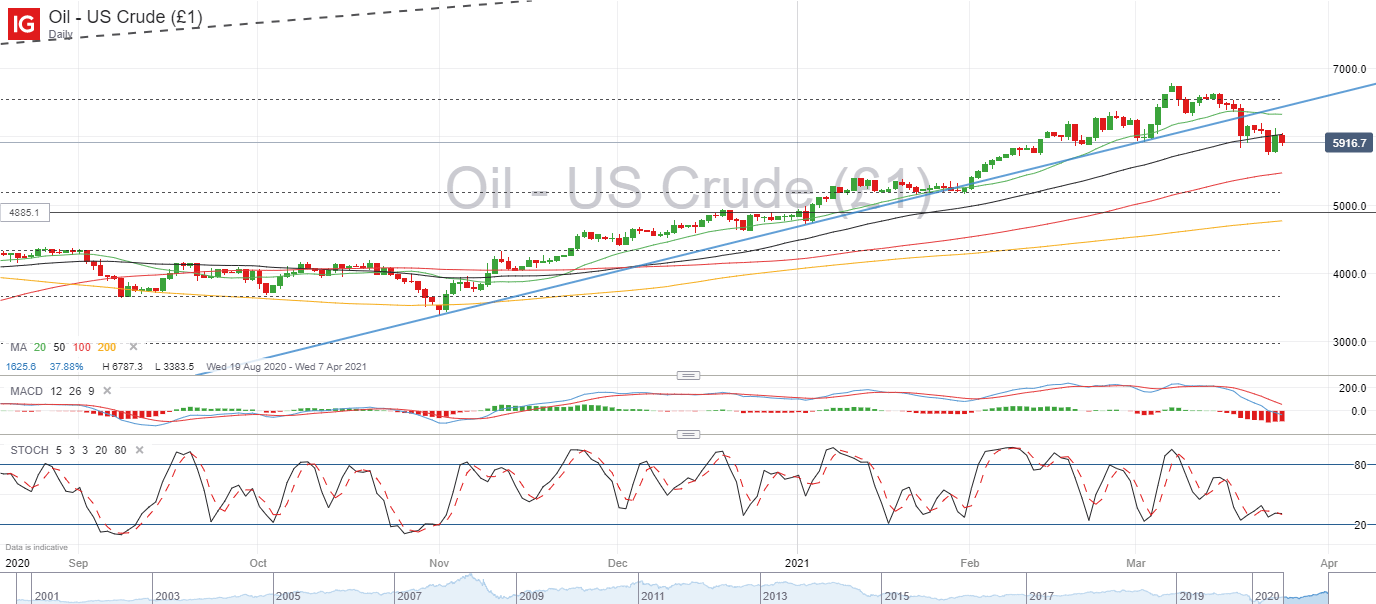
Source: IG, Chart prepared by Daniela Sabin Hathorn
Be the first to comment