

Oil Price Talking Points
The price of oil extends the advance from the previous week as severe weather conditions in Texas force US producers to cut or freeze crude output, and the persistent overbought reading in the Relative Strength Index (RSI) may continue to coincide with higher oil prices like the behavior seen earlier this year.
Oil Price to Hold Above Pre-Pandemic Levels on Overbought RSI Reading
The price of oil appears to be breaking out of the ascending channel established in November as it climbs to a fresh monthly high ($61.26), and crude may continue to trade above pre-pandemic levels as US inventories are expected to narrow for the fourth consecutive week.
Fresh figures from the Energy Information Administration (EIA) are anticipated to show crude stockpiles contracting 2.175M in the week ending February 12 after falling 6.644M the week prior, and signs of stronger consumption may keep crude prices afloat as Saudi Arabiastays on track to reduce supply by 1 million b/d until April.
It remains to be seen if US output will reflect a similar dynamic amid the weather related disruption in Texas, with a decline in weekly field production likely to generate a bullish reaction in the price of oil especially as the Organization of the Petroleum Exporting Countries (OPEC) look poised to regulate the energy market in 2021.
With that said, the price of oil may continue to retrace the decline 2020 high ($65.65) ahead of the next OPEC Joint Ministerial Monitoring Committee (JMMC) meeting on March 3 as it continues to track the upward trending channel carried over from November, and the persistent overbought reading in the Relative Strength Index (RSI) may continue to coincide with higher oil prices like the behavior seen earlier this year.
Oil Price Daily Chart
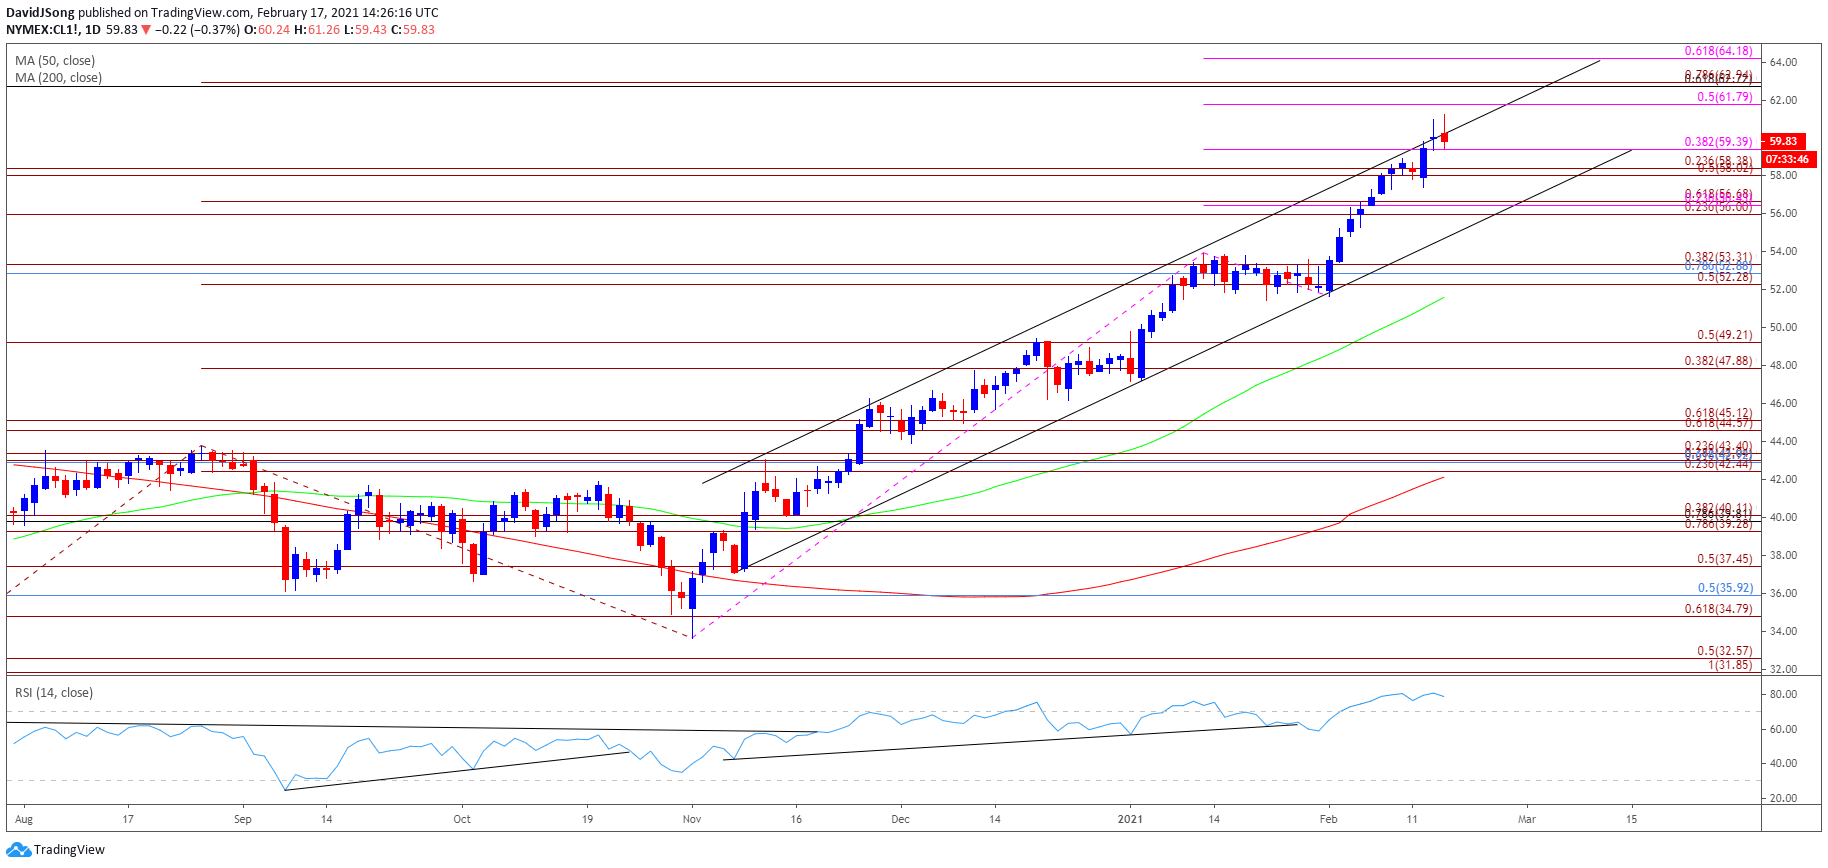
Source: Trading View
- Keep in mind, crude broke out of the range bound price action from the third quarter of 2020 following the failed attempt to close below the Fibonacci overlap around $34.80 (61.8% expansion) to $35.90 (50% retracement), and the price of oil may continue to retrace the decline from the 2020 high ($65.65) as both the 50-Day SMA ($51.62) and 200-Day SMA( $42.15) track a positive slope.
- More recently, crude has broken out of the range bound price action carried over from the end of January to extend the upward trend established in November, but the Relative Strength Index (RSI) has failed to keep up as a break of trendline support emerged ahead of February.
- Nevertheless, developments in the RSI still offer a constructive outlook as the oscillator continues to hold above 70, with the extreme reading likely to be accompanied by higher oil prices like the behavior seen earlier this year.
- The break/close above the $59.40 (38.2% expansion) region brings the Fibonacci overlap around $62.70 (61.8% retracement) to $62.90 (78.6% expansion) on the radar, with the next area of interest coming in around the $64.20 (61.8% expansion) area.

Recommended by David Song
Traits of Successful Traders
— Written by David Song, Currency Strategist
Follow me on Twitter at @DavidJSong
Be the first to comment